Sive Morten
Special Consultant to the FPA
- Messages
- 18,695
Fundamentals
Gold market has reacted on the same event as EUR and other markets – speech of Janet Yellen. On Friday prices were little changed, taking a breather after a two-day rise but underpinned by expectations that the nominee to lead the Federal Reserve, Janet Yellen, would continue easy monetary policy in that role. U.S. regulatory filings for the third quarter showing that prominent Hedge fund Paulson & Co maintained its stake in SPDR Gold Trust <GLD>, the world's biggest gold-backed exchange-traded fund, also supported prices, traders said. Bullion ended the week nearly flat after dropping sharply over the last two weeks as strong October U.S. nonfarm payrolls stirred fears that the Fed would taper its bond-buying stimulus as early as December. However, Yellen told a Senate Committee on Thursday the Fed's economic stimulus would continue, prompting gold speculators to buy back their bearish bets for fear that bullion prices will rise further. "Gold is rallying on the news but basically it's just short-covering," said Thomas Vitiello, principal of Aurum Options Strategies. "It's not necessarily bullish yet."
At the same time hedge fund Paulson & Co maintained its stake in SPDR Gold Trust, the world's biggest gold-backed exchange-traded fund, in the third quarter after slashing its holding by more than half in the second quarter. Other money managers and pension funds continued to cut their holdings, however, sparking fears that the exodus in gold led by institutional investors in the first half would continue as the economy improves. Outflows from the SPDR fund have amounted to more than 450 tonnes this year, driving its holdings to the lowest level since early 2009 at 865.71 tonnes.
CFTC data again has shown significant increase of short positions. But at this time open interest has drifted slightly higher. In general, if we take into consideration more extended period on the chart, then we will see that since May net long position has increased almost 2 times while open interest has fell. Right now we see three week in a row of increasing short position and since October open interest shows shy growth. Still honestly speaking, we would like to see more supportive dynamic from open interest to become more confident with started bearish action.
Monthly
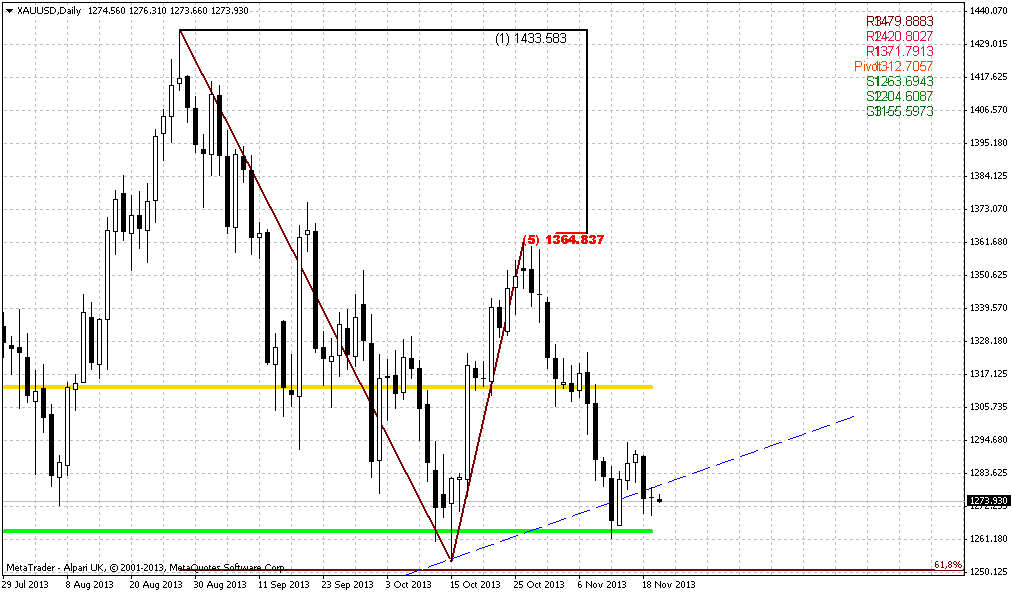
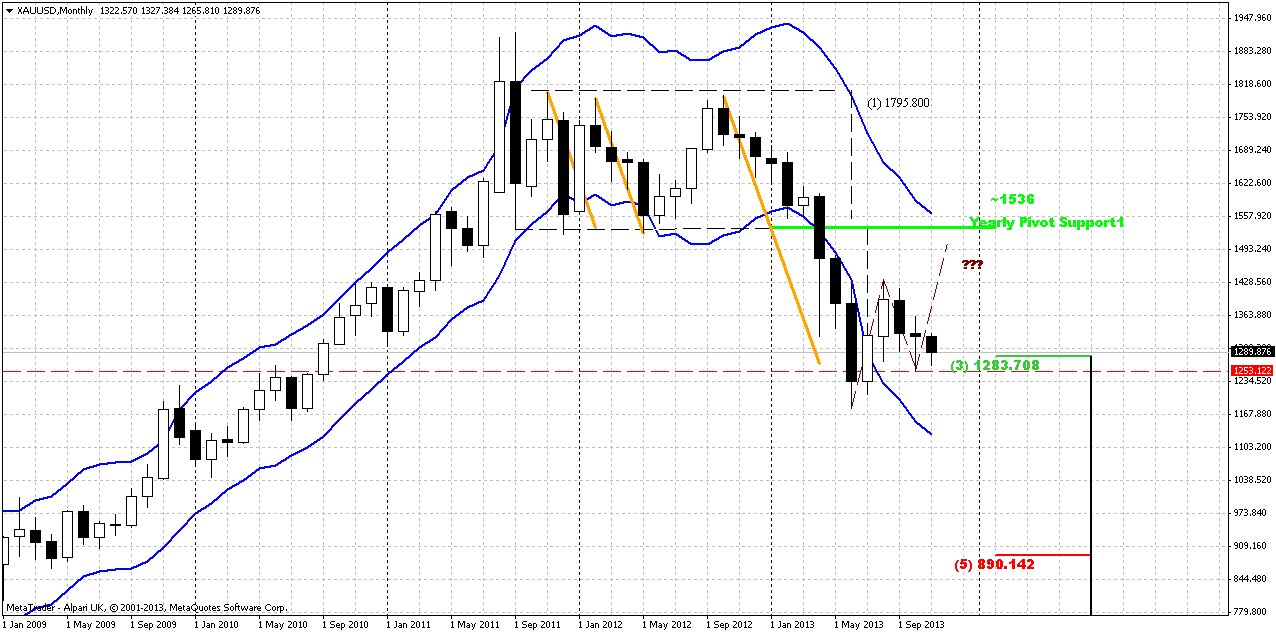
Whether we will get upward retracement and possible BC leg of larger AB=CD down move or not – that was our question for previous months and not much has changed here by far. As lows of October holds – chances are exist that market still could show upward action. While october has shifted to doji right in the end of the month and November has started from solid decline – now this fall calms down a bit and who knows, may be some recovery will happen. Fundamental situation and CFTC data stand not in favor of possible appreciation, but recent Yellen’s comments could support market in very short-term perspective. Seasonal trend is still bullish, but it is not always lead to growth. Sometimes, it could just hold depreciation and now we see something of this kind, since market stands in some range since August.
Our previous analysis (recall volatility breakout - VOB) suggests upward retracement. As market has significantly hit oversold we’ve suggested that retracement up should be solid, may be not right to overbought, but still significant. Take a look at previous bounces out from oversold – everytime retracement was significant. Thus, we’ve made an assumption of possible deeper upward retracement that could take a shape of AB=CD, and invalidation for this setup is previous lows around 1170s. If market will pass through it, then, obviously we will not see any AB=CD up.
Now market is approaching to previous lows and the question is whether they will hold or not.
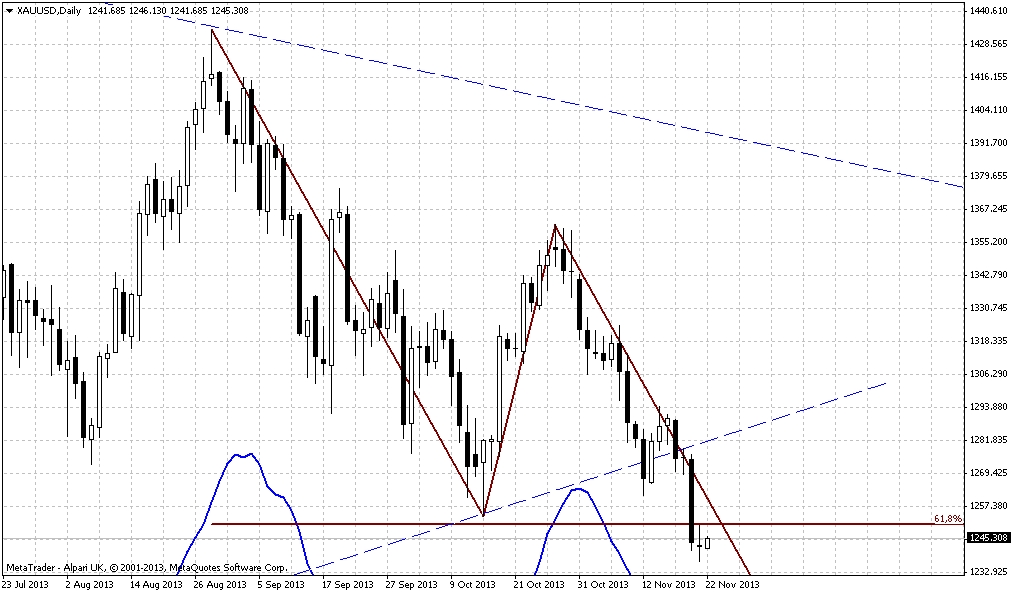
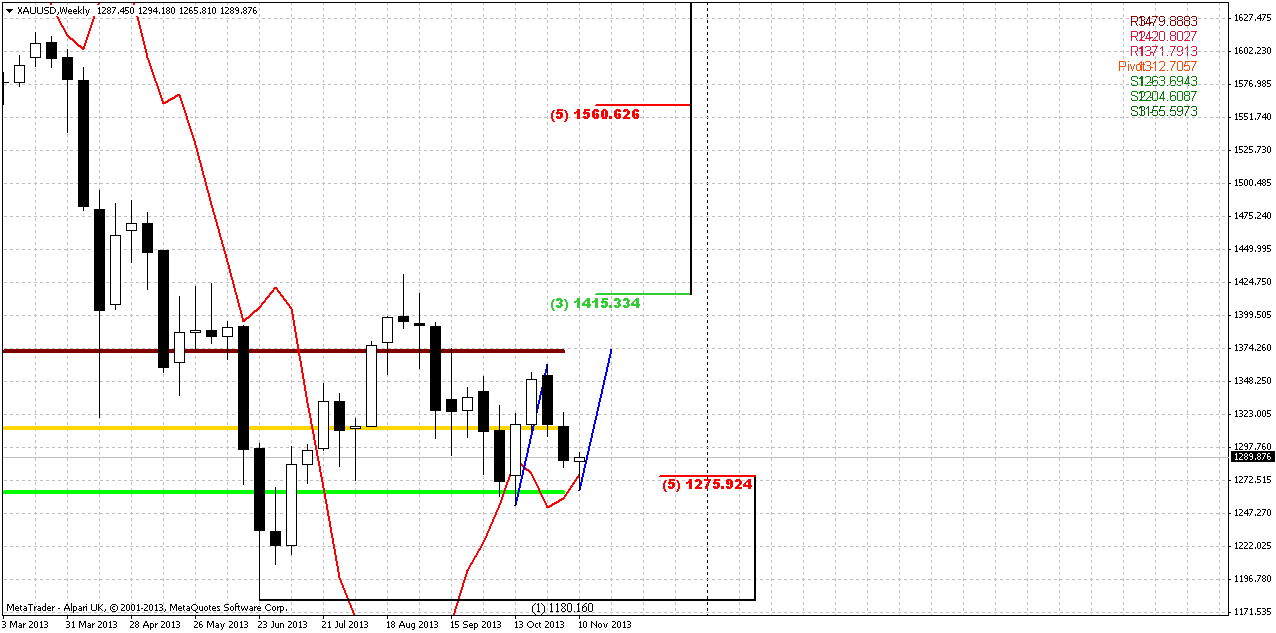
Weekly
This time frame puts the foundation for short-term trading. As market has reached the minimum target of bearish engulfing, that was suddenly formed, now price has opportunity to change direction for short-term and simultaneously do not break overall bearish development. So, guys, here we have bullish stop grabber pattern right at MPS1 and Fib support. Its minimum target stands around 1350 and it could be reached as AB-CD. Looking a bit further, theoretically it could even lead to butterfly sell appearing, but this is a bit early object for discussion. Conversely, invalidation point of grabber stands at its low – 1265 and if market will destroy it, we will return right back to bearish setup and butterfly “buy” on weekly that we’ve discussed earlier. Anyway, short-term development that could follow on coming week and completion of small AB-CD will not cancel bearish setup yet. From that standpoint we could say that we will be focused mostly on tactical trading rather on strategic on this week.
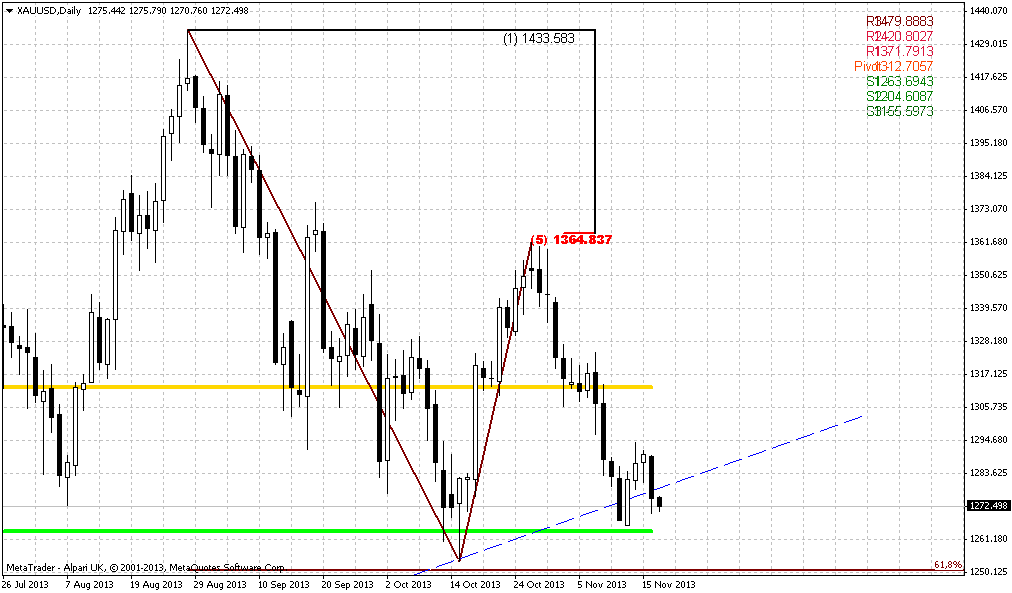
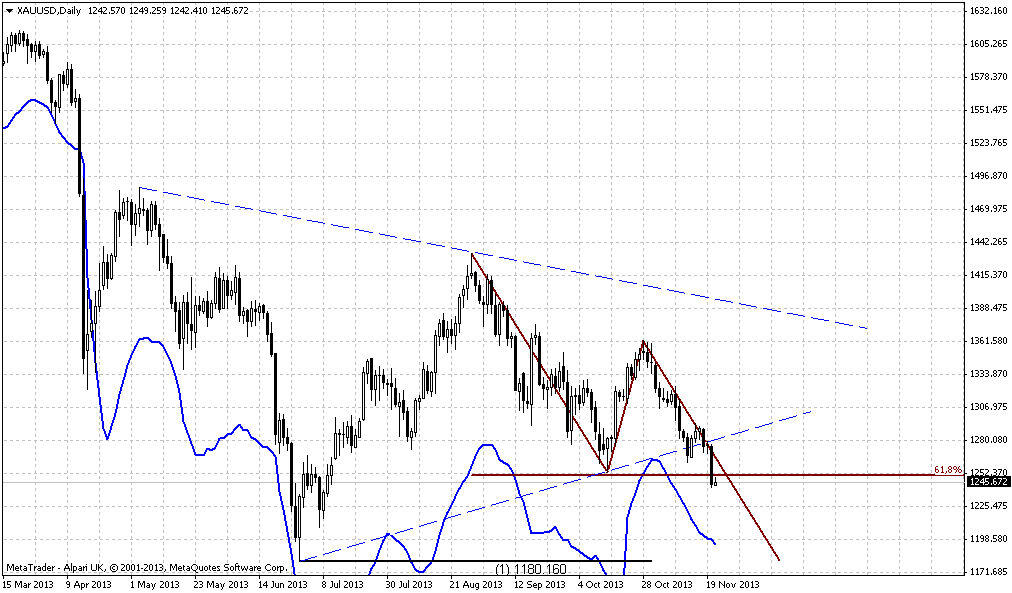
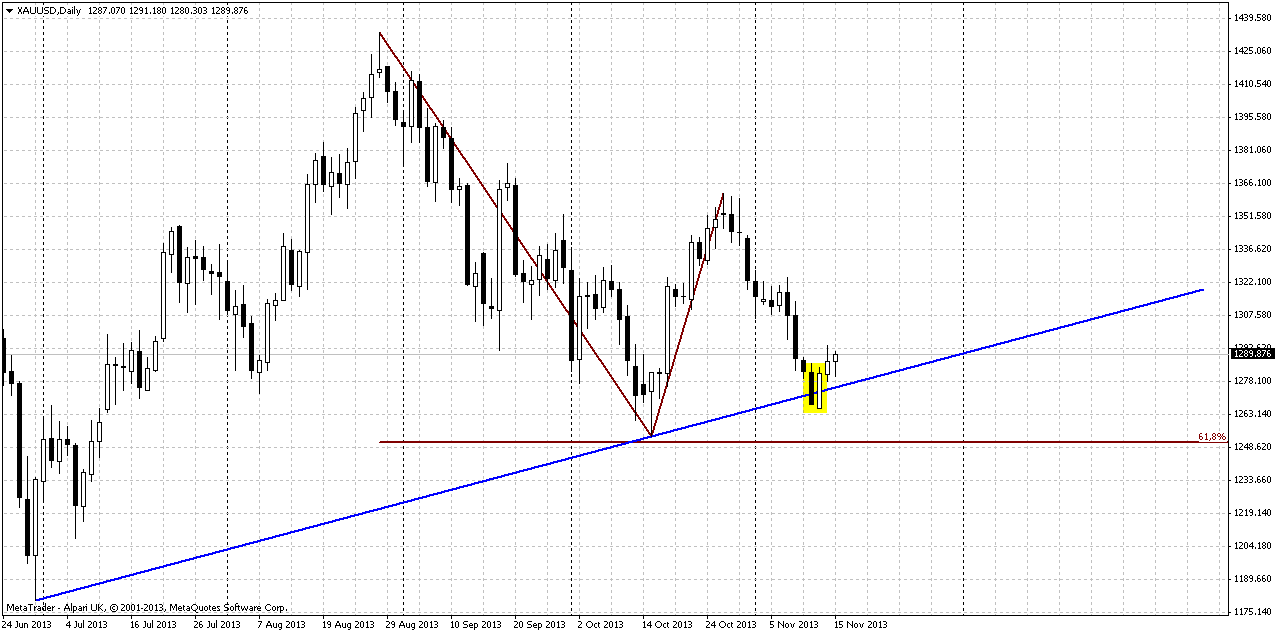
Daily
Trend is bearish here, market is not at oversold. In fact now situation mostly depends on what will happen with this engulfing pattern, because this pattern simultaneously is a swing of stop grabber on weekly chart. Other words, whether it will lead market to real bounce up or it will fail. The major worry with it is existing of AB=CD minor 0.618 target slightly under this pattern. Still, as we have pattern, let’s try to use it and focus particularly on it, and then we’ll see what will happen.
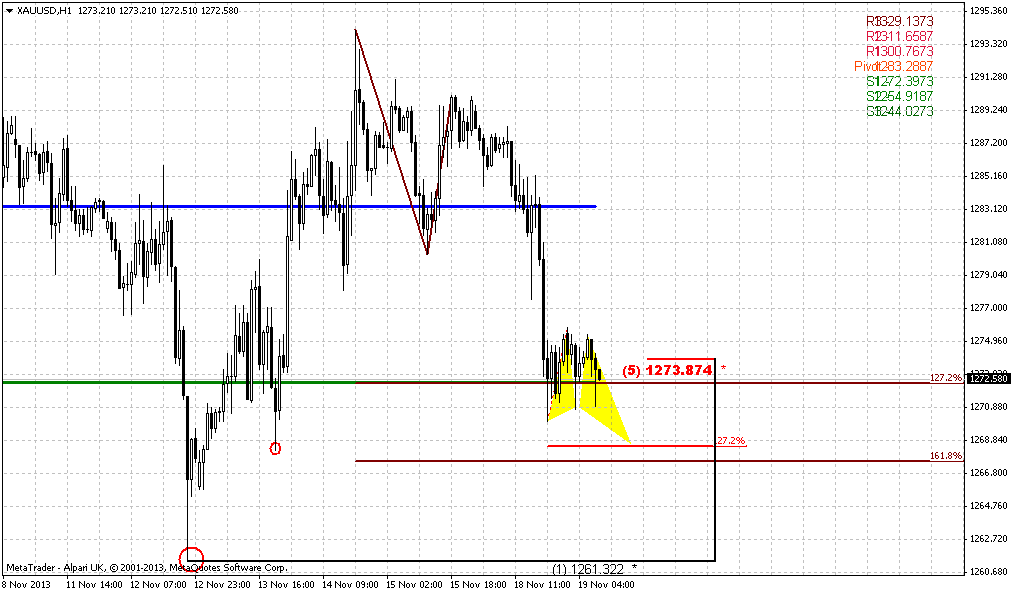
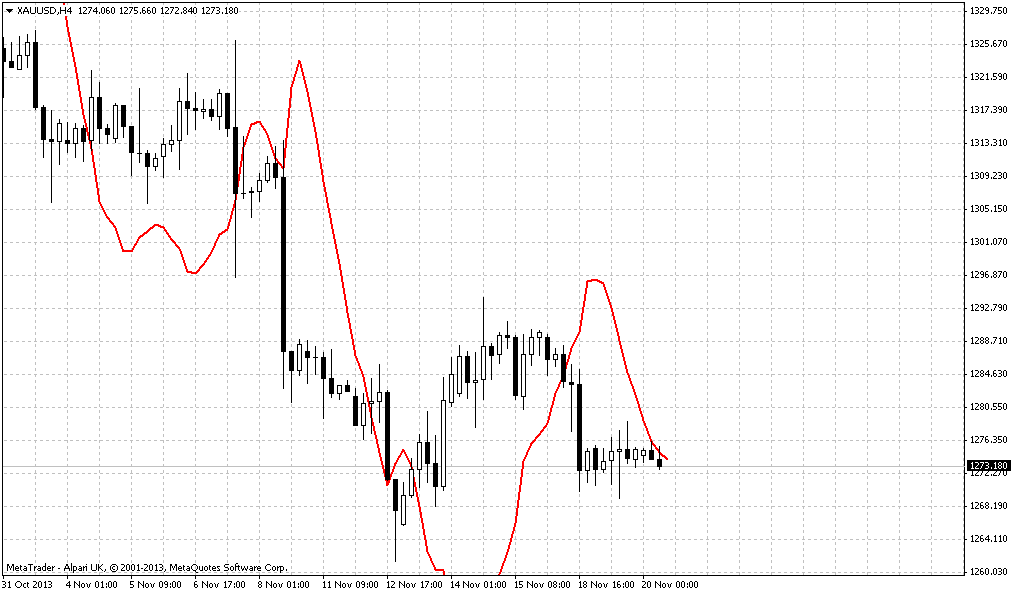
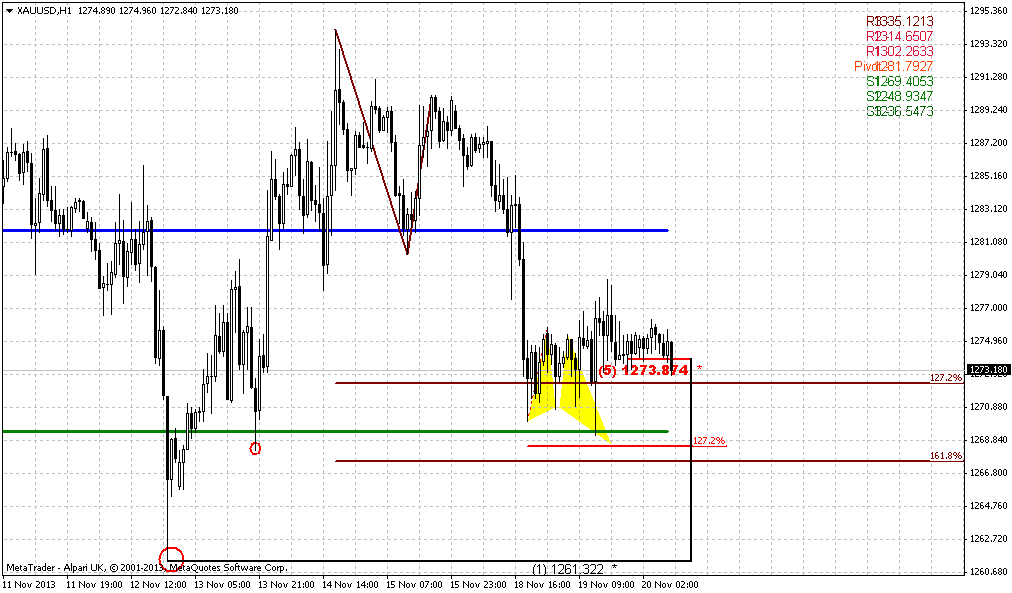
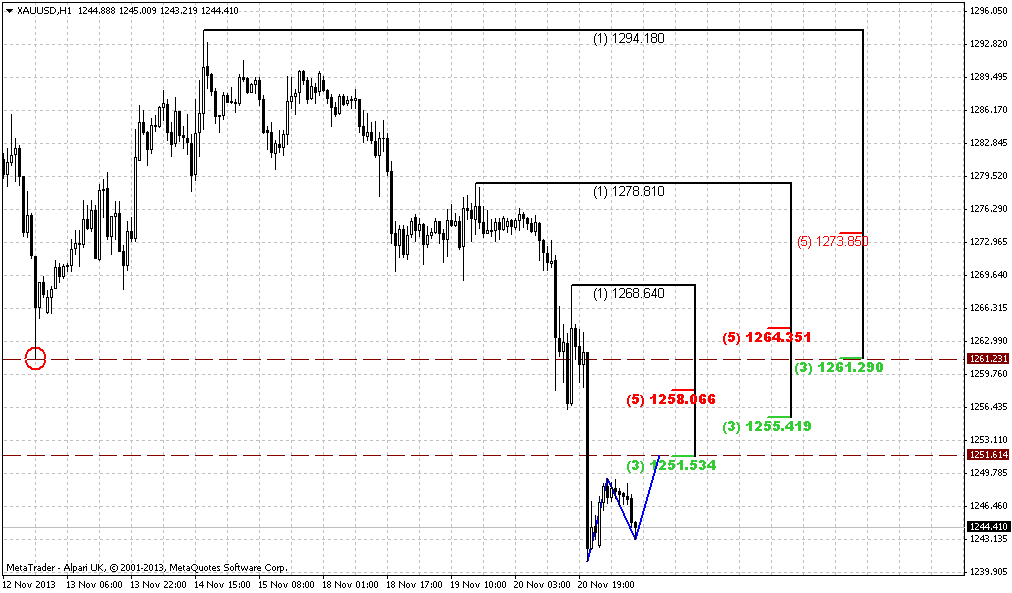
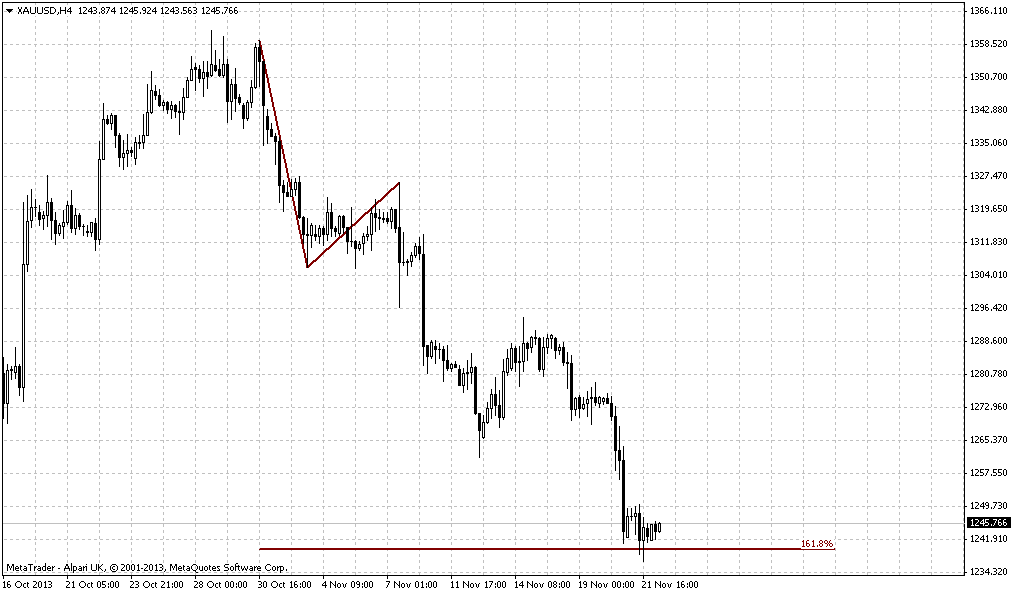
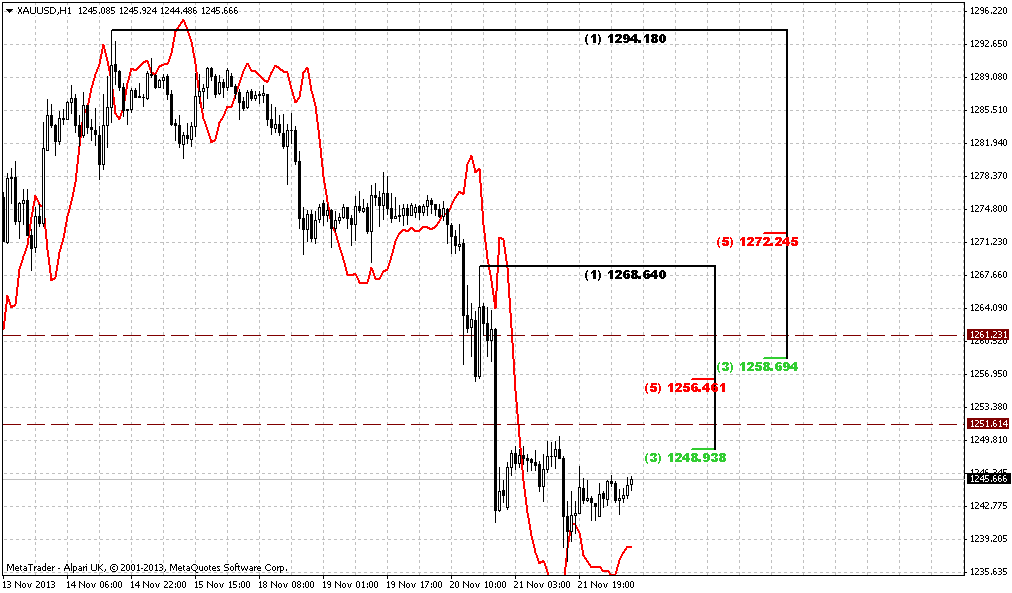
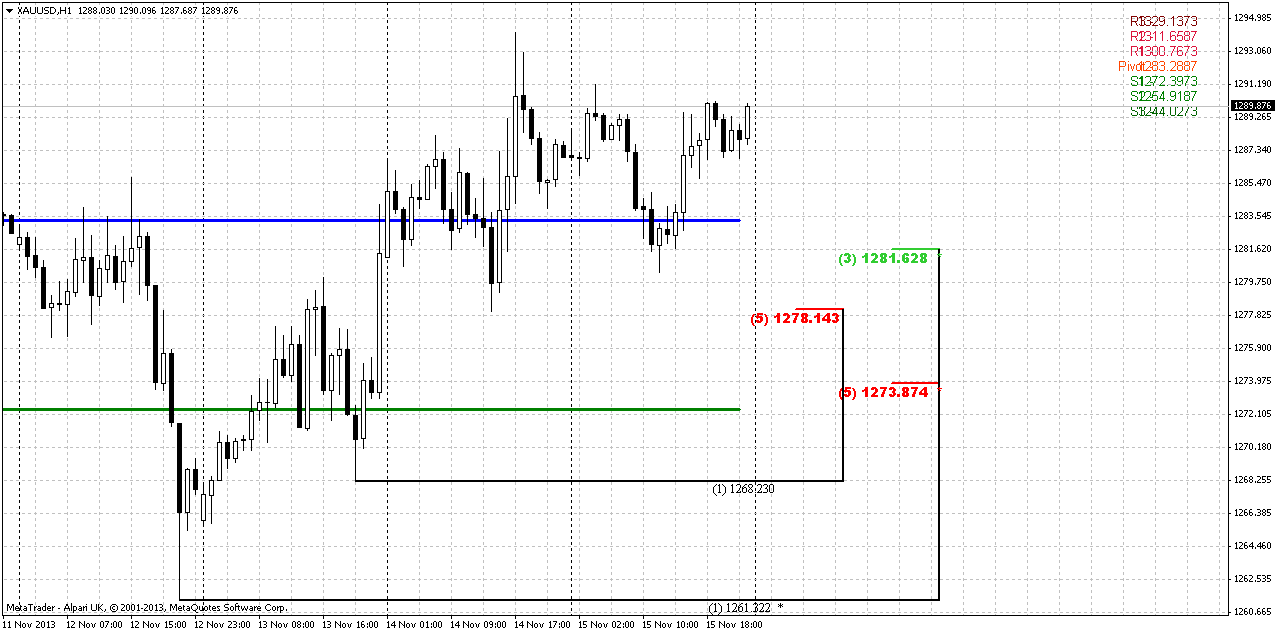
1-hour
On 4-hour chart I see nothing special, except may be existance of reversal swing up, that is greater than previous swing down. Hourly chart shows the swing of stop grabber itself. So, since we intend to try to trade it, there are two significant support areas. First one is K-support around WPP and second one is combination of WPS1 and 5/8 Fib support around 1272-1274. Currently is it unclear what particular level price could reach but both of them are suitable and will not cancel possible upward action. Although invalidation point of grabber is its low, we probably also should keep an eye on 1268 low. If it will be taken out, then chances that grabber will be cancelled increase significantly.
Gold has a habit to show deep retracements and current top shape blurly reminds H&S but it looks too skew and hardly worthy of relation on it.
Conclusion:
In short-term perspective we have clear pattern and will try to trade it on coming week. When situation with it will be resolved, we will understand overall situation clearer. Until this will happen our trading will be mostly tactical rather than strategic.
The technical portion of Sive's analysis owes a great deal to Joe DiNapoli's methods, and uses a number of Joe's proprietary indicators. Please note that Sive's analysis is his own view of the market and is not endorsed by Joe DiNapoli or any related companies.
Gold market has reacted on the same event as EUR and other markets – speech of Janet Yellen. On Friday prices were little changed, taking a breather after a two-day rise but underpinned by expectations that the nominee to lead the Federal Reserve, Janet Yellen, would continue easy monetary policy in that role. U.S. regulatory filings for the third quarter showing that prominent Hedge fund Paulson & Co maintained its stake in SPDR Gold Trust <GLD>, the world's biggest gold-backed exchange-traded fund, also supported prices, traders said. Bullion ended the week nearly flat after dropping sharply over the last two weeks as strong October U.S. nonfarm payrolls stirred fears that the Fed would taper its bond-buying stimulus as early as December. However, Yellen told a Senate Committee on Thursday the Fed's economic stimulus would continue, prompting gold speculators to buy back their bearish bets for fear that bullion prices will rise further. "Gold is rallying on the news but basically it's just short-covering," said Thomas Vitiello, principal of Aurum Options Strategies. "It's not necessarily bullish yet."
At the same time hedge fund Paulson & Co maintained its stake in SPDR Gold Trust, the world's biggest gold-backed exchange-traded fund, in the third quarter after slashing its holding by more than half in the second quarter. Other money managers and pension funds continued to cut their holdings, however, sparking fears that the exodus in gold led by institutional investors in the first half would continue as the economy improves. Outflows from the SPDR fund have amounted to more than 450 tonnes this year, driving its holdings to the lowest level since early 2009 at 865.71 tonnes.
CFTC data again has shown significant increase of short positions. But at this time open interest has drifted slightly higher. In general, if we take into consideration more extended period on the chart, then we will see that since May net long position has increased almost 2 times while open interest has fell. Right now we see three week in a row of increasing short position and since October open interest shows shy growth. Still honestly speaking, we would like to see more supportive dynamic from open interest to become more confident with started bearish action.
Monthly
Whether we will get upward retracement and possible BC leg of larger AB=CD down move or not – that was our question for previous months and not much has changed here by far. As lows of October holds – chances are exist that market still could show upward action. While october has shifted to doji right in the end of the month and November has started from solid decline – now this fall calms down a bit and who knows, may be some recovery will happen. Fundamental situation and CFTC data stand not in favor of possible appreciation, but recent Yellen’s comments could support market in very short-term perspective. Seasonal trend is still bullish, but it is not always lead to growth. Sometimes, it could just hold depreciation and now we see something of this kind, since market stands in some range since August.
Our previous analysis (recall volatility breakout - VOB) suggests upward retracement. As market has significantly hit oversold we’ve suggested that retracement up should be solid, may be not right to overbought, but still significant. Take a look at previous bounces out from oversold – everytime retracement was significant. Thus, we’ve made an assumption of possible deeper upward retracement that could take a shape of AB=CD, and invalidation for this setup is previous lows around 1170s. If market will pass through it, then, obviously we will not see any AB=CD up.
Now market is approaching to previous lows and the question is whether they will hold or not.
Weekly
This time frame puts the foundation for short-term trading. As market has reached the minimum target of bearish engulfing, that was suddenly formed, now price has opportunity to change direction for short-term and simultaneously do not break overall bearish development. So, guys, here we have bullish stop grabber pattern right at MPS1 and Fib support. Its minimum target stands around 1350 and it could be reached as AB-CD. Looking a bit further, theoretically it could even lead to butterfly sell appearing, but this is a bit early object for discussion. Conversely, invalidation point of grabber stands at its low – 1265 and if market will destroy it, we will return right back to bearish setup and butterfly “buy” on weekly that we’ve discussed earlier. Anyway, short-term development that could follow on coming week and completion of small AB-CD will not cancel bearish setup yet. From that standpoint we could say that we will be focused mostly on tactical trading rather on strategic on this week.
Daily
Trend is bearish here, market is not at oversold. In fact now situation mostly depends on what will happen with this engulfing pattern, because this pattern simultaneously is a swing of stop grabber on weekly chart. Other words, whether it will lead market to real bounce up or it will fail. The major worry with it is existing of AB=CD minor 0.618 target slightly under this pattern. Still, as we have pattern, let’s try to use it and focus particularly on it, and then we’ll see what will happen.
1-hour
On 4-hour chart I see nothing special, except may be existance of reversal swing up, that is greater than previous swing down. Hourly chart shows the swing of stop grabber itself. So, since we intend to try to trade it, there are two significant support areas. First one is K-support around WPP and second one is combination of WPS1 and 5/8 Fib support around 1272-1274. Currently is it unclear what particular level price could reach but both of them are suitable and will not cancel possible upward action. Although invalidation point of grabber is its low, we probably also should keep an eye on 1268 low. If it will be taken out, then chances that grabber will be cancelled increase significantly.
Gold has a habit to show deep retracements and current top shape blurly reminds H&S but it looks too skew and hardly worthy of relation on it.
Conclusion:
In short-term perspective we have clear pattern and will try to trade it on coming week. When situation with it will be resolved, we will understand overall situation clearer. Until this will happen our trading will be mostly tactical rather than strategic.
The technical portion of Sive's analysis owes a great deal to Joe DiNapoli's methods, and uses a number of Joe's proprietary indicators. Please note that Sive's analysis is his own view of the market and is not endorsed by Joe DiNapoli or any related companies.