Sive Morten
Special Consultant to the FPA
- Messages
- 18,651
Fundamentals
Yesterday we've talked about fundamental background of recent weeks in detail which mostly was negative to financial markets, but... not for gold. Gold was shining brighter as soon as poor statistics data, D. Trump impeachment, stock market collapse and new spiral of US/China long lasting so-called negotiations appeared on the surface. It was deadly combination for Forex but it was quite supportive to the gold.
As Reuters reports - Gold rose on Friday on growing fears of a global economic slowdown and rising expectations of more U.S. interest rate cuts, with investors was looking for cues from U.S. jobs data.
The U.S. on Wednesday said it would slap tariffs on certain products from the European Union after the World Trade Organization gave Washington a green light to impose tariffs on $7.5 billion worth of EU goods annually in a long-running trade case.
“We’ve received more evidence that global growth is struggling. We most likely have a global manufacturing recession and there is a risk that this spills over into the services, which is why gold has recovered quite rapidly after that sell-off last week,” said Julius Baer analyst Carsten Menke.
“Fundamentals for gold are still positive, we have slowing global growth, lingering trade tensions and we see more rate cuts by the Fed. So this is an environment where gold should prosper and prices should be at $1,575 towards the end of the year.”
Data from the United States showed services sector activity slowed to a three-year low in September, following the manufacturing sector, which contracted to the weakest level in a decade. Hiring by U.S. private employers also slowed further last month.
“Trump’s tariffs against the European Union create a certain amount of uncertainty and potential for economic failure,” said SP Angel analyst John Meyer.
Two U.S. Fed policymakers on Thursday signalled they are open to delivering another rate cut, while Vice Chairman Richard Clarida said the central bank “will act as appropriate to sustain a low unemployment rate and solid growth and stable inflation”.
“Fed Chair Jerome Powell stated in July that this (rate cut) step was just an insurance against international risks and not the beginning of a new cycle, but in September it became clear it is a cycle and now more FOMC members are being supportive to rate cuts,” said Quantitative Commodity Research analyst Peter Fertig.
“Yields are declining again, stocks are not performing well, the U.S. dollar is flat, which is all supportive to gold.”
Adding to the economic gloom in Europe, a survey showed euro zone business growth stalled in September as an ongoing contraction in manufacturing activity is increasingly affecting the services industry.
“It all indicates ongoing stress in the markets and an inevitable flight into recession,” Meyer said.
The U.S. tariff announcement sent world stocks to near four-week lows while yields on major benchmark bonds slipped, reflecting fears about global growth.
“Gold rebounded to $1,500 on the back of new trade tension... The short-term trend remains mixed, while the medium-long term is still positive for bullion,” ActivTrades chief analyst Carlo Alberto De Casa said in a note.
“The strength of the rebound seen in the last 48 hours is significant, confirming that investors are still seeing any correction in gold prices as a good chance to add more bullion to their portfolio.”
Gold had jumped 1.4% on Wednesday after disappointing data on hiring by U.S. private employers unnerved investors already concerned about slowing growth in the world’s largest economy.
Further supporting gold, the dollar slid to one-week lows against the euro and yen.
Holdings of the world’s largest gold-backed exchange-traded fund, SPDR Gold Shares, rose to 923.76 tonnes on Wednesday, very close to last week’s 924.94 tonnes, a peak since mid-November 2016.
CFTC data shows that net long position has dropped slightly from the absolute top, as we've suggested, because gold was overbought and position is overextended, reaching all time high. In such circumstances any market needs technical relief, which we've got in last 1-2 sessions. Since situation has changed this week, it will be interesting to see how position will change on next data release.

Source: cftc.gov
Charting by Investing.com
So, guys, it seems that our prediction is filled. As we've said, once US will finish with China - it will turn to EU, trying to use the whole global financial power while they still have it . Although nothing was announced in news or this is intentionally keeping in secret but indirect signs tell that US and China trade сcompetition is coming to an end. In our gold researches week by week we track situation in Chinese economy which has become few times worse since tariffs war has started. As soon as tariffs were initiated by US, all time we talked about US victory in this conflict because of fundamental factors that point on too different possession of US and China in this tariffs war.
Now we see that US turns to EU. It means that peak of US/China conflict is passed, maybe some agreements already achieved, that satisfy US and now they could move forward. We will know this sooner rather than later I suppose. The first steps in attempt to put the tariffs burden on EU as well - is confirmation of our second prediction. We talked about it - when US break the China, they will turn to EU. And, the fact that US turns to EU with tariffs - is a bad sign, which indirectly points that major questions in US/China tariffs was are resolved, as US now could fight on two fronts.
Speaking about the China again - here is update of Fathom consulting on Chinese economy conditions, dedicated to 70 anniversary of the People’s Republic of China. But it is no reasons for happiness.
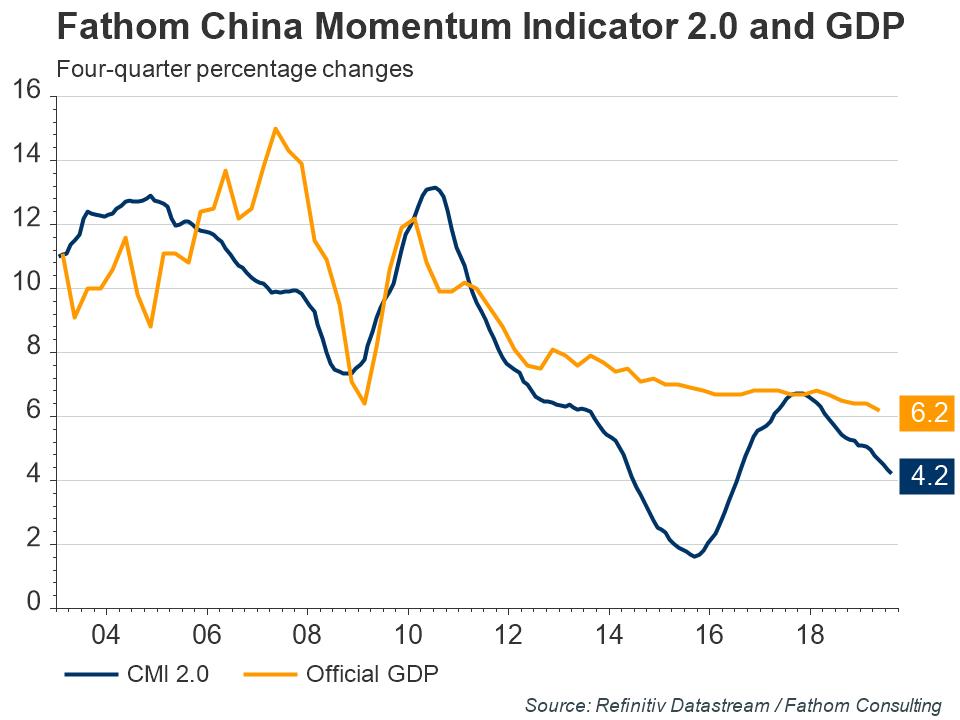
China’s economy is slowing hard.This is according to our China Momentum Indicator (CMI), created as an alternative to the official and often questionably-on-target GDP data. As highlighted in the chart below, the index reported that China’s economy slowed to a three-year low of 4.2% in August.
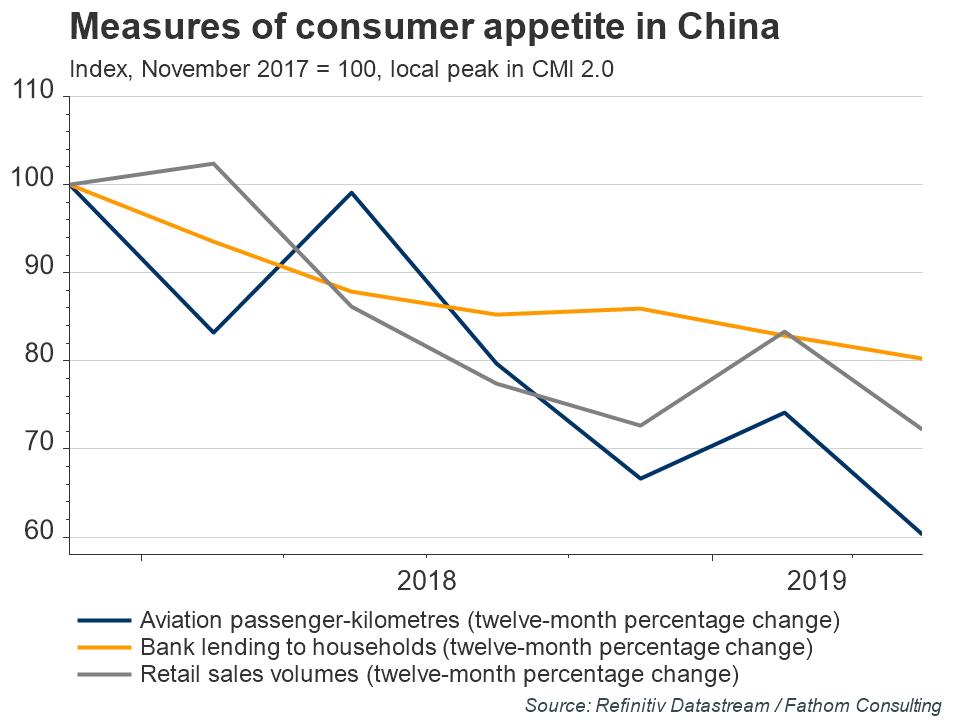
Retail sales, bank lending to households and aviation passenger numbers have all slowed since the end of 2017 (when our CMI last peaked), despite being key indicators of a more consumer-led economy.
This pursuit of growth at the expense of reform is the wrong medicine; it will work for a time, but allocative inefficiencies and diminishing returns mean that unless something changes China is destined for perennially lower economic growth. This idea is reflected in our forecast, with the path into the future expected to be one that winds to and fro, with key events likely to intensify China’s prioritisation of growth, regardless of the long-term cost.
For example, we expect that in 2021, the centenary of the founding of the Chinese Communist Party (both a national celebration and a key milestone in the party’s plan to build a moderately prosperous or ‘Xiaokang’ society), growth will temporarily gain momentum. This could be through tried-and-tested growth tactics of credit-fuelled investments, which in the past have worked effectively in the short term to limit a slowdown. However, these efforts will only exacerbate existing imbalances and increase financial risk, dampening chances of long-term sustainable growth. As a consequence of this, we expect growth to return to trend and dip back down after the completion of 20th National Congress festivities in 2022.
Technical
Monthly
Short-term sentiment has changed on gold market. If two weeks ago everything pointed on retracement, which actually has started, now situation is mixed. Even from technical point of view, as you will see on weekly chart, some abandoned pattern now take the second life.
On monthly chart we do not have a lot of changes. Gold stands in reaction to strong resistance area and October is inside month by far. The resistance here is strong and valuable and it deserves meaningful retracement. But currently it is too few signs of real retracement. September drop was too small and mostly reminds consolidation around the level rather than retracement, and October performance just confirms this.
Price doesn't go down and stands near the target. This is not the way how usually bearish reaction develops.
We keep this area - 1530-1585 as tactical ceil by far, but, as we have additional driving factors, we should pay attention to daily and intraday performance, just to not miss the signs of upside continuation.
In general, combination of butterfly target, major 5/8 Fib resistance and monthly overbought is rather strong barrier. Something really outstanding has to happen to force gold break it without respect. At the same time, the way how this respect will start is still unclear. Gold has a lot of freedom in this subject as it could flirt with resistance some time before major reaction will start.

Weekly
Last time weekly chart has given us very valuable lesson. Despite how perfect technical picture is, it still could bring negative surprises. The price action that we have here is one of the most cunning that I saw on gold.
Everybody remember our setup with weekly bullish grabber and potential DRPO "Sell". That was really fascinating setup. But gold wasn't able to proceed higher and form 2nd top of DRPO pattern. As a result it has dropped, erased grabber and completed daily H&S pattern target. We know that.
Now take a look again at weekly chart. We still do not have 2nd close above 3x3 DMA and gold still has not reached 1447 major Fib level. It means that DRPO "Sell" is still possible, if now gold will proceed higher finally, show close above 3x3 DMA and form 2nd top of DRPO pattern. Really cunning price action.
Situation even more tricky as now we have fundamental background for this action - very weak performance of US economy and new rate cut on horizon by the end of the month. Besides, Brexit edge is coming as well..
That' being said, despite that smell of the retracement in the air - gold stands stubbornly too tight to the top, which means that major downside action is somewhere in the future and we can't ignore possible return back to the tops.

Daily
Last week market has completed our near-standing upside targets. Friday's sell setup also has done well, and now daily chart shows all trickiness of situation. Minimum target of "222" Buy pattern is done as gold stands at 5/8 resistance. And we've got bearish grabber which tells, at least theoretically, about downside continuation. But this contradicts to weekly picture.
Now we have to keep a close eye on 1520 area. Once market will break it up and erase the grabber - we are on the road to new top and potential DRPO "Sell" on weekly chart. This setup could take the shape of the pattern that you will find on 4H chart.

Intraday
4H and 1H charts provide setups for any taste. First is, on 4H chart, we suggest that gold could form reverse H&S pattern at top, complete weekly XOP and form 2nd top of DRPO pattern - if our bullish setup indeed will start to work. The Head shape could be different - it could be, say, direct action to COP target, or AB=CD shape if deeper retracement will happen, but anyway, market will have to keep upside tendency and keep recent lows intact.

On 1H chart we see that our bearish scalp setup is done perfect - "222" Sell has triggered downside NFP drop which stopped right at target - K-support area. Still, on Friday's evening multiple bearish grabbers have been formed, and theoretically retracement is possible on Monday, at least until market stands below recent tops:

As situation looks a bit complex, here is some hints for trading setups. Bearish setup is more simple as it is based on daily resistance and the grabber. Invalidation point for the setup is recent top and 1520 level. Theoretically bearish position could be taken until market stands below it. Trying to fit bullish fundamental background into bearish trading setup - is different question. As they stand contradictive, overall bearish context is not as strong right now. So it makes sense to think twice before taking short position. The advantage of bearish setup is small risk, because market stands very close to invalidation point.
On bullish setup task is more difficult - whether we should take position right now, or wait for retracement, or - maybe wait for 1520 breakout? We suggest that two latter setups are preferable. I mean either to wait deeper retracement and maybe "222" Buy pattern, or total erasing of bearish setup and jump above 1520 level, when bearish patterns will be destroyed. Maybe Stop "Buy" order could be used for this purpose... So, it is a lot of room for your own homework on this subject.
Conclusion
Recent events mostly make impact on short-term sentiment on the market. While major retracement still stands on the table - its shape and starting moment are not clear yet.
Disclaimer
This FPA Investment Research is for information and education purposes only. Any decision to make any trade on the market has to be made solely by the reader. Information that is presented in research or its update is not an offer or call to make the trade on the financial markets and expresses just a personal opinion of the author who is might be wrong. Reader has to make decision on any trade solely and care all responsibility for results of this trade.
The technical portion of Sive's analysis owes a great deal to Joe DiNapoli's methods, and uses a number of Joe's proprietary indicators. Please note that Sive's analysis is his own view of the market and is not endorsed by Joe DiNapoli or any related companies.
Yesterday we've talked about fundamental background of recent weeks in detail which mostly was negative to financial markets, but... not for gold. Gold was shining brighter as soon as poor statistics data, D. Trump impeachment, stock market collapse and new spiral of US/China long lasting so-called negotiations appeared on the surface. It was deadly combination for Forex but it was quite supportive to the gold.
As Reuters reports - Gold rose on Friday on growing fears of a global economic slowdown and rising expectations of more U.S. interest rate cuts, with investors was looking for cues from U.S. jobs data.
The U.S. on Wednesday said it would slap tariffs on certain products from the European Union after the World Trade Organization gave Washington a green light to impose tariffs on $7.5 billion worth of EU goods annually in a long-running trade case.
“We’ve received more evidence that global growth is struggling. We most likely have a global manufacturing recession and there is a risk that this spills over into the services, which is why gold has recovered quite rapidly after that sell-off last week,” said Julius Baer analyst Carsten Menke.
“Fundamentals for gold are still positive, we have slowing global growth, lingering trade tensions and we see more rate cuts by the Fed. So this is an environment where gold should prosper and prices should be at $1,575 towards the end of the year.”
Data from the United States showed services sector activity slowed to a three-year low in September, following the manufacturing sector, which contracted to the weakest level in a decade. Hiring by U.S. private employers also slowed further last month.
“Trump’s tariffs against the European Union create a certain amount of uncertainty and potential for economic failure,” said SP Angel analyst John Meyer.
Two U.S. Fed policymakers on Thursday signalled they are open to delivering another rate cut, while Vice Chairman Richard Clarida said the central bank “will act as appropriate to sustain a low unemployment rate and solid growth and stable inflation”.
“Fed Chair Jerome Powell stated in July that this (rate cut) step was just an insurance against international risks and not the beginning of a new cycle, but in September it became clear it is a cycle and now more FOMC members are being supportive to rate cuts,” said Quantitative Commodity Research analyst Peter Fertig.
“Yields are declining again, stocks are not performing well, the U.S. dollar is flat, which is all supportive to gold.”
Adding to the economic gloom in Europe, a survey showed euro zone business growth stalled in September as an ongoing contraction in manufacturing activity is increasingly affecting the services industry.
“It all indicates ongoing stress in the markets and an inevitable flight into recession,” Meyer said.
The U.S. tariff announcement sent world stocks to near four-week lows while yields on major benchmark bonds slipped, reflecting fears about global growth.
“Gold rebounded to $1,500 on the back of new trade tension... The short-term trend remains mixed, while the medium-long term is still positive for bullion,” ActivTrades chief analyst Carlo Alberto De Casa said in a note.
“The strength of the rebound seen in the last 48 hours is significant, confirming that investors are still seeing any correction in gold prices as a good chance to add more bullion to their portfolio.”
Gold had jumped 1.4% on Wednesday after disappointing data on hiring by U.S. private employers unnerved investors already concerned about slowing growth in the world’s largest economy.
Further supporting gold, the dollar slid to one-week lows against the euro and yen.
Holdings of the world’s largest gold-backed exchange-traded fund, SPDR Gold Shares, rose to 923.76 tonnes on Wednesday, very close to last week’s 924.94 tonnes, a peak since mid-November 2016.
CFTC data shows that net long position has dropped slightly from the absolute top, as we've suggested, because gold was overbought and position is overextended, reaching all time high. In such circumstances any market needs technical relief, which we've got in last 1-2 sessions. Since situation has changed this week, it will be interesting to see how position will change on next data release.
Source: cftc.gov
Charting by Investing.com
So, guys, it seems that our prediction is filled. As we've said, once US will finish with China - it will turn to EU, trying to use the whole global financial power while they still have it . Although nothing was announced in news or this is intentionally keeping in secret but indirect signs tell that US and China trade сcompetition is coming to an end. In our gold researches week by week we track situation in Chinese economy which has become few times worse since tariffs war has started. As soon as tariffs were initiated by US, all time we talked about US victory in this conflict because of fundamental factors that point on too different possession of US and China in this tariffs war.
Now we see that US turns to EU. It means that peak of US/China conflict is passed, maybe some agreements already achieved, that satisfy US and now they could move forward. We will know this sooner rather than later I suppose. The first steps in attempt to put the tariffs burden on EU as well - is confirmation of our second prediction. We talked about it - when US break the China, they will turn to EU. And, the fact that US turns to EU with tariffs - is a bad sign, which indirectly points that major questions in US/China tariffs was are resolved, as US now could fight on two fronts.
Speaking about the China again - here is update of Fathom consulting on Chinese economy conditions, dedicated to 70 anniversary of the People’s Republic of China. But it is no reasons for happiness.
China’s economy is slowing hard.This is according to our China Momentum Indicator (CMI), created as an alternative to the official and often questionably-on-target GDP data. As highlighted in the chart below, the index reported that China’s economy slowed to a three-year low of 4.2% in August.
Retail sales, bank lending to households and aviation passenger numbers have all slowed since the end of 2017 (when our CMI last peaked), despite being key indicators of a more consumer-led economy.
This pursuit of growth at the expense of reform is the wrong medicine; it will work for a time, but allocative inefficiencies and diminishing returns mean that unless something changes China is destined for perennially lower economic growth. This idea is reflected in our forecast, with the path into the future expected to be one that winds to and fro, with key events likely to intensify China’s prioritisation of growth, regardless of the long-term cost.
For example, we expect that in 2021, the centenary of the founding of the Chinese Communist Party (both a national celebration and a key milestone in the party’s plan to build a moderately prosperous or ‘Xiaokang’ society), growth will temporarily gain momentum. This could be through tried-and-tested growth tactics of credit-fuelled investments, which in the past have worked effectively in the short term to limit a slowdown. However, these efforts will only exacerbate existing imbalances and increase financial risk, dampening chances of long-term sustainable growth. As a consequence of this, we expect growth to return to trend and dip back down after the completion of 20th National Congress festivities in 2022.
Technical
Monthly
Short-term sentiment has changed on gold market. If two weeks ago everything pointed on retracement, which actually has started, now situation is mixed. Even from technical point of view, as you will see on weekly chart, some abandoned pattern now take the second life.
On monthly chart we do not have a lot of changes. Gold stands in reaction to strong resistance area and October is inside month by far. The resistance here is strong and valuable and it deserves meaningful retracement. But currently it is too few signs of real retracement. September drop was too small and mostly reminds consolidation around the level rather than retracement, and October performance just confirms this.
Price doesn't go down and stands near the target. This is not the way how usually bearish reaction develops.
We keep this area - 1530-1585 as tactical ceil by far, but, as we have additional driving factors, we should pay attention to daily and intraday performance, just to not miss the signs of upside continuation.
In general, combination of butterfly target, major 5/8 Fib resistance and monthly overbought is rather strong barrier. Something really outstanding has to happen to force gold break it without respect. At the same time, the way how this respect will start is still unclear. Gold has a lot of freedom in this subject as it could flirt with resistance some time before major reaction will start.
Weekly
Last time weekly chart has given us very valuable lesson. Despite how perfect technical picture is, it still could bring negative surprises. The price action that we have here is one of the most cunning that I saw on gold.
Everybody remember our setup with weekly bullish grabber and potential DRPO "Sell". That was really fascinating setup. But gold wasn't able to proceed higher and form 2nd top of DRPO pattern. As a result it has dropped, erased grabber and completed daily H&S pattern target. We know that.
Now take a look again at weekly chart. We still do not have 2nd close above 3x3 DMA and gold still has not reached 1447 major Fib level. It means that DRPO "Sell" is still possible, if now gold will proceed higher finally, show close above 3x3 DMA and form 2nd top of DRPO pattern. Really cunning price action.
Situation even more tricky as now we have fundamental background for this action - very weak performance of US economy and new rate cut on horizon by the end of the month. Besides, Brexit edge is coming as well..
That' being said, despite that smell of the retracement in the air - gold stands stubbornly too tight to the top, which means that major downside action is somewhere in the future and we can't ignore possible return back to the tops.
Daily
Last week market has completed our near-standing upside targets. Friday's sell setup also has done well, and now daily chart shows all trickiness of situation. Minimum target of "222" Buy pattern is done as gold stands at 5/8 resistance. And we've got bearish grabber which tells, at least theoretically, about downside continuation. But this contradicts to weekly picture.
Now we have to keep a close eye on 1520 area. Once market will break it up and erase the grabber - we are on the road to new top and potential DRPO "Sell" on weekly chart. This setup could take the shape of the pattern that you will find on 4H chart.
Intraday
4H and 1H charts provide setups for any taste. First is, on 4H chart, we suggest that gold could form reverse H&S pattern at top, complete weekly XOP and form 2nd top of DRPO pattern - if our bullish setup indeed will start to work. The Head shape could be different - it could be, say, direct action to COP target, or AB=CD shape if deeper retracement will happen, but anyway, market will have to keep upside tendency and keep recent lows intact.
On 1H chart we see that our bearish scalp setup is done perfect - "222" Sell has triggered downside NFP drop which stopped right at target - K-support area. Still, on Friday's evening multiple bearish grabbers have been formed, and theoretically retracement is possible on Monday, at least until market stands below recent tops:
As situation looks a bit complex, here is some hints for trading setups. Bearish setup is more simple as it is based on daily resistance and the grabber. Invalidation point for the setup is recent top and 1520 level. Theoretically bearish position could be taken until market stands below it. Trying to fit bullish fundamental background into bearish trading setup - is different question. As they stand contradictive, overall bearish context is not as strong right now. So it makes sense to think twice before taking short position. The advantage of bearish setup is small risk, because market stands very close to invalidation point.
On bullish setup task is more difficult - whether we should take position right now, or wait for retracement, or - maybe wait for 1520 breakout? We suggest that two latter setups are preferable. I mean either to wait deeper retracement and maybe "222" Buy pattern, or total erasing of bearish setup and jump above 1520 level, when bearish patterns will be destroyed. Maybe Stop "Buy" order could be used for this purpose... So, it is a lot of room for your own homework on this subject.
Conclusion
Recent events mostly make impact on short-term sentiment on the market. While major retracement still stands on the table - its shape and starting moment are not clear yet.
Disclaimer
This FPA Investment Research is for information and education purposes only. Any decision to make any trade on the market has to be made solely by the reader. Information that is presented in research or its update is not an offer or call to make the trade on the financial markets and expresses just a personal opinion of the author who is might be wrong. Reader has to make decision on any trade solely and care all responsibility for results of this trade.
The technical portion of Sive's analysis owes a great deal to Joe DiNapoli's methods, and uses a number of Joe's proprietary indicators. Please note that Sive's analysis is his own view of the market and is not endorsed by Joe DiNapoli or any related companies.