Sive Morten
Special Consultant to the FPA
- Messages
- 18,699
Fundamentals
(Reuters) Gold rose 1 percent to the highest level in nearly four weeks on Friday, extending gains late in the session after the FBI said it will further investigate Democratic presidential candidate Hillary Clinton's
use of a private email system.
Just 11 days ahead of the U.S. presidential election, the news shook up the campaign, in which Clinton is the front-runner in opinion polls.
Spot gold was up 0.8 percent at $1,278.38 an ounce by 2:54 p.m. EDT (1854 GMT), after rising 1.3 percent to $1,284.14, the highest since Oct. 4. It is on track to close the week up 0.9 percent. U.S. gold futures settled up 0.6 percent at $1,276.80.
"The FBI headlines startled a somnolent gold market, driving bullion a percent higher in a hour on concerns that a late October surprise could suddenly bolster (Donald) Trump's sagging fortunes," said Tai Wong, director of base and precious metals trading for BMO Capital Markets in New York.
"The rally may not last, though, as we are at the two-minute warning and Clinton is ahead by two scores, so it would require a truly shocking revelation to derail her chances." Wall Street and the dollar fell against a basket of six major currencies after the Federal Bureau of Investigation said it would probe additional emails related to Clinton while she was secretary of state.
The greenback was already weak, having shrugged off slightly better-than-expected U.S. third-quarter GDP data amid firm demand from Asia.
The U.S. economy grew by 2.9 percent in the third quarter, outpacing analysts' consensus forecast of 2.5 percent. The data strengthened the case for an interest rate increase, making non-yielding assets such as gold less attractive while boosting the dollar and U.S. treasuries. Demand for bullion in India is expected to pick up during the Dhanteras and Diwali festivals, when gold is traditionally given as a gift.
COT Data
Currently CFTC data is not as important for us as previously. Mostly it has completed its mission when pointed on overloaded long positions and predicted drop on gold. As drop has happened, speculative position right now stands at average level and mostly doesn't provide any specific information for us. Last week we see shy increase in long position and open interest.
Net speculative position is bullish, seasonal trend is also bullish on gold market right now. But actually it is not opposed to any direction.

Technicals
Monthly
As COT report mostly has completed its role and predicted first drop, now we again should pay more attention to technical picture, to estimate destination point of current bearish action on long-term analysis.
Monthly picture currently supports our suggestion on deep retracement, this is just how markets work. Sooner or later but this retracement should have happened and now it stands underway.
Technically recent upward action started in Dec 2015 is first one after long term of decreasing and it should be interrupted by deep retracement sometime. Probably it should happen but this potential downward action has a great chance to become just a retracement. Overall political and financial situation in the world probably will not give a chance to relax. Thus, we have a positive long-term view on gold market.
As market slightly has moved above YPR1 and our K-resistance area, something is starting to form here, I mean pattern by which long-term global trend could change on gold. Price has formed nice bearish engulfing right around this area and now gold is following to its signal
Take a careful look at the picture - could you recognize here possible reverse H&S pattern? Besides the shape itself, some features here that in general typical for H&S. For example, relation between head and shoulders - 1.618. Butterfly... very often first part of H&S takes the shape of butterfly pattern...
Finally take a look at action on downward slope and upward one of the head - last move down was slower than current move up. All these moments point on possible H&S pattern here.
If we really will get it - then we could make an assumption on possible depth of retracement. Now the bottom of shoulder stands approximately around 1160 area... Currently we could only gamble what event could push gold as low as 1160 again, but probably something will happen.
Our suggestion on initial drop was correct - growing psychological pressure among managers of Hedge and Mutual funds, good performance of gold in 2016, coming rate hike in Dec and overloading long positions forced traders to fix profit as soon as gold has dropped below 1300 area.
That's being said, taking together technical, fundamental and sentiment picture we suggest further drop on gold, at least to 1160-1180 area. Second step is watch for validity of H&S pattern. If it really will work (and we think that it should), then we expect new long-term bullish trend on gold market that should lead to new highs on 2000$+ levels. It means that 1160-1200 area should be treated as strategical point for long entry.

Weekly
On weekly chart market starts to show upside reaction on reached support area. As we've mentioned previously, on weekly chart we have two different scenarios. In short-term scenario we expect that some upward bounce should happen, at least if market is not dispeared totally. That is what already has started. Major reason - weekly oversold at K-support area. This is rather nice stimulus for upward bounce. Actually we have DiNapoli bullish "Stretch" pattern.
Second scenario - is a reversal bearish pattern. Here, guys, we could get H&S. Head stands precisely at 1.618 extension of potential left shoulder. So, we think that this is one of the patterns that we have to keep in mind. To be formed, market needs continue dropping (after minor bounce) somewhere to 1200 area and then start to form right shoulder. Target of this direct H&S, as AB=CD pattern leads us directly to the bottom of right shoulder on monthly chart... Overall, this combination looks really interesting.
But first - upward bounce. This situtation leads us to conclusion - do not take short position yet. Trading long is possible but more risky as you will go against major tendency, dealing with the "Stretch" pattern. We do not recomment to go long. But if you will decide to do this - try to get more confirmation, some bullish patterns on your back, use nearest targets etc...
Slow action and absence of thrust hints that this is not bullish reversal, but mostly reaction on strong support area. This in turn, leads us to conclusion that downward action should be re-established sooner rather than later.
Weekly picture shows that probable upside destination should be an area around 1290 level. Breaking up this area will be negative for bearish scenario. In this case market will vanish nasty black candle and return back in consolidation. This will crack normal bearish behavior. Thus, while market stands below 1290 - bearish setup is valid.

Daily
Picture on daily chart brings more confirmation to our suggestion on retracement character of upside action. Price shows smooth and gradual behavior. Actually, now we see classical continuation pattern - bearish flag. On Friday action market mostly has reached our K-resistance area, at least its lower border.
Currently we're coming to very thrilling moment of US elections on 8th of November. As you undertsand this could bring drastic shifts on markets, as due news speculations, rumors as real results of voting. It seems that situation will become more tighten as closer to Day we will be. Volatility probably could increase significantly.
Still, we will stand on our trading plan. As market stands very close to our predefined 1290 area, we will watch for reversal patterns on intraday charts.
Speaking on election results, we think that Trump will win. How it will impact on gold market? Some analysts think that it should push price down, but as I do not know what reasons have led them to this conclusion, I will not comment this scenario. The only reason, that may be has some sense, is difference Trump policy compares to current Democrats one. May be they based their analysis on this subject...

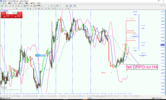
Intraday
Our setup for last week mostly has been completed. Our Friday's major condition was around 1265 area. As gold has held above it, no breakout has happened and upside action has continued.
Now price stands very close to our destination point around 1290 area. Upside 1.618 AB-CD target mostly has been reached. Thus, now major question is around possible bearish reversal pattern. Based on recent action, it seems that gold could form H&S pattern. If this idea will be confirmed by price action our major area it watch for is a top of right shoulder as most suitable area for short entry:

Read carefully!
Conclusion:
Perspective of 1-3 months looks bearish. We mostly are watching for reverse H&S pattern on monthly chart that should provide us strategical entry point around 1160-1200 level.
Perspective of 1-2 years looks bullish. As H&S pattern will be completed, new bullish trend should start. We expect to see gold on areas above 2000$
In very short-term perspective price action has a nature of retracement action. Coming elections will add a lot of uncertainty and situaiton could change drastically. But right now technical picture mostly stands the same. Next week we will watch for bearish reversal patterns and first one will be potential H&S.
The technical portion of Sive's analysis owes a great deal to Joe DiNapoli's methods, and uses a number of Joe's proprietary indicators. Please note that Sive's analysis is his own view of the market and is not endorsed by Joe DiNapoli or any related companies.
(Reuters) Gold rose 1 percent to the highest level in nearly four weeks on Friday, extending gains late in the session after the FBI said it will further investigate Democratic presidential candidate Hillary Clinton's
use of a private email system.
Just 11 days ahead of the U.S. presidential election, the news shook up the campaign, in which Clinton is the front-runner in opinion polls.
Spot gold was up 0.8 percent at $1,278.38 an ounce by 2:54 p.m. EDT (1854 GMT), after rising 1.3 percent to $1,284.14, the highest since Oct. 4. It is on track to close the week up 0.9 percent. U.S. gold futures settled up 0.6 percent at $1,276.80.
"The FBI headlines startled a somnolent gold market, driving bullion a percent higher in a hour on concerns that a late October surprise could suddenly bolster (Donald) Trump's sagging fortunes," said Tai Wong, director of base and precious metals trading for BMO Capital Markets in New York.
"The rally may not last, though, as we are at the two-minute warning and Clinton is ahead by two scores, so it would require a truly shocking revelation to derail her chances." Wall Street and the dollar fell against a basket of six major currencies after the Federal Bureau of Investigation said it would probe additional emails related to Clinton while she was secretary of state.
The greenback was already weak, having shrugged off slightly better-than-expected U.S. third-quarter GDP data amid firm demand from Asia.
The U.S. economy grew by 2.9 percent in the third quarter, outpacing analysts' consensus forecast of 2.5 percent. The data strengthened the case for an interest rate increase, making non-yielding assets such as gold less attractive while boosting the dollar and U.S. treasuries. Demand for bullion in India is expected to pick up during the Dhanteras and Diwali festivals, when gold is traditionally given as a gift.
COT Data
Currently CFTC data is not as important for us as previously. Mostly it has completed its mission when pointed on overloaded long positions and predicted drop on gold. As drop has happened, speculative position right now stands at average level and mostly doesn't provide any specific information for us. Last week we see shy increase in long position and open interest.
Net speculative position is bullish, seasonal trend is also bullish on gold market right now. But actually it is not opposed to any direction.
Technicals
Monthly
As COT report mostly has completed its role and predicted first drop, now we again should pay more attention to technical picture, to estimate destination point of current bearish action on long-term analysis.
Monthly picture currently supports our suggestion on deep retracement, this is just how markets work. Sooner or later but this retracement should have happened and now it stands underway.
Technically recent upward action started in Dec 2015 is first one after long term of decreasing and it should be interrupted by deep retracement sometime. Probably it should happen but this potential downward action has a great chance to become just a retracement. Overall political and financial situation in the world probably will not give a chance to relax. Thus, we have a positive long-term view on gold market.
As market slightly has moved above YPR1 and our K-resistance area, something is starting to form here, I mean pattern by which long-term global trend could change on gold. Price has formed nice bearish engulfing right around this area and now gold is following to its signal
Take a careful look at the picture - could you recognize here possible reverse H&S pattern? Besides the shape itself, some features here that in general typical for H&S. For example, relation between head and shoulders - 1.618. Butterfly... very often first part of H&S takes the shape of butterfly pattern...
Finally take a look at action on downward slope and upward one of the head - last move down was slower than current move up. All these moments point on possible H&S pattern here.
If we really will get it - then we could make an assumption on possible depth of retracement. Now the bottom of shoulder stands approximately around 1160 area... Currently we could only gamble what event could push gold as low as 1160 again, but probably something will happen.
Our suggestion on initial drop was correct - growing psychological pressure among managers of Hedge and Mutual funds, good performance of gold in 2016, coming rate hike in Dec and overloading long positions forced traders to fix profit as soon as gold has dropped below 1300 area.
That's being said, taking together technical, fundamental and sentiment picture we suggest further drop on gold, at least to 1160-1180 area. Second step is watch for validity of H&S pattern. If it really will work (and we think that it should), then we expect new long-term bullish trend on gold market that should lead to new highs on 2000$+ levels. It means that 1160-1200 area should be treated as strategical point for long entry.
Weekly
On weekly chart market starts to show upside reaction on reached support area. As we've mentioned previously, on weekly chart we have two different scenarios. In short-term scenario we expect that some upward bounce should happen, at least if market is not dispeared totally. That is what already has started. Major reason - weekly oversold at K-support area. This is rather nice stimulus for upward bounce. Actually we have DiNapoli bullish "Stretch" pattern.
Second scenario - is a reversal bearish pattern. Here, guys, we could get H&S. Head stands precisely at 1.618 extension of potential left shoulder. So, we think that this is one of the patterns that we have to keep in mind. To be formed, market needs continue dropping (after minor bounce) somewhere to 1200 area and then start to form right shoulder. Target of this direct H&S, as AB=CD pattern leads us directly to the bottom of right shoulder on monthly chart... Overall, this combination looks really interesting.
But first - upward bounce. This situtation leads us to conclusion - do not take short position yet. Trading long is possible but more risky as you will go against major tendency, dealing with the "Stretch" pattern. We do not recomment to go long. But if you will decide to do this - try to get more confirmation, some bullish patterns on your back, use nearest targets etc...
Slow action and absence of thrust hints that this is not bullish reversal, but mostly reaction on strong support area. This in turn, leads us to conclusion that downward action should be re-established sooner rather than later.
Weekly picture shows that probable upside destination should be an area around 1290 level. Breaking up this area will be negative for bearish scenario. In this case market will vanish nasty black candle and return back in consolidation. This will crack normal bearish behavior. Thus, while market stands below 1290 - bearish setup is valid.
Daily
Picture on daily chart brings more confirmation to our suggestion on retracement character of upside action. Price shows smooth and gradual behavior. Actually, now we see classical continuation pattern - bearish flag. On Friday action market mostly has reached our K-resistance area, at least its lower border.
Currently we're coming to very thrilling moment of US elections on 8th of November. As you undertsand this could bring drastic shifts on markets, as due news speculations, rumors as real results of voting. It seems that situation will become more tighten as closer to Day we will be. Volatility probably could increase significantly.
Still, we will stand on our trading plan. As market stands very close to our predefined 1290 area, we will watch for reversal patterns on intraday charts.
Speaking on election results, we think that Trump will win. How it will impact on gold market? Some analysts think that it should push price down, but as I do not know what reasons have led them to this conclusion, I will not comment this scenario. The only reason, that may be has some sense, is difference Trump policy compares to current Democrats one. May be they based their analysis on this subject...
Intraday
Our setup for last week mostly has been completed. Our Friday's major condition was around 1265 area. As gold has held above it, no breakout has happened and upside action has continued.
Now price stands very close to our destination point around 1290 area. Upside 1.618 AB-CD target mostly has been reached. Thus, now major question is around possible bearish reversal pattern. Based on recent action, it seems that gold could form H&S pattern. If this idea will be confirmed by price action our major area it watch for is a top of right shoulder as most suitable area for short entry:
Read carefully!
Conclusion:
Perspective of 1-3 months looks bearish. We mostly are watching for reverse H&S pattern on monthly chart that should provide us strategical entry point around 1160-1200 level.
Perspective of 1-2 years looks bullish. As H&S pattern will be completed, new bullish trend should start. We expect to see gold on areas above 2000$
In very short-term perspective price action has a nature of retracement action. Coming elections will add a lot of uncertainty and situaiton could change drastically. But right now technical picture mostly stands the same. Next week we will watch for bearish reversal patterns and first one will be potential H&S.
The technical portion of Sive's analysis owes a great deal to Joe DiNapoli's methods, and uses a number of Joe's proprietary indicators. Please note that Sive's analysis is his own view of the market and is not endorsed by Joe DiNapoli or any related companies.