Sive Morten
Special Consultant to the FPA
- Messages
- 18,690
Fundamentals
Gold slid below $1,400 an ounce on Friday as the dollar rallied to a four-week high, with investors squaring positions at the end of the month and cashing in on a recent run-up ahead of a long U.S. holiday weekend. Analysts said gold's losses came mostly from month-end position squaring and profit-taking after prices on Wednesday reached their highest levels since mid-May. Investors remained poised for word on any U.S. military action in Syria. According to Reuter’s commentary, - "Gold is under pressure from a firm U.S. dollar and lower oil prices after the West debates whether to attack Syria," Commerzbank analyst Eugen Weinberg said. "The move higher in August was driven mostly by short-covering and opportunistic buying, which seems to have now run out of steam," VTB Capital analyst Andrey Kryuchenkov said.
Earlier, data showing the pace of U.S. Midwest business activity rose to 53.0 from 52.3 in July helped lift the dollar but pressured gold. The index for prices paid within the series rose to its highest since November, raising an inflation flag that fed expectations the Federal Reserve could soon taper its monetary stimulus. In Hong Kong gold kilo bar premiums declined to $2.50 an ounce from $5 two weeks ago. Tokyo premiums fell to 50 cents from $1.50. Those in Singapore dropped to $1.50.
CFTC data shows that downward retracement is possible. As you can see, within whole move up and increasing of speculative net long position, open interest does not support it. Sometimes it happens in the points of trend changing. As previous swing up was just initial move up (reversal swing) after long-term bearish action, some solid retracement down is possible on gold. Approximately the same picture could be found on silver. But still, situation gradually is changing. SPDR Fund again shows inflows but on past week they were rather shy and appear to be at 1.03 tonnes.
 So, we do not see any drastical changes in fundamental situation on gold market. Currently market starts to move and confirm our long-term analysis, since we’ve expected to see upward action at the end of August, and now we see it. Now the question is where this move will finish and what the level will be. Recall that we treat this current move up only as retracement, although big and valuable retracement. Our target is 1550-1600 area that should be achieved by February 2014 or may be a bit earlier. We will see. Let’s hope that current pause in upward action will be just retracement due long holiday ahead, end of month and completion of reversal swing up.
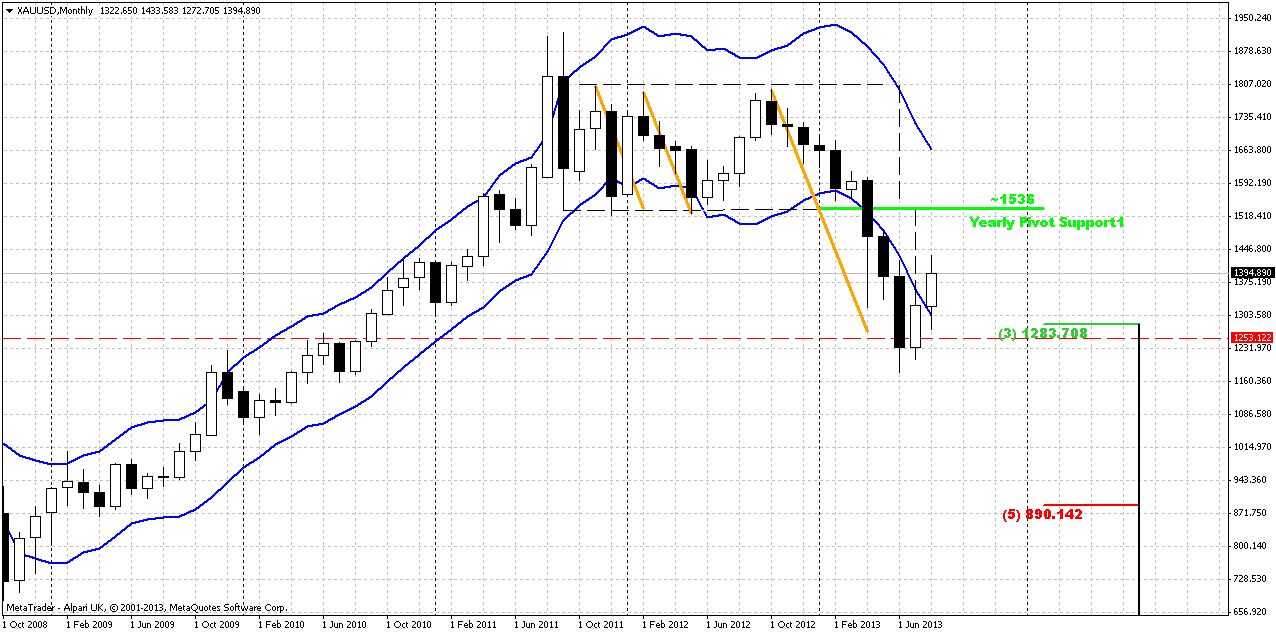
August candle has become the second month of upward action on gold market. Still we keep in mind Volatility breakout pattern and know that there will be 3-leg downward action. This means that current bounce will be just retracement probably. Second, currently we know that market at support – Fib support, target of rectangle breakout, completion of double harmonic swing down and monthly deep oversold. Unfortunately monthly chart does not give us much assistance in short-term trading. One bullish pattern that probably could be seen here is bullish DiNapoli “Stretch” pattern, since market stands at deep oversold right at Fib support. Thus, this is not the time to take long-term short position, but time to think about their close and searching for bullish patterns on lower time frames – weekly and daily. Target of this pattern is a middle between Oscillator Predictor Bands – right around 1550$ area. S&P analyst specifies approximately the same target. This area agrees with “Stretch” pattern as well.
Weekly
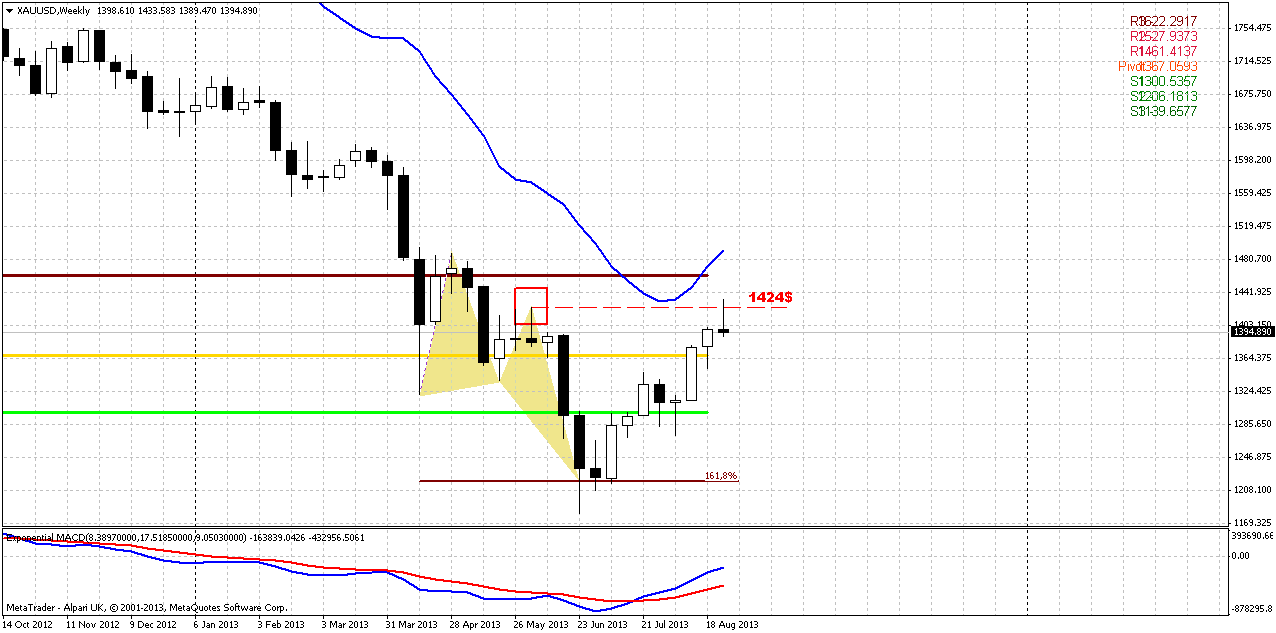
Trend is bullish here. Market has moved above all august pivot resistances within previous months. This usually tells that current move up is not occasional and is not just retracement. This could become a trend change. Second – price finally has given us desirable confirmation by swing length – upward move has appeared to be greater then previous swing down, although insignificantly. Also current move up is a biggest since the downward trend has started on gold.
The backside of all this stuff is possible deep retracement. This happens quite often when initial reverse swing is done, since downward momentum is still strong and it just does not let market freely continue move up. CFTC data also points on this probability. As situation around Syria shows some relief, at least until 9th of September, gold also will loose some support that previously was granted by geopolitical turmoil. All together these factors could lead to retracement down. We know that gold market likes 5/8 retracement and that really could be so.
Speaking about most unwelcome bullish scenario, if market will take out current lows around 1170 that probably will destroy bullish context and let us talk about re-establishing of long-term bear trend.
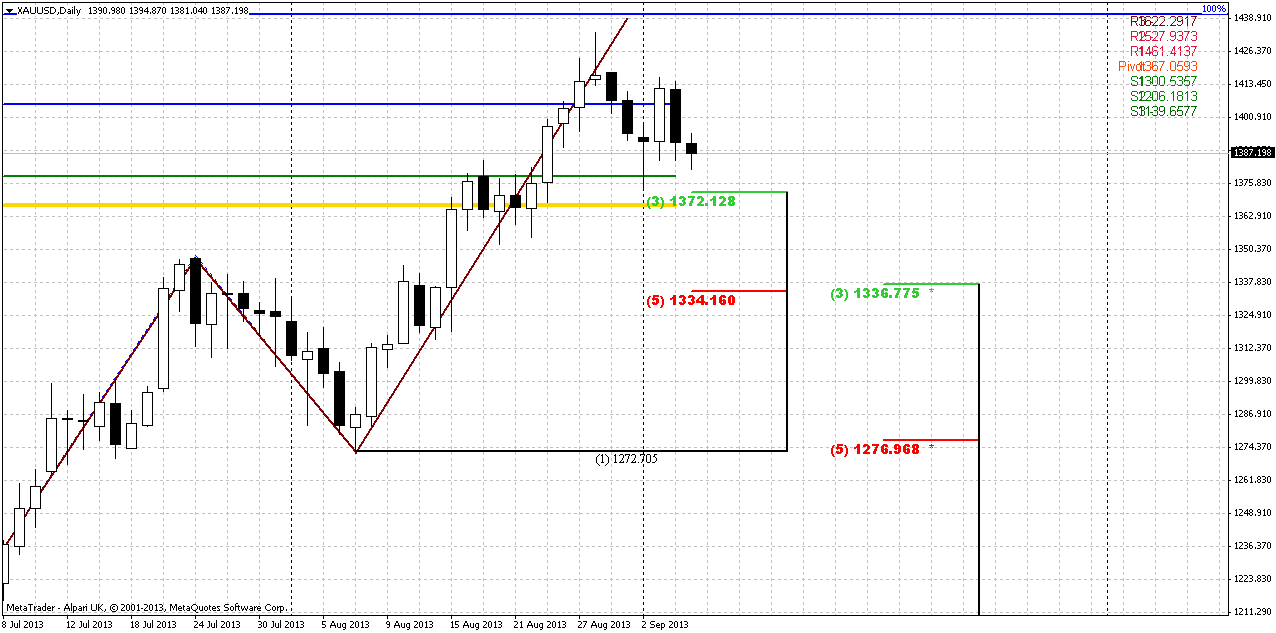
Daily
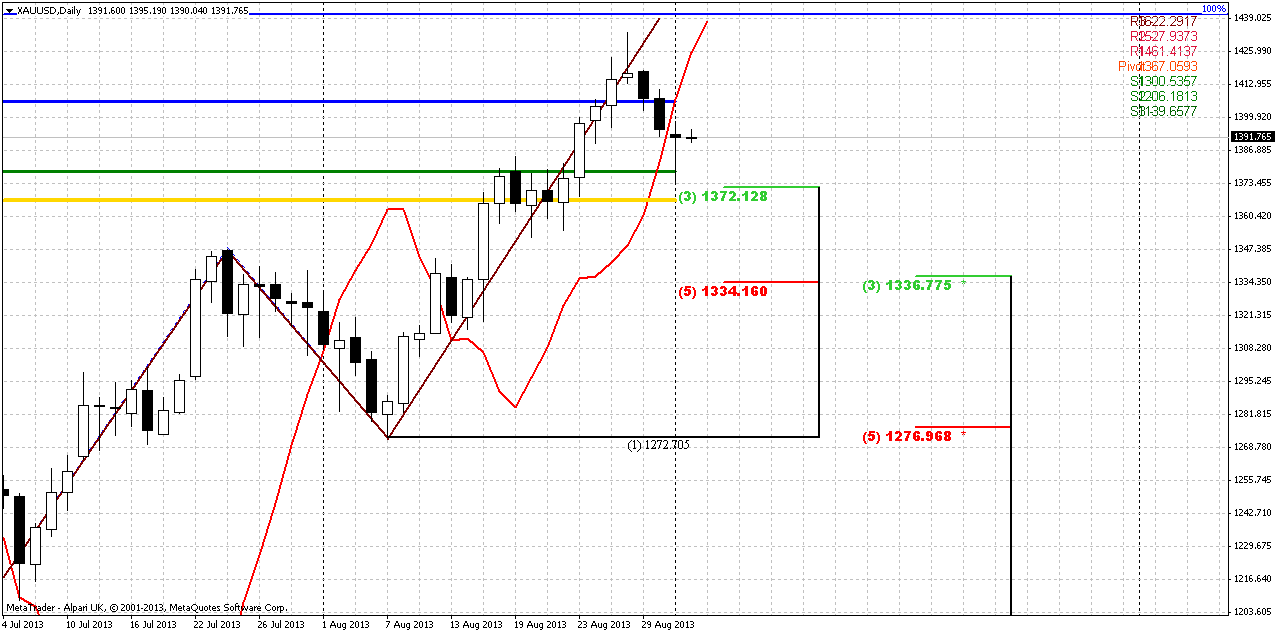
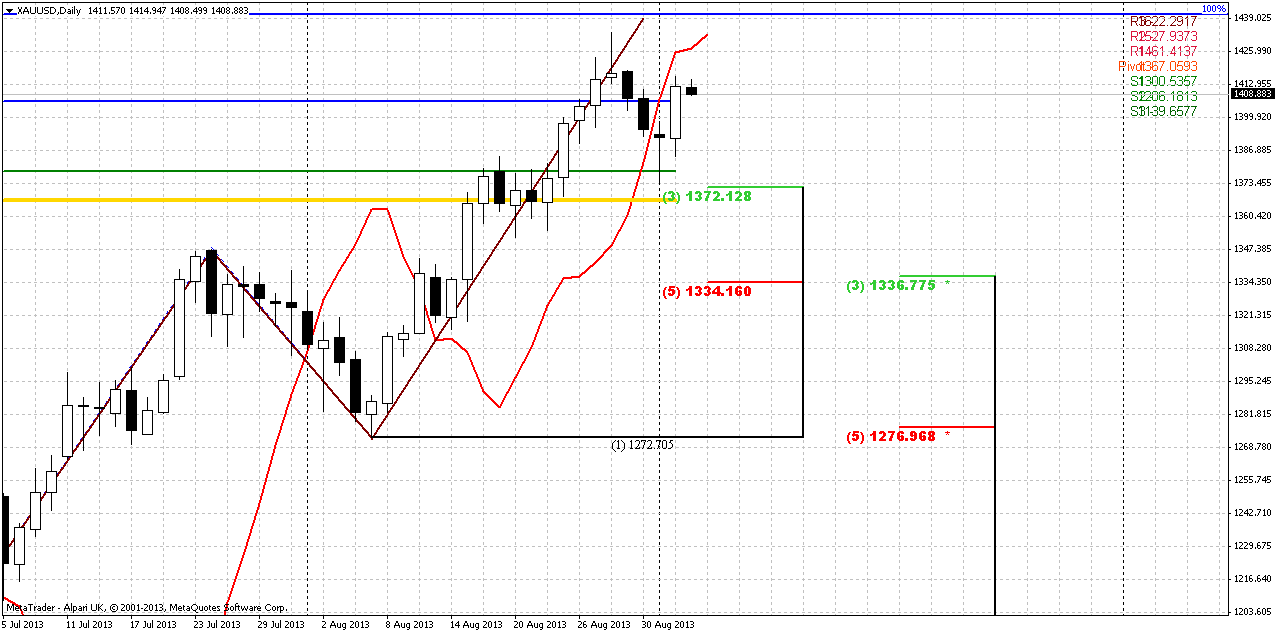
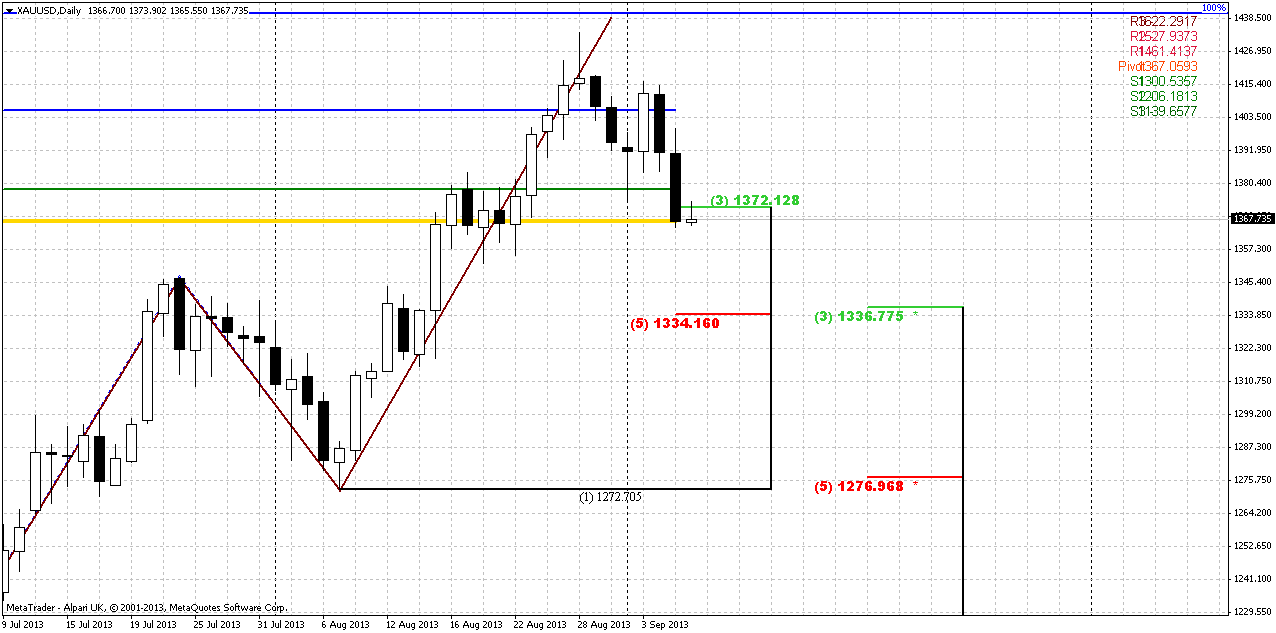
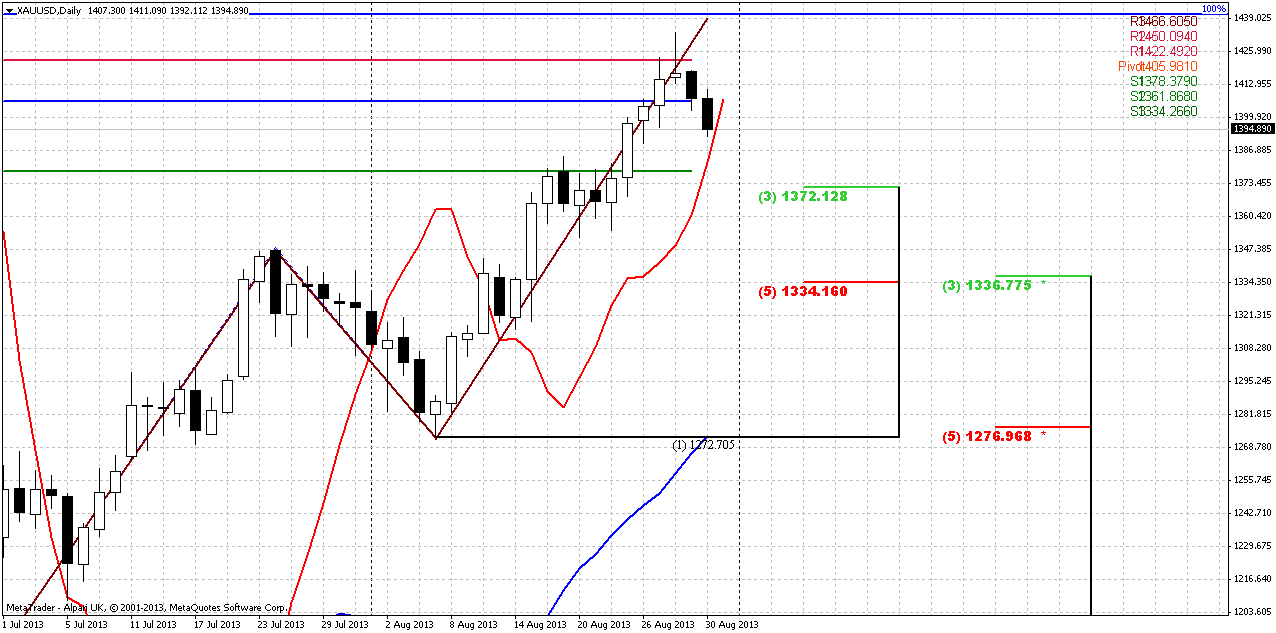
Daily time frame is very informative right now. There are a lot of moments to keep an eye on. First of all, you probably remember, guys, my warnings about “not quite hit” AB=CD target at 1440 area. Price slightly has not reached it and currently market stands at the eve of crossing with MACDP line. Such crosses are very important, since they could give us stop grabbers. I do not want to tell that market has to hit 1440, although in most cases price returns, hits the target and only after that starts real retracement. But sometimes this happens, when price abandons target without hitting it, although quite rare. Anyway, this is the moment that we should watch closely. If we will get the stop grabber, it will mean that market should do an attempt to reach 1440 area.
Second is, as we expect to see retracement, and this retracement could be deep, even to 1276 Fib support and it will be normal, we should monitor intermediate support levels as well. By the way, take a look that major 0.618 Fib support stands above daily oversold and market can reach it.
Personally, I prefer to see retracement not deeper than 1335 K-support area. Mostly because it coincides with previous swing high. This will just look stronger and more bullish, than retracement to 1276. Above this area another nice support stands – 1372 Fib level and WPS1. As you can see, market is loaded with different levels and that could give a lot of trading possibilities.
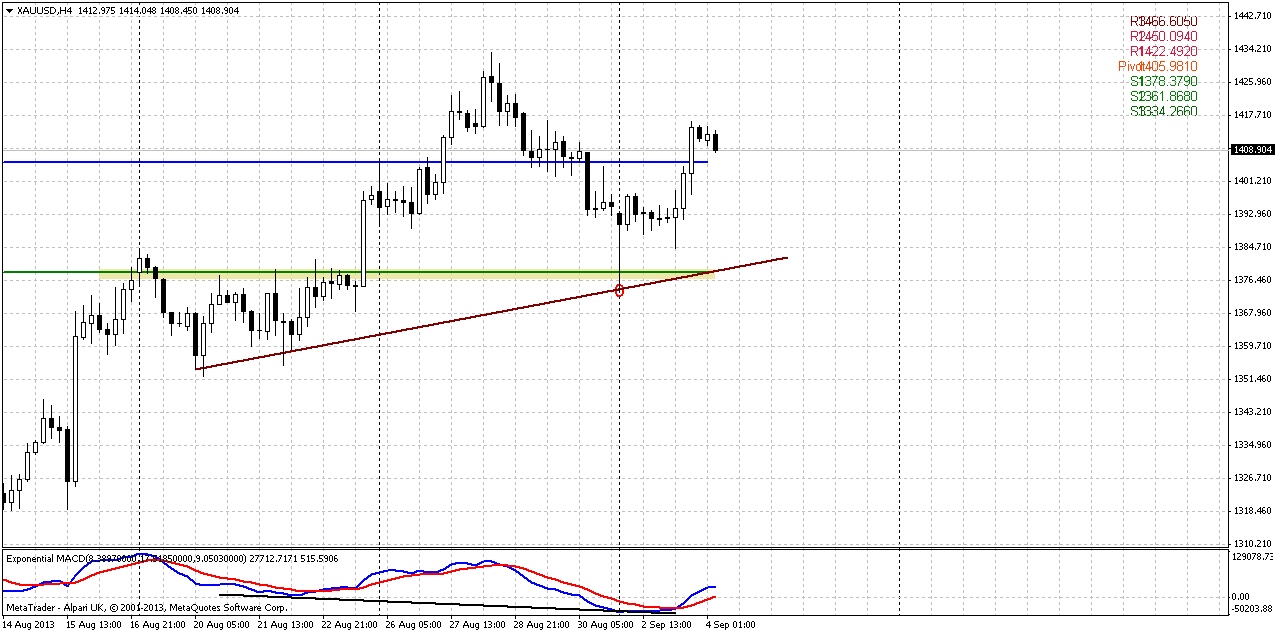
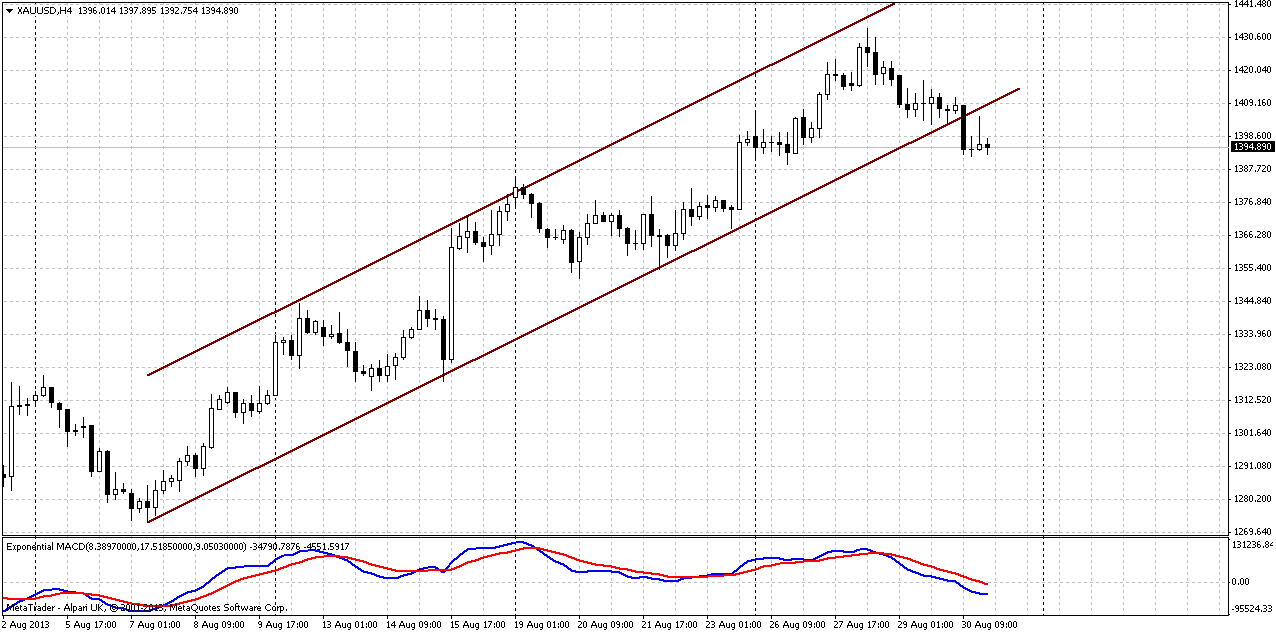
4-hour
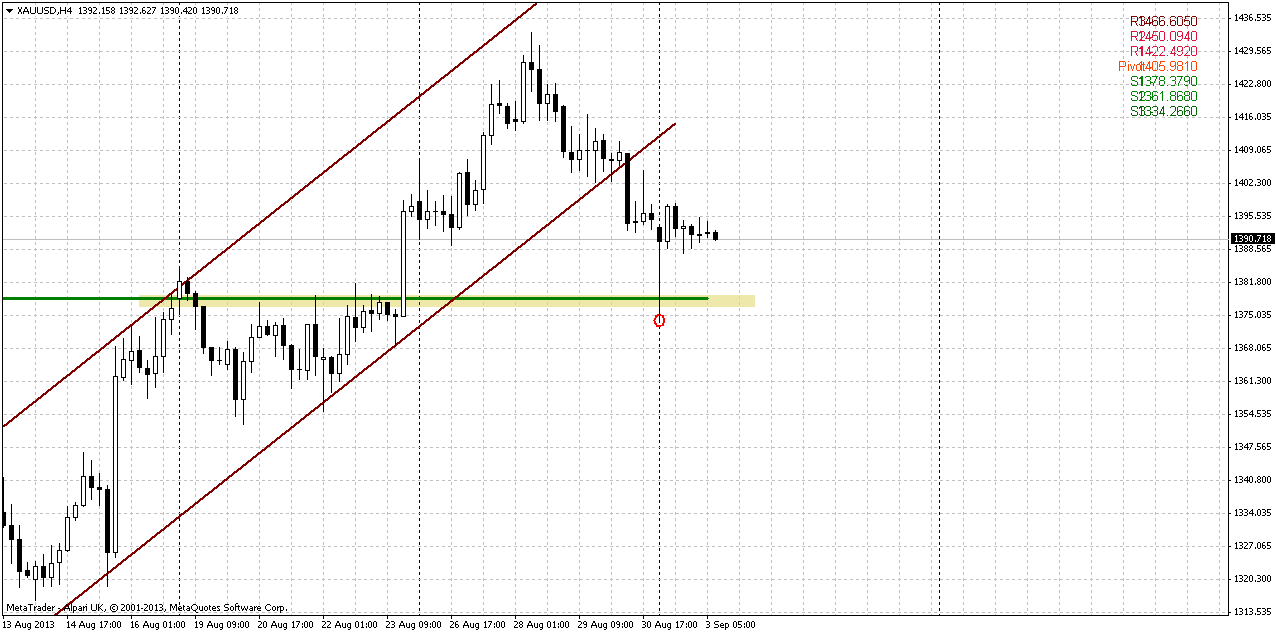
Here is only single significant moment. Stable standing of the market below channel’s support line. On Friday we’ve said, that we need to be sure that this is not fake breakout and that market will remain there. Currently we see that market stands lower rather stably. But, as we’ve said on daily chart – all eyes on possible stop grabber, since short term upward momentum is also strong enough to form it, and we still have untouched target. Knowing the cunning of gold market, stop grabber and later move to 1440 before any real retracement will start seems very probable. Despite how it will turn, before making an attempt to ride on downward retracement, we should get hard rock confidence that market will not return right back to 1440 area.
Conclusion:
Technically and fundamentally gold market stands in long-term bearish motion, but there are more and more factors start to appear that make downward action as not as cloudless as it was recently. Also we’ve got VOB pattern that gives us forecast for long-term price behavior and promise compounded downward move in shape of some AB-CD.
Fundamentally some supportive factors have appeared, and this could shift to greater retracement up. On passed week market again has given us a confirmation of this thought. Currently we have reasons as technical as fundamental to suggest that this could be upward retracement on long term charts, since market has moved above MPR1&2 on August and completed reversal swing up.
Meantime, in short-term perspective solid bearish momentum could trigger deep retracement on daily chart, even to 1276 area. That’s normal and as a rule happens after reversal swing. Among traders there is even silence rule of thumb – “buy first AB=CD down after reversal swing”. Let’s see how it will work on this time. In the beginning of the week keep an eye on possible bullish stop grabber on daily chart, because we still have some bearish traps and we have to be absolutely sure whether they will work or not.
The technical portion of Sive's analysis owes a great deal to Joe DiNapoli's methods, and uses a number of Joe's proprietary indicators. Please note that Sive's analysis is his own view of the market and is not endorsed by Joe DiNapoli or any related companies.
Gold slid below $1,400 an ounce on Friday as the dollar rallied to a four-week high, with investors squaring positions at the end of the month and cashing in on a recent run-up ahead of a long U.S. holiday weekend. Analysts said gold's losses came mostly from month-end position squaring and profit-taking after prices on Wednesday reached their highest levels since mid-May. Investors remained poised for word on any U.S. military action in Syria. According to Reuter’s commentary, - "Gold is under pressure from a firm U.S. dollar and lower oil prices after the West debates whether to attack Syria," Commerzbank analyst Eugen Weinberg said. "The move higher in August was driven mostly by short-covering and opportunistic buying, which seems to have now run out of steam," VTB Capital analyst Andrey Kryuchenkov said.
Earlier, data showing the pace of U.S. Midwest business activity rose to 53.0 from 52.3 in July helped lift the dollar but pressured gold. The index for prices paid within the series rose to its highest since November, raising an inflation flag that fed expectations the Federal Reserve could soon taper its monetary stimulus. In Hong Kong gold kilo bar premiums declined to $2.50 an ounce from $5 two weeks ago. Tokyo premiums fell to 50 cents from $1.50. Those in Singapore dropped to $1.50.
CFTC data shows that downward retracement is possible. As you can see, within whole move up and increasing of speculative net long position, open interest does not support it. Sometimes it happens in the points of trend changing. As previous swing up was just initial move up (reversal swing) after long-term bearish action, some solid retracement down is possible on gold. Approximately the same picture could be found on silver. But still, situation gradually is changing. SPDR Fund again shows inflows but on past week they were rather shy and appear to be at 1.03 tonnes.
August candle has become the second month of upward action on gold market. Still we keep in mind Volatility breakout pattern and know that there will be 3-leg downward action. This means that current bounce will be just retracement probably. Second, currently we know that market at support – Fib support, target of rectangle breakout, completion of double harmonic swing down and monthly deep oversold. Unfortunately monthly chart does not give us much assistance in short-term trading. One bullish pattern that probably could be seen here is bullish DiNapoli “Stretch” pattern, since market stands at deep oversold right at Fib support. Thus, this is not the time to take long-term short position, but time to think about their close and searching for bullish patterns on lower time frames – weekly and daily. Target of this pattern is a middle between Oscillator Predictor Bands – right around 1550$ area. S&P analyst specifies approximately the same target. This area agrees with “Stretch” pattern as well.
Weekly
Trend is bullish here. Market has moved above all august pivot resistances within previous months. This usually tells that current move up is not occasional and is not just retracement. This could become a trend change. Second – price finally has given us desirable confirmation by swing length – upward move has appeared to be greater then previous swing down, although insignificantly. Also current move up is a biggest since the downward trend has started on gold.
The backside of all this stuff is possible deep retracement. This happens quite often when initial reverse swing is done, since downward momentum is still strong and it just does not let market freely continue move up. CFTC data also points on this probability. As situation around Syria shows some relief, at least until 9th of September, gold also will loose some support that previously was granted by geopolitical turmoil. All together these factors could lead to retracement down. We know that gold market likes 5/8 retracement and that really could be so.
Speaking about most unwelcome bullish scenario, if market will take out current lows around 1170 that probably will destroy bullish context and let us talk about re-establishing of long-term bear trend.
Daily
Daily time frame is very informative right now. There are a lot of moments to keep an eye on. First of all, you probably remember, guys, my warnings about “not quite hit” AB=CD target at 1440 area. Price slightly has not reached it and currently market stands at the eve of crossing with MACDP line. Such crosses are very important, since they could give us stop grabbers. I do not want to tell that market has to hit 1440, although in most cases price returns, hits the target and only after that starts real retracement. But sometimes this happens, when price abandons target without hitting it, although quite rare. Anyway, this is the moment that we should watch closely. If we will get the stop grabber, it will mean that market should do an attempt to reach 1440 area.
Second is, as we expect to see retracement, and this retracement could be deep, even to 1276 Fib support and it will be normal, we should monitor intermediate support levels as well. By the way, take a look that major 0.618 Fib support stands above daily oversold and market can reach it.
Personally, I prefer to see retracement not deeper than 1335 K-support area. Mostly because it coincides with previous swing high. This will just look stronger and more bullish, than retracement to 1276. Above this area another nice support stands – 1372 Fib level and WPS1. As you can see, market is loaded with different levels and that could give a lot of trading possibilities.
4-hour
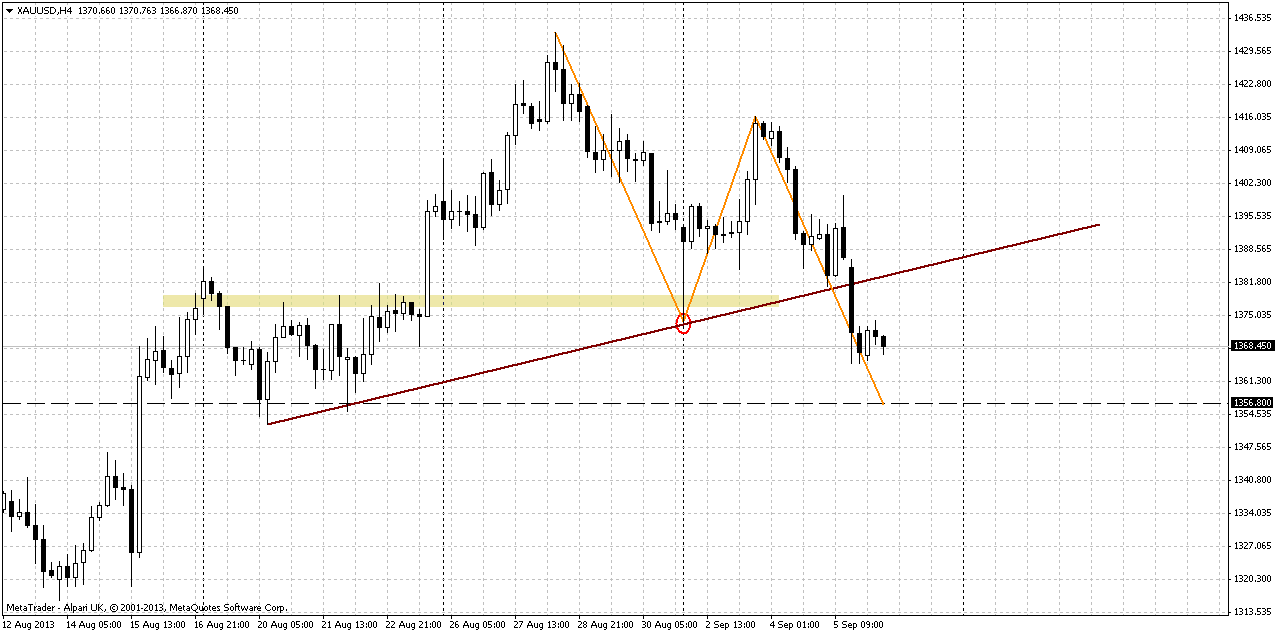
Here is only single significant moment. Stable standing of the market below channel’s support line. On Friday we’ve said, that we need to be sure that this is not fake breakout and that market will remain there. Currently we see that market stands lower rather stably. But, as we’ve said on daily chart – all eyes on possible stop grabber, since short term upward momentum is also strong enough to form it, and we still have untouched target. Knowing the cunning of gold market, stop grabber and later move to 1440 before any real retracement will start seems very probable. Despite how it will turn, before making an attempt to ride on downward retracement, we should get hard rock confidence that market will not return right back to 1440 area.
Conclusion:
Technically and fundamentally gold market stands in long-term bearish motion, but there are more and more factors start to appear that make downward action as not as cloudless as it was recently. Also we’ve got VOB pattern that gives us forecast for long-term price behavior and promise compounded downward move in shape of some AB-CD.
Fundamentally some supportive factors have appeared, and this could shift to greater retracement up. On passed week market again has given us a confirmation of this thought. Currently we have reasons as technical as fundamental to suggest that this could be upward retracement on long term charts, since market has moved above MPR1&2 on August and completed reversal swing up.
Meantime, in short-term perspective solid bearish momentum could trigger deep retracement on daily chart, even to 1276 area. That’s normal and as a rule happens after reversal swing. Among traders there is even silence rule of thumb – “buy first AB=CD down after reversal swing”. Let’s see how it will work on this time. In the beginning of the week keep an eye on possible bullish stop grabber on daily chart, because we still have some bearish traps and we have to be absolutely sure whether they will work or not.
The technical portion of Sive's analysis owes a great deal to Joe DiNapoli's methods, and uses a number of Joe's proprietary indicators. Please note that Sive's analysis is his own view of the market and is not endorsed by Joe DiNapoli or any related companies.