Sive Morten
Special Consultant to the FPA
- Messages
- 18,754
Fundamentals
Reuters informs that Gold prices ended up about 1.0 percent on Friday, driven up by a possible shutdown of U.S. government operations next week and the threat of a debt default in mid-October, as well as by the prospects for continued easy monetary policy from the Federal Reserve. The U.S. government braced on Friday for the possibility of a partial shutdown of operations on Oct. 1 as Congress struggled to pass an emergency spending bill that Republicans want to use to de-fund the new healthcare reform law. Congress also faces the hard task of raising the limit on federal borrowing authority, which Republicans are targeting for controversial add-ons. Without a debt limit increase by Oct. 17, U.S. Treasury Secretary Jack Lew has warned, the United States would have a difficult time paying creditors and operating the government. "Number one, people are worried about what's going on with the potential government shutdown and looking to gold for a safe asset," said to Reuters New York Donald Selkin, chief market strategist at National Securities Corp. in New York. "And second," he said, "The comments from Fed President Evans, when he said 'No tapering,' which means the dollar could weaken and gold would go up because there's more money floating around." Charles Evans, president of the Chicago Federal Reserve Bank told reporters on Friday, there was a "decent chance" that tapering could start in October or December, but it could be pushed into 2014."
Yesterday, guys, we also have made some comments on this subject in fundamental part of our EUR weekly research. This is really interesting and thrilling topic, thus, it will be just perfect – if you will read it and we can open discussion on forum.
CFTC data still shows flat action, at least open interest has not changed much within previous month. Report does not give us additional clarification. Although net position is changing and has grown on previous week – open interest has not changed. It means that market stands indecision, and no new contracts were added. Position is changing because already existed contracts just change the holder.
 Thus, if you’ve read introduction to EUR research, we will get really tough month – turmoil around government, NFP, Debt Ceil, GDP and FOMC meeting. Let’s see how we will out from this…
Monthly
Fortunately or unfortunately, guys, but we can’t add much comments on monthly chart. September candle still inside one for August.
It might happen that we now stand at the eve of some important events as we’ve said above and who knows, may be we will have to drastically change our view on the market soon. But right now we will continue to hold with our previous analysis suggesting that market now stands in upward retracement. September black candle is not a tragedy and even looks absolutely reasonable. Take a look, we have almost a year of consequtive drop – month by month. Previous 2 candles were the first ones up. Bearish momentum is not disappear it still on the market and presses on it, does not let market freely change sentiment. Thus, such sort of “returns” should not surprise us. All other analysis here is still the same. Current move down probably should become a part of compounded retracement up, until market will not take current lows. Only in this case we could say that bearish trend has continued.
We keep in mind Volatility breakout pattern and know that there will be 3-leg downward action. This means that current bounce will be just retracement probably. Second, currently we know that market at support – Fib support, target of rectangle breakout, completion of double harmonic swing down and monthly deep oversold. Unfortunately monthly chart does not give us much assistance in short-term trading. One bullish pattern that probably could be seen here is bullish DiNapoli “Stretch” pattern, since market stands at deep oversold right at Fib support. Target of this pattern is a middle between Oscillator Predictor Bands – right around 1550$ area. That is also the lower border of long-term consolidation after historical peak. This area agrees with “Stretch” pattern as well.

Weekly
Passed week also was an inside one. Two weeks ago market action has taken shape on high wave pattern and indicated that market stands indecision. New candle, although has shown shy upward action, in general, shows rather tight range and just confirms our thoughts that we’ve made in fundamental part of research – investors are waiting of changes and do not take fast and drastical steps.
Speaking about previous analysis, mostly it is stands the same. It is too early to say that market has started move down again. Current price action is absolutely normal for reversal swing. Trend holds bullish, market stands at 50% support level and MPS1. Recent candles as we’ve said, mostly indicates indecision, since price has closed around open level. Retracement down is also reasonable, since market has hit major 0.382 Fib resistance level. Taking into consideration previous bearish power and momentum, market just can’t show light retracement, since momentum is still here and it should be fade out particularly by deep retracements. In general, we probably will say that market has re-established bearish trend only if it will take out current lows around 1170. Or if we will see some clear signs of inability to move higher.

Daily
Bearish context has become stronger on Friday. As we do not have much to discuss on monthly and weekly charts, here we have a lot. Previous week was tight consolidation that has created bearish flag pattern. Market has not shown any signs that could confirm its bullish ambitions. As a result, upward action was shy and bearish stop grabber still holds, although market has not quite reached its target yet. Even more, on Friday we’ve got another one – right inside the flag. Thus, hopes on easy upward continuation with suggested butterfly are melting fast and probably we should be ready for downward action on coming week. Trend is bearish here and market not at oversold. If downward action will start we could get two different AB-CD patterns. Here I draw first and greater one, second AB=CD we will discuss below. Interestingly, that 0.618 target stands at 1288 - slightly lower than previous lows and this target perfectly agree with stop grabbers. Also it opens the door for W&R, because market could just accomplish AB-CD minor target and then turn back. It stands very close to 5/8 Fib support as well. Market has a lot of possibilities for different pitfalls and it is very difficult to predict what will happen in really. Still, let’s focus on the first step – move to 1288.

4-hour
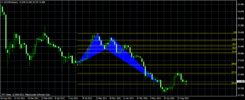
But 4-hour chart really could put paid on bulls’ hopes. Just take a look at it. Huge butterfly “Buy” with 1.27 extension around 1270 – in agreement with major 5/8 Fib support. Inner AB=CD pattern also has 100% target around 1280 – that’s our second AB=CD.
So, let’s try to combine the puzzle and see what we have. Bearish trend on daily, two bearish stop grabbers with minimum target around 1288, market’s inability to start move up on previous week that takes the shape of bearish flag and finally – butterfly “buy” with 1.27 extension in agreement with 5/8 Fib support with daily grabber as a starting point of right wing down. I do not want to take long positon by far, since I do not see reasons for that. Conversely, we have mostly bearish context probably.

1-hour
Here market is taking the shape of rising wedge (daily flag pattern). Four waves have been done already inside of the wedge and usually breakout takes place on 5th wave and it should be down. It is possible that market could move slightly higher and even create a new high. In this case it will reach 5/8 Fib resistance and take the shape of 3-Drive Sell pattern. But situation on hourly chart absolutely does not contradict with overall picture on other time frames.

Conclusion:
Situation becomes tough on financial markets. In October we will get a lot of significant fundamental events and we have suspicion that it could lead to huge flow among assets, particularly speaking – out of US stocks.
Meantime in short-term perspective, gold has failed to convince us with possible upward continuation and probability now stands in favor of bearish development
The technical portion of Sive's analysis owes a great deal to Joe DiNapoli's methods, and uses a number of Joe's proprietary indicators. Please note that Sive's analysis is his own view of the market and is not endorsed by Joe DiNapoli or any related companies.
Reuters informs that Gold prices ended up about 1.0 percent on Friday, driven up by a possible shutdown of U.S. government operations next week and the threat of a debt default in mid-October, as well as by the prospects for continued easy monetary policy from the Federal Reserve. The U.S. government braced on Friday for the possibility of a partial shutdown of operations on Oct. 1 as Congress struggled to pass an emergency spending bill that Republicans want to use to de-fund the new healthcare reform law. Congress also faces the hard task of raising the limit on federal borrowing authority, which Republicans are targeting for controversial add-ons. Without a debt limit increase by Oct. 17, U.S. Treasury Secretary Jack Lew has warned, the United States would have a difficult time paying creditors and operating the government. "Number one, people are worried about what's going on with the potential government shutdown and looking to gold for a safe asset," said to Reuters New York Donald Selkin, chief market strategist at National Securities Corp. in New York. "And second," he said, "The comments from Fed President Evans, when he said 'No tapering,' which means the dollar could weaken and gold would go up because there's more money floating around." Charles Evans, president of the Chicago Federal Reserve Bank told reporters on Friday, there was a "decent chance" that tapering could start in October or December, but it could be pushed into 2014."
Yesterday, guys, we also have made some comments on this subject in fundamental part of our EUR weekly research. This is really interesting and thrilling topic, thus, it will be just perfect – if you will read it and we can open discussion on forum.
CFTC data still shows flat action, at least open interest has not changed much within previous month. Report does not give us additional clarification. Although net position is changing and has grown on previous week – open interest has not changed. It means that market stands indecision, and no new contracts were added. Position is changing because already existed contracts just change the holder.
Monthly
Fortunately or unfortunately, guys, but we can’t add much comments on monthly chart. September candle still inside one for August.
It might happen that we now stand at the eve of some important events as we’ve said above and who knows, may be we will have to drastically change our view on the market soon. But right now we will continue to hold with our previous analysis suggesting that market now stands in upward retracement. September black candle is not a tragedy and even looks absolutely reasonable. Take a look, we have almost a year of consequtive drop – month by month. Previous 2 candles were the first ones up. Bearish momentum is not disappear it still on the market and presses on it, does not let market freely change sentiment. Thus, such sort of “returns” should not surprise us. All other analysis here is still the same. Current move down probably should become a part of compounded retracement up, until market will not take current lows. Only in this case we could say that bearish trend has continued.
We keep in mind Volatility breakout pattern and know that there will be 3-leg downward action. This means that current bounce will be just retracement probably. Second, currently we know that market at support – Fib support, target of rectangle breakout, completion of double harmonic swing down and monthly deep oversold. Unfortunately monthly chart does not give us much assistance in short-term trading. One bullish pattern that probably could be seen here is bullish DiNapoli “Stretch” pattern, since market stands at deep oversold right at Fib support. Target of this pattern is a middle between Oscillator Predictor Bands – right around 1550$ area. That is also the lower border of long-term consolidation after historical peak. This area agrees with “Stretch” pattern as well.
Weekly
Passed week also was an inside one. Two weeks ago market action has taken shape on high wave pattern and indicated that market stands indecision. New candle, although has shown shy upward action, in general, shows rather tight range and just confirms our thoughts that we’ve made in fundamental part of research – investors are waiting of changes and do not take fast and drastical steps.
Speaking about previous analysis, mostly it is stands the same. It is too early to say that market has started move down again. Current price action is absolutely normal for reversal swing. Trend holds bullish, market stands at 50% support level and MPS1. Recent candles as we’ve said, mostly indicates indecision, since price has closed around open level. Retracement down is also reasonable, since market has hit major 0.382 Fib resistance level. Taking into consideration previous bearish power and momentum, market just can’t show light retracement, since momentum is still here and it should be fade out particularly by deep retracements. In general, we probably will say that market has re-established bearish trend only if it will take out current lows around 1170. Or if we will see some clear signs of inability to move higher.
Daily
Bearish context has become stronger on Friday. As we do not have much to discuss on monthly and weekly charts, here we have a lot. Previous week was tight consolidation that has created bearish flag pattern. Market has not shown any signs that could confirm its bullish ambitions. As a result, upward action was shy and bearish stop grabber still holds, although market has not quite reached its target yet. Even more, on Friday we’ve got another one – right inside the flag. Thus, hopes on easy upward continuation with suggested butterfly are melting fast and probably we should be ready for downward action on coming week. Trend is bearish here and market not at oversold. If downward action will start we could get two different AB-CD patterns. Here I draw first and greater one, second AB=CD we will discuss below. Interestingly, that 0.618 target stands at 1288 - slightly lower than previous lows and this target perfectly agree with stop grabbers. Also it opens the door for W&R, because market could just accomplish AB-CD minor target and then turn back. It stands very close to 5/8 Fib support as well. Market has a lot of possibilities for different pitfalls and it is very difficult to predict what will happen in really. Still, let’s focus on the first step – move to 1288.
4-hour
But 4-hour chart really could put paid on bulls’ hopes. Just take a look at it. Huge butterfly “Buy” with 1.27 extension around 1270 – in agreement with major 5/8 Fib support. Inner AB=CD pattern also has 100% target around 1280 – that’s our second AB=CD.
So, let’s try to combine the puzzle and see what we have. Bearish trend on daily, two bearish stop grabbers with minimum target around 1288, market’s inability to start move up on previous week that takes the shape of bearish flag and finally – butterfly “buy” with 1.27 extension in agreement with 5/8 Fib support with daily grabber as a starting point of right wing down. I do not want to take long positon by far, since I do not see reasons for that. Conversely, we have mostly bearish context probably.
1-hour
Here market is taking the shape of rising wedge (daily flag pattern). Four waves have been done already inside of the wedge and usually breakout takes place on 5th wave and it should be down. It is possible that market could move slightly higher and even create a new high. In this case it will reach 5/8 Fib resistance and take the shape of 3-Drive Sell pattern. But situation on hourly chart absolutely does not contradict with overall picture on other time frames.
Conclusion:
Situation becomes tough on financial markets. In October we will get a lot of significant fundamental events and we have suspicion that it could lead to huge flow among assets, particularly speaking – out of US stocks.
Meantime in short-term perspective, gold has failed to convince us with possible upward continuation and probability now stands in favor of bearish development
The technical portion of Sive's analysis owes a great deal to Joe DiNapoli's methods, and uses a number of Joe's proprietary indicators. Please note that Sive's analysis is his own view of the market and is not endorsed by Joe DiNapoli or any related companies.