Admiral Markets
AdmiralMarkets.com Representative
- Messages
- 95
Major Forex Pairs at Decisive Support and Resistance
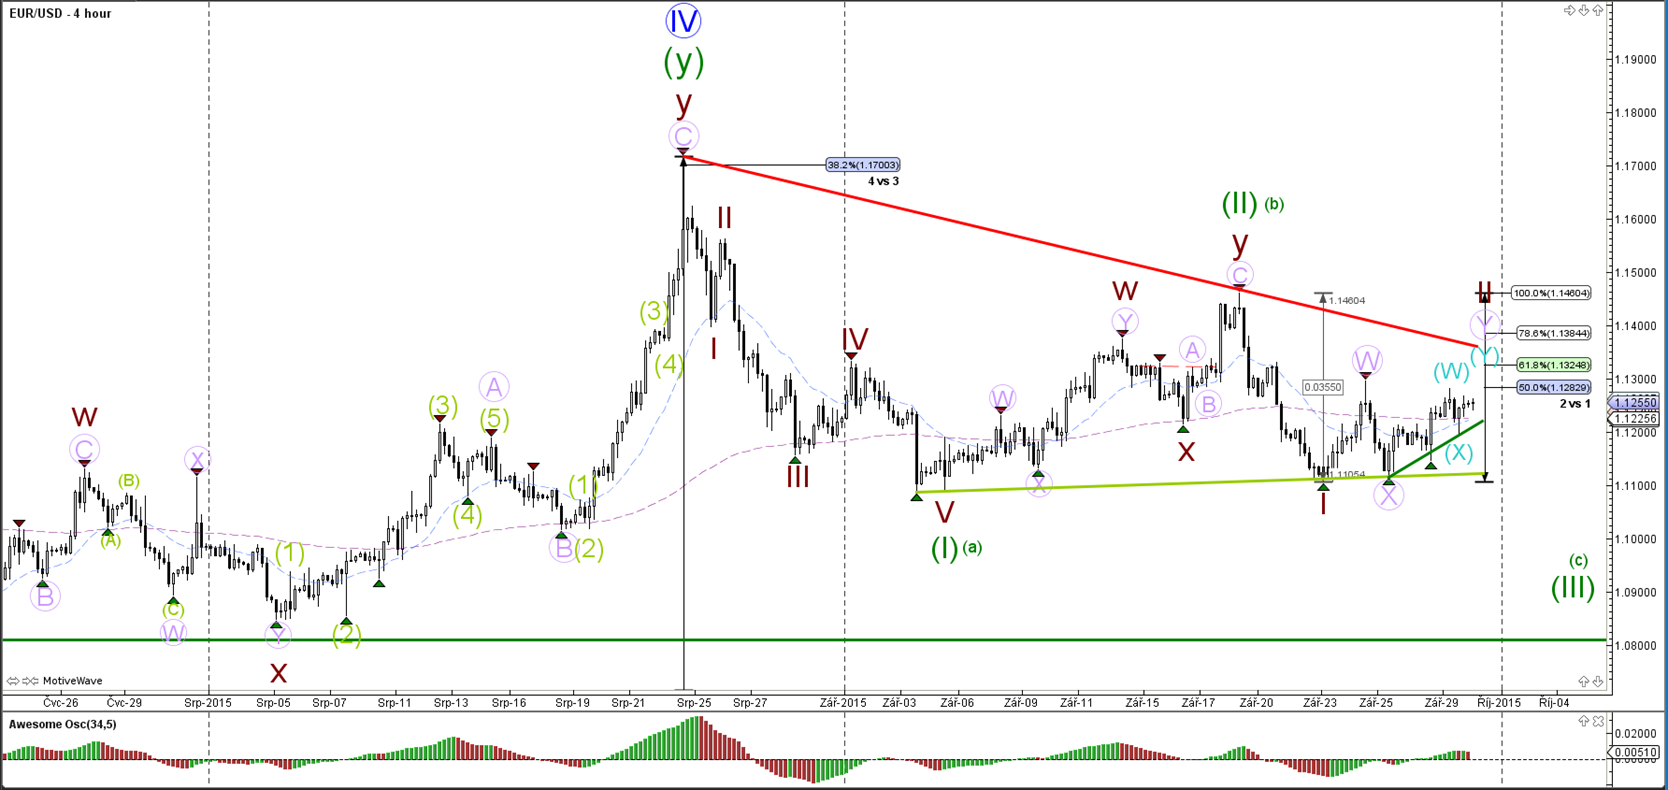
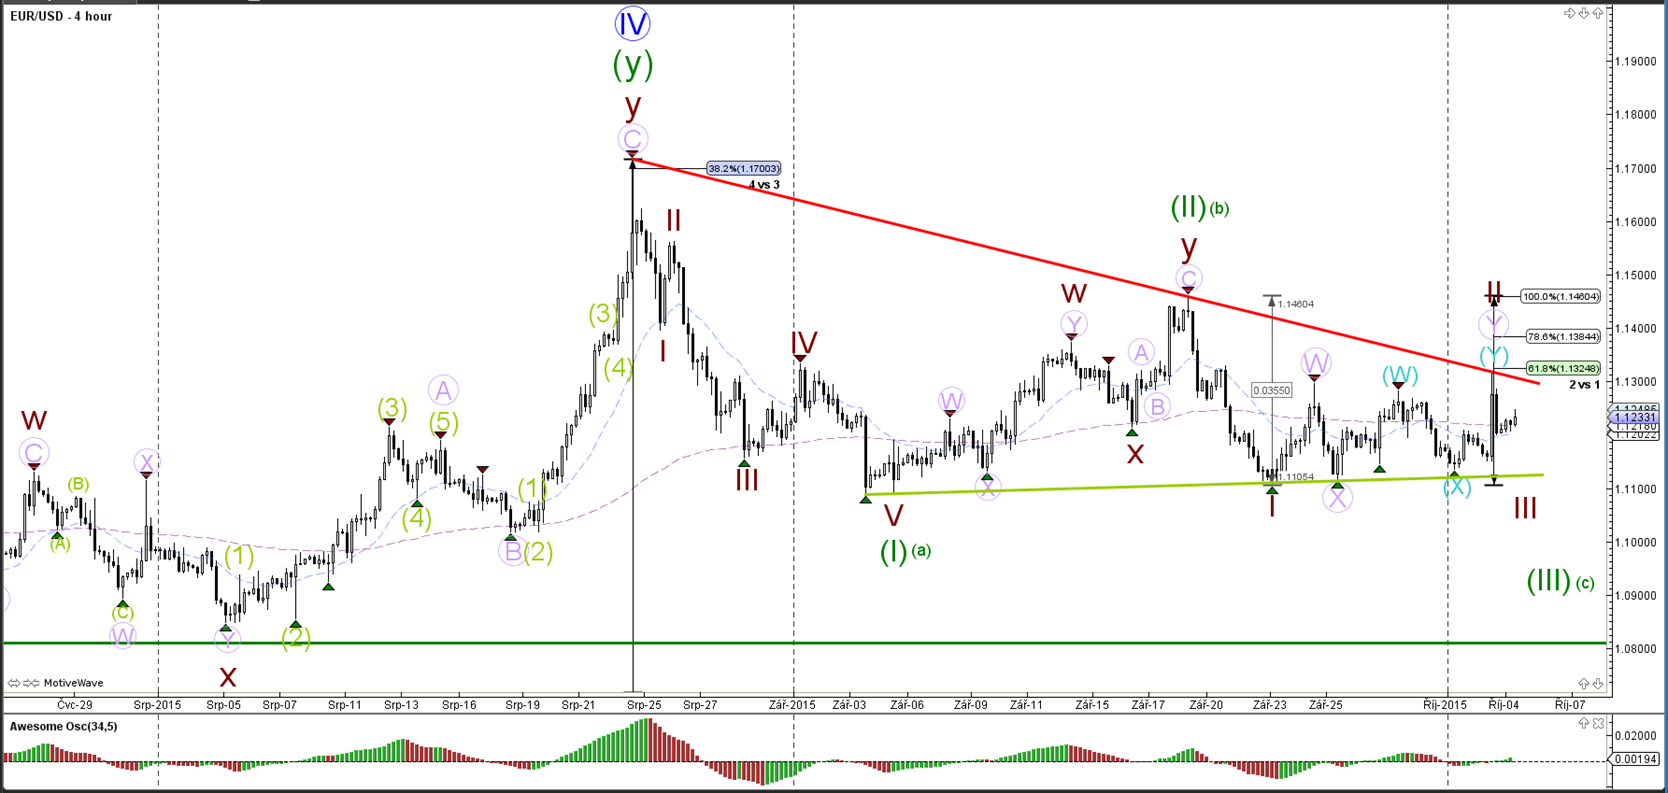
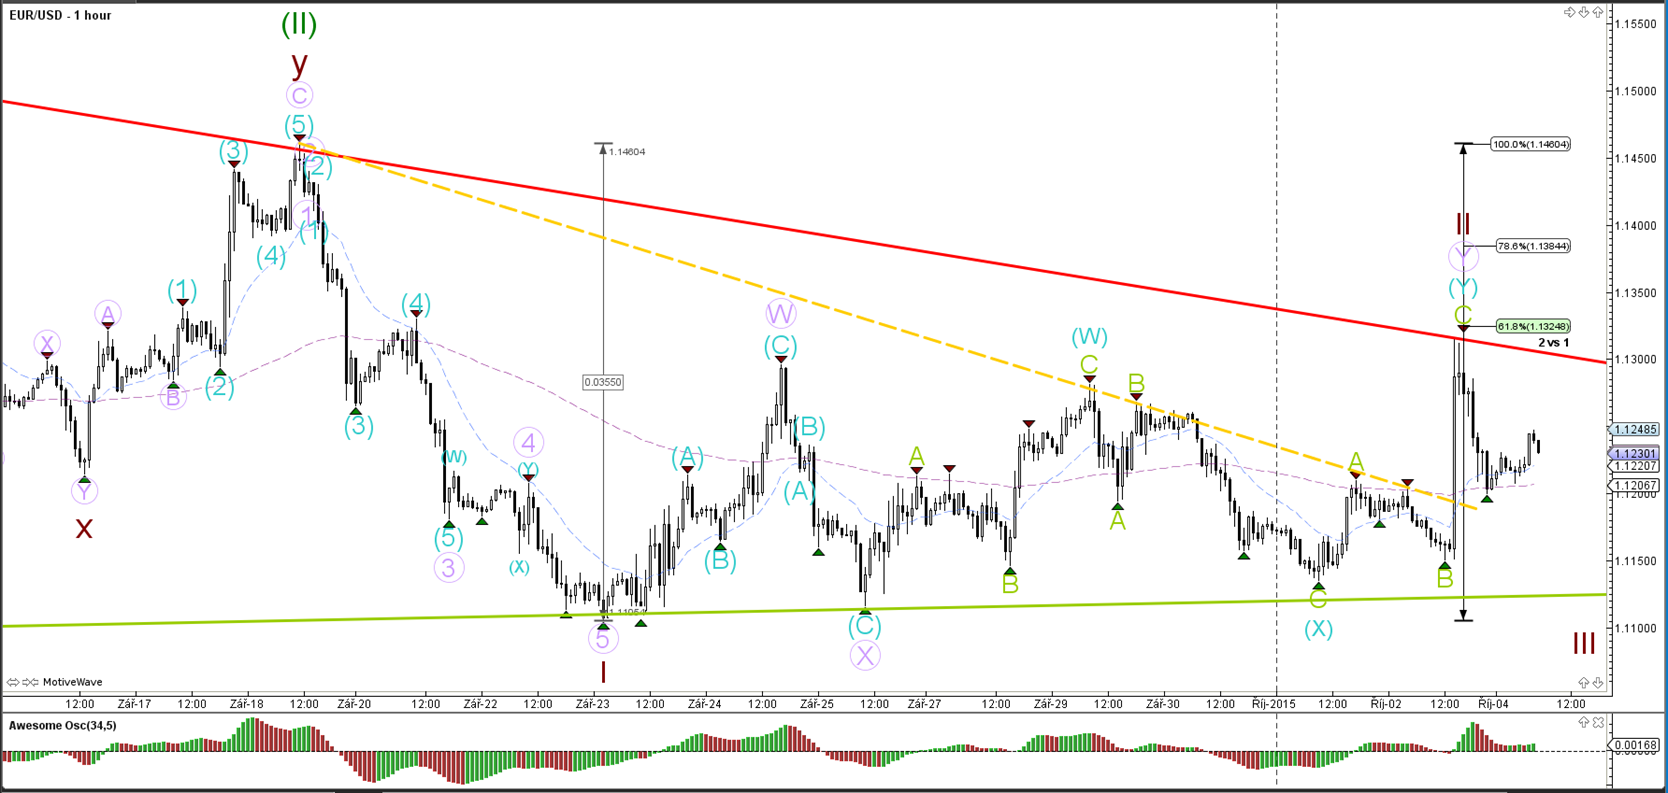
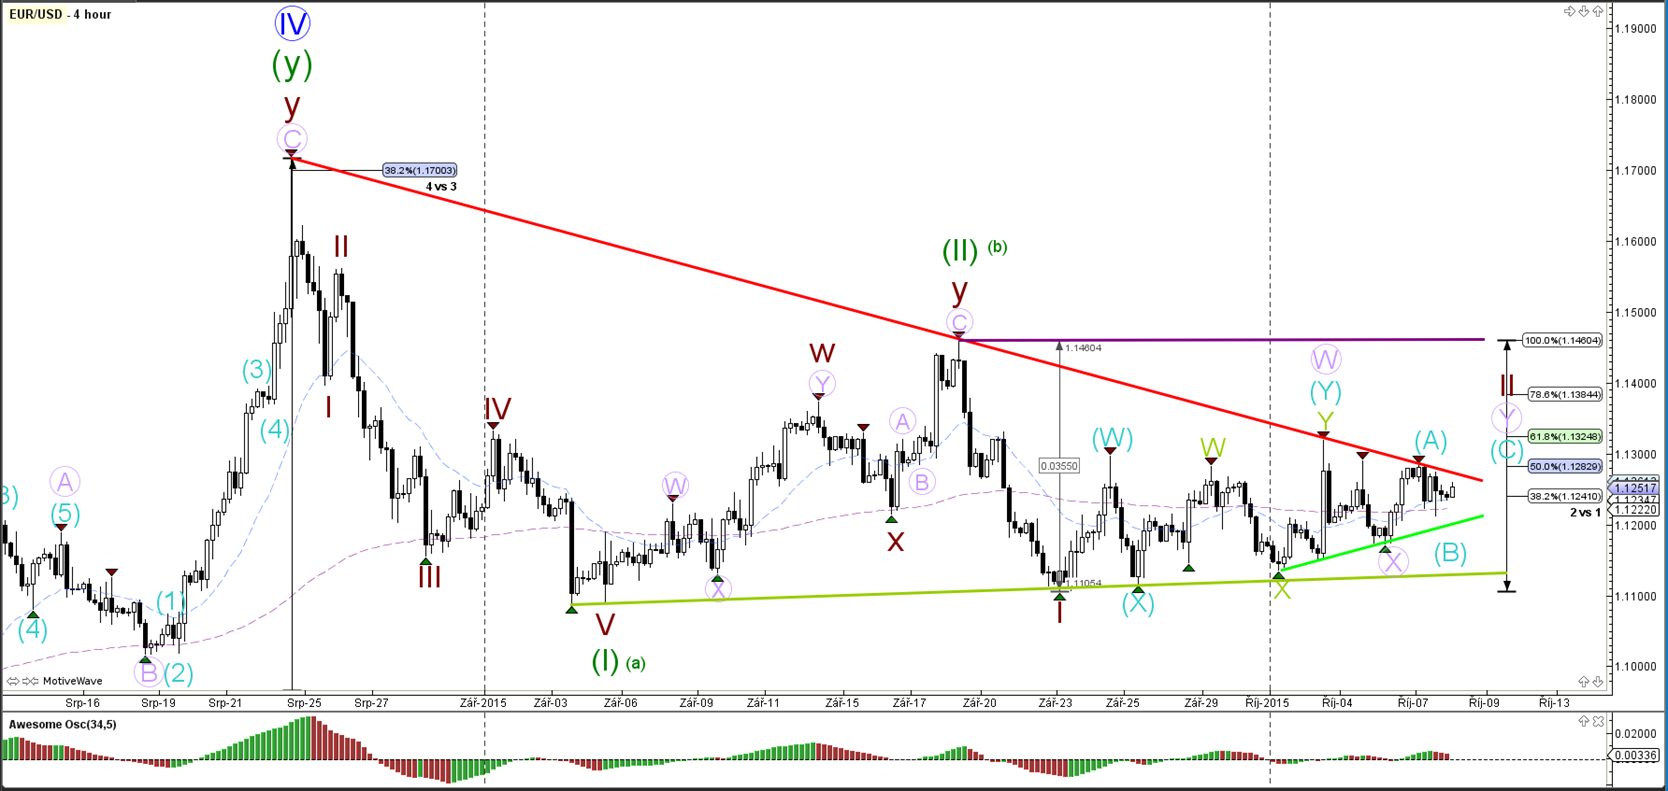
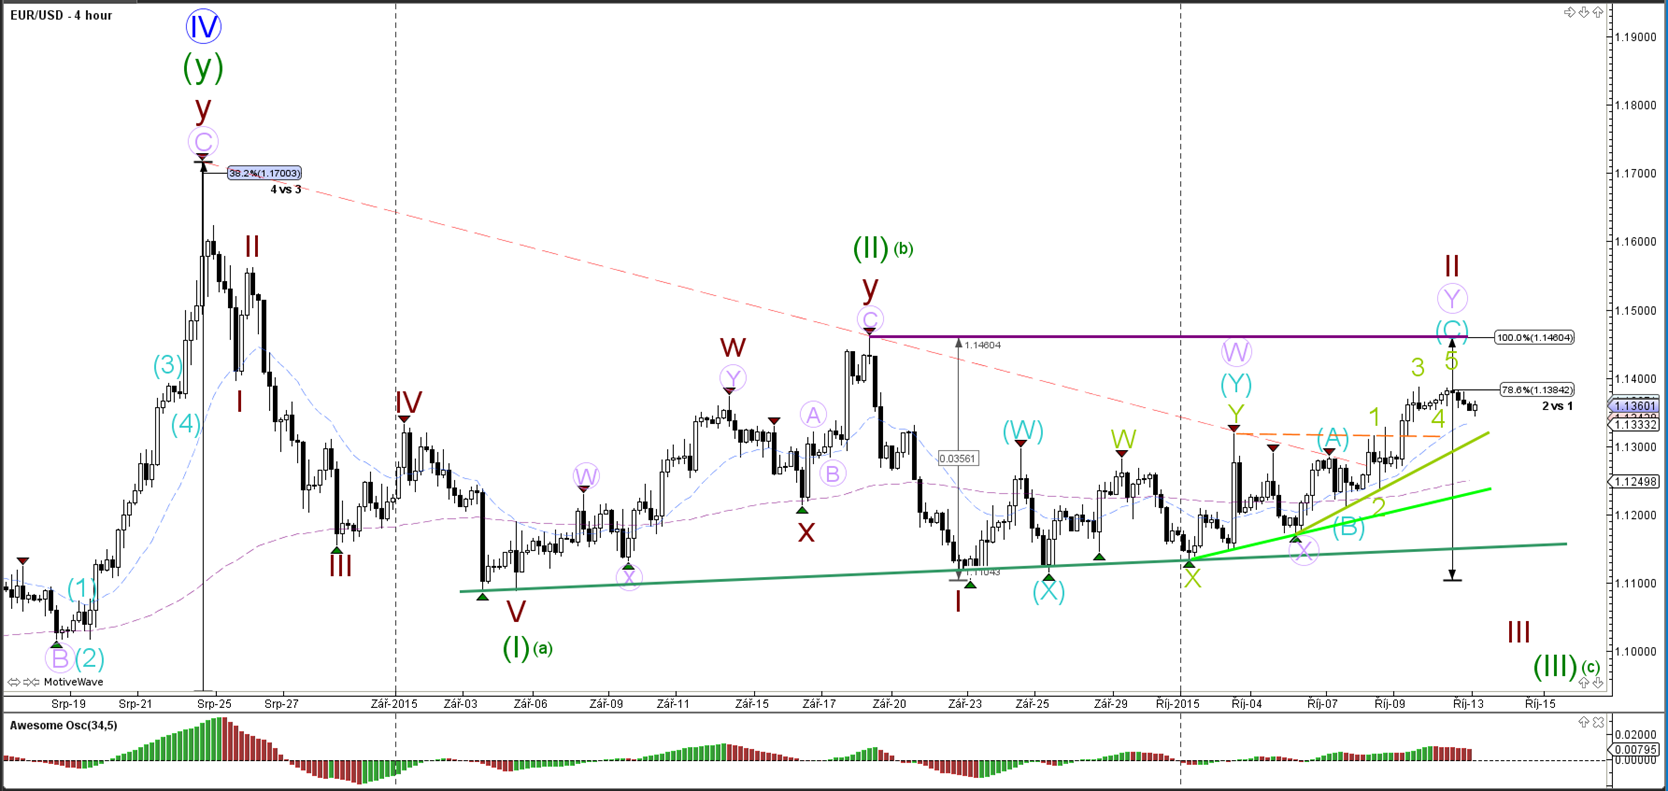
EUR/USD
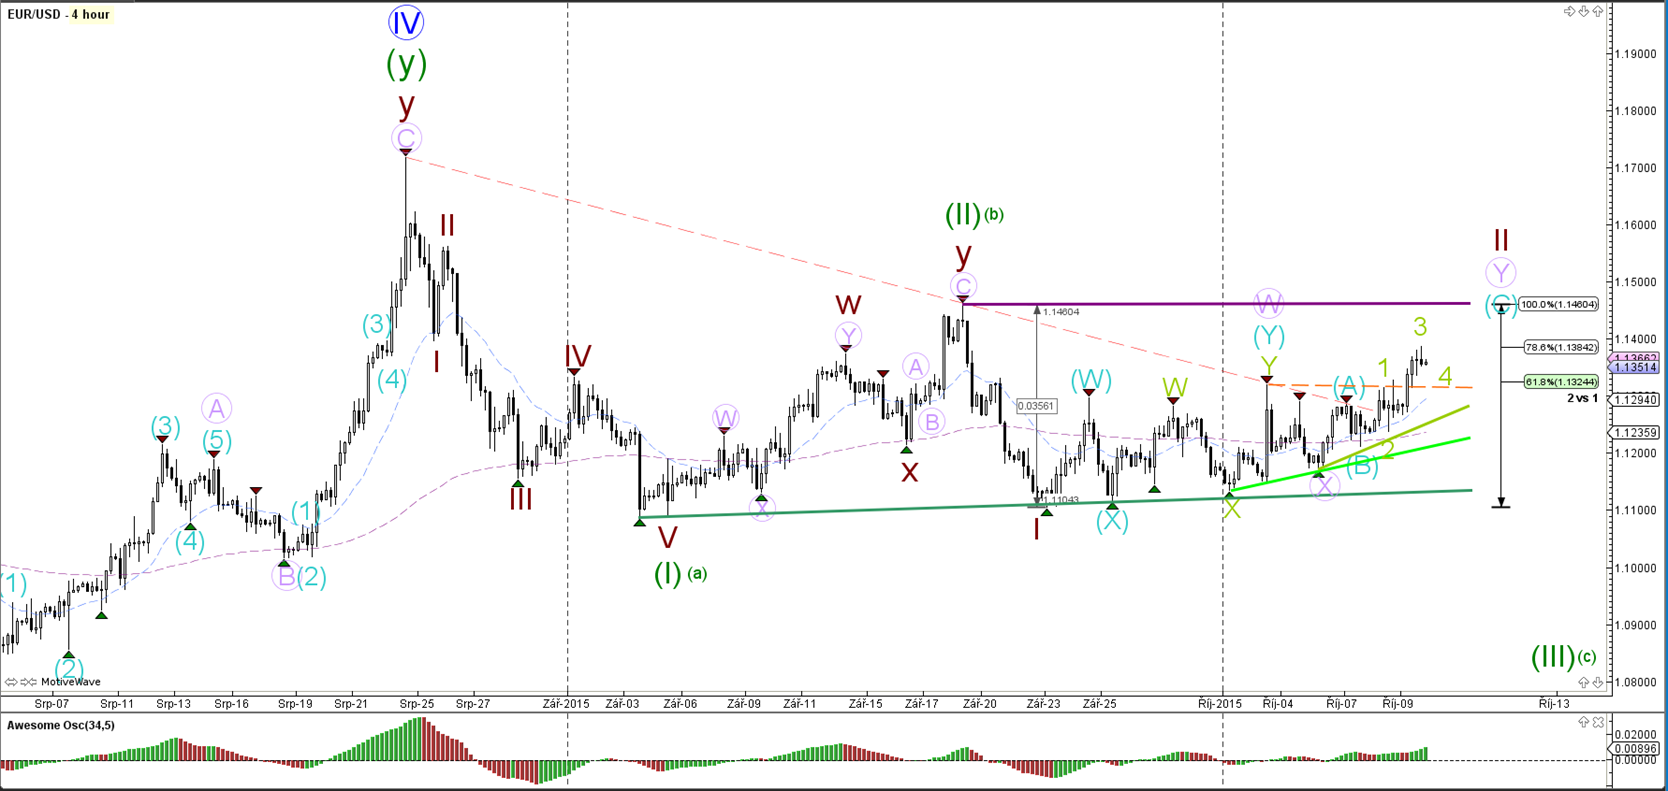
4 hour

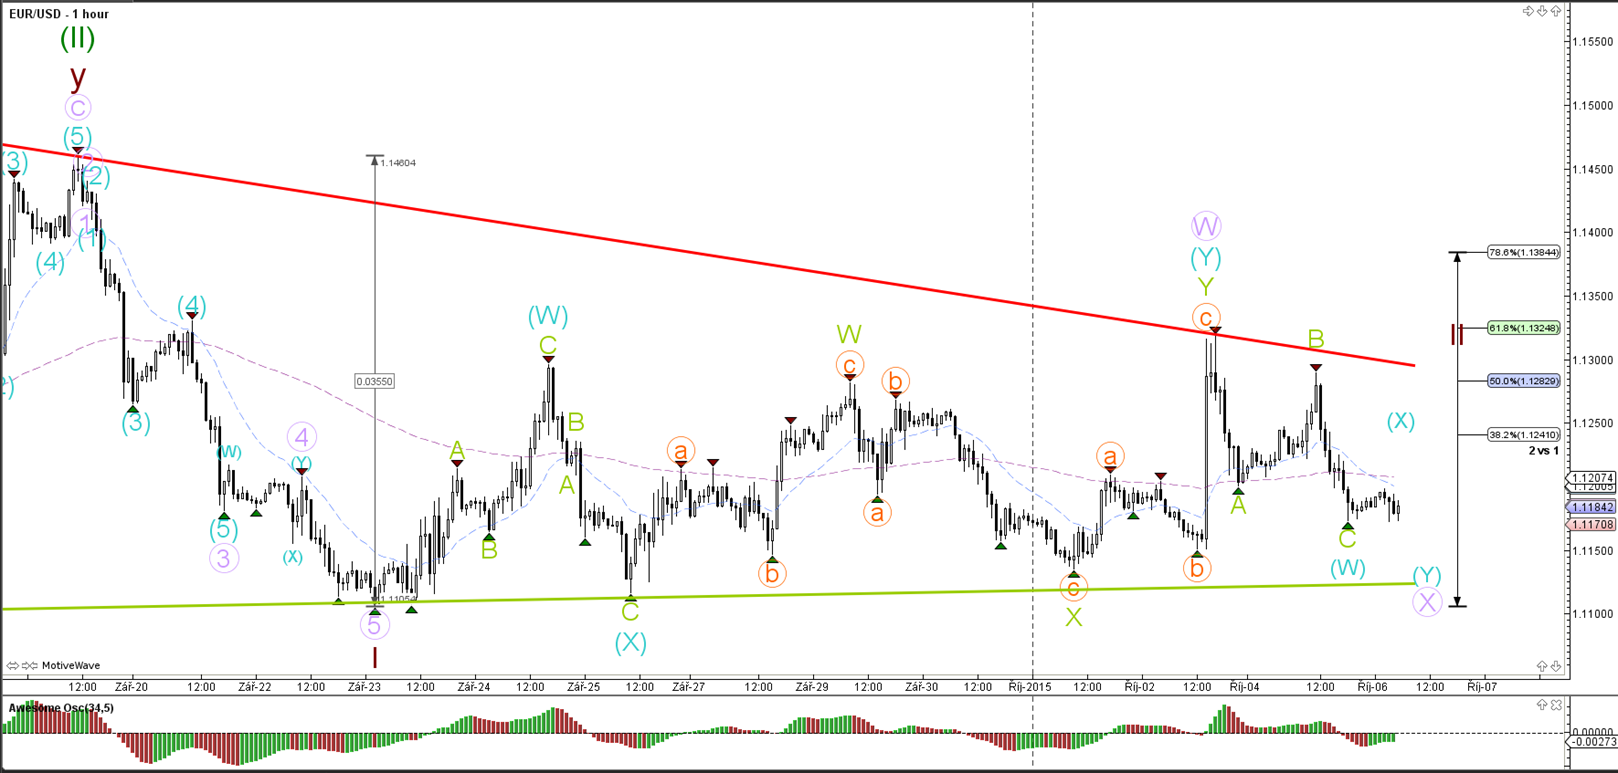
The EUR/USD is pulling back again within the wave 2 (brown) and has a potential of moving towards the 61.8% or the 78.6%. A break above the top (100%) invalidates the 1-2 development whereas a break below support (green) could initiate the start of wave 3 or C (green).
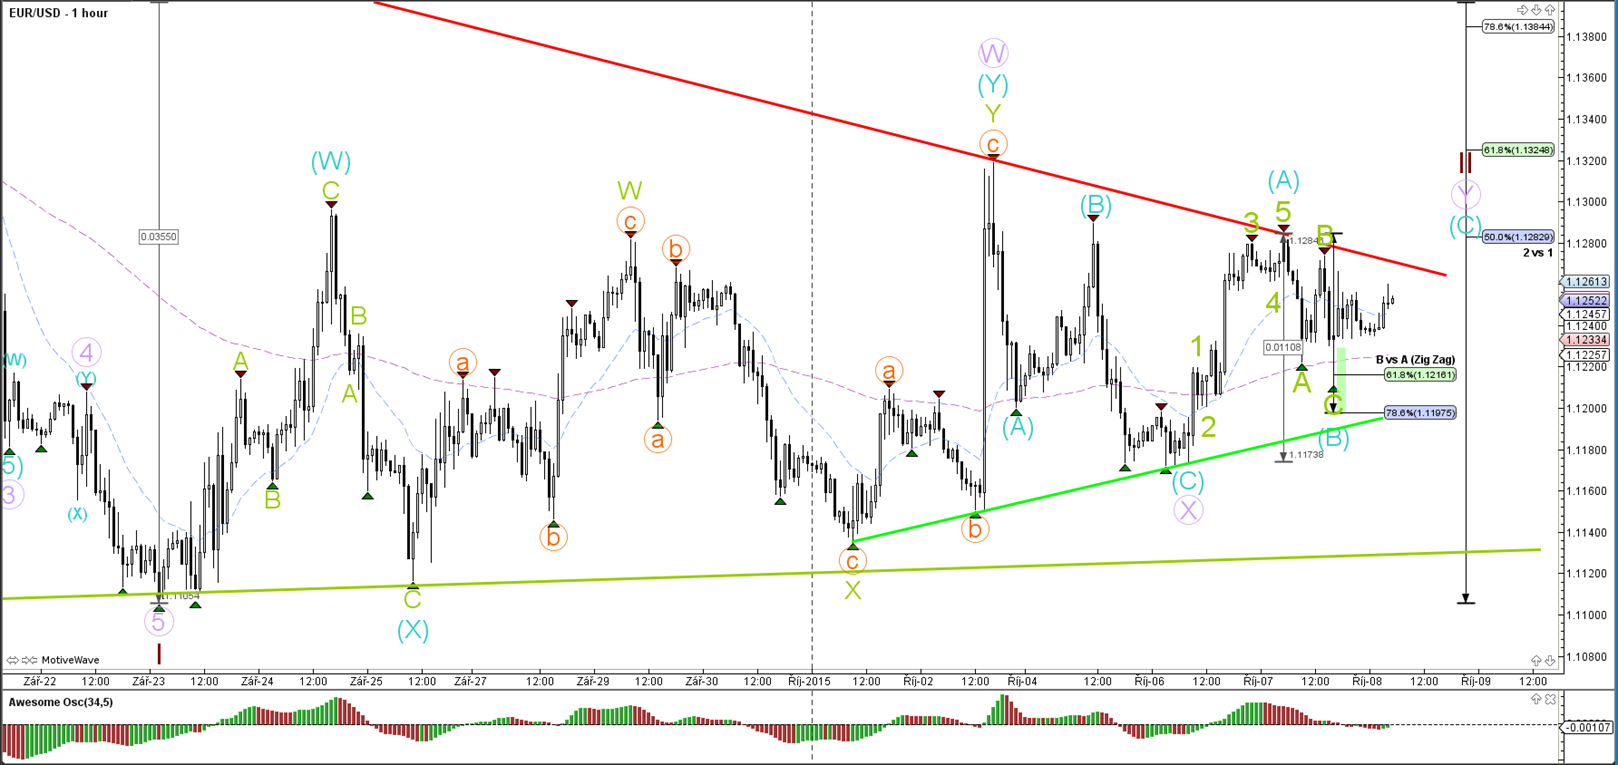
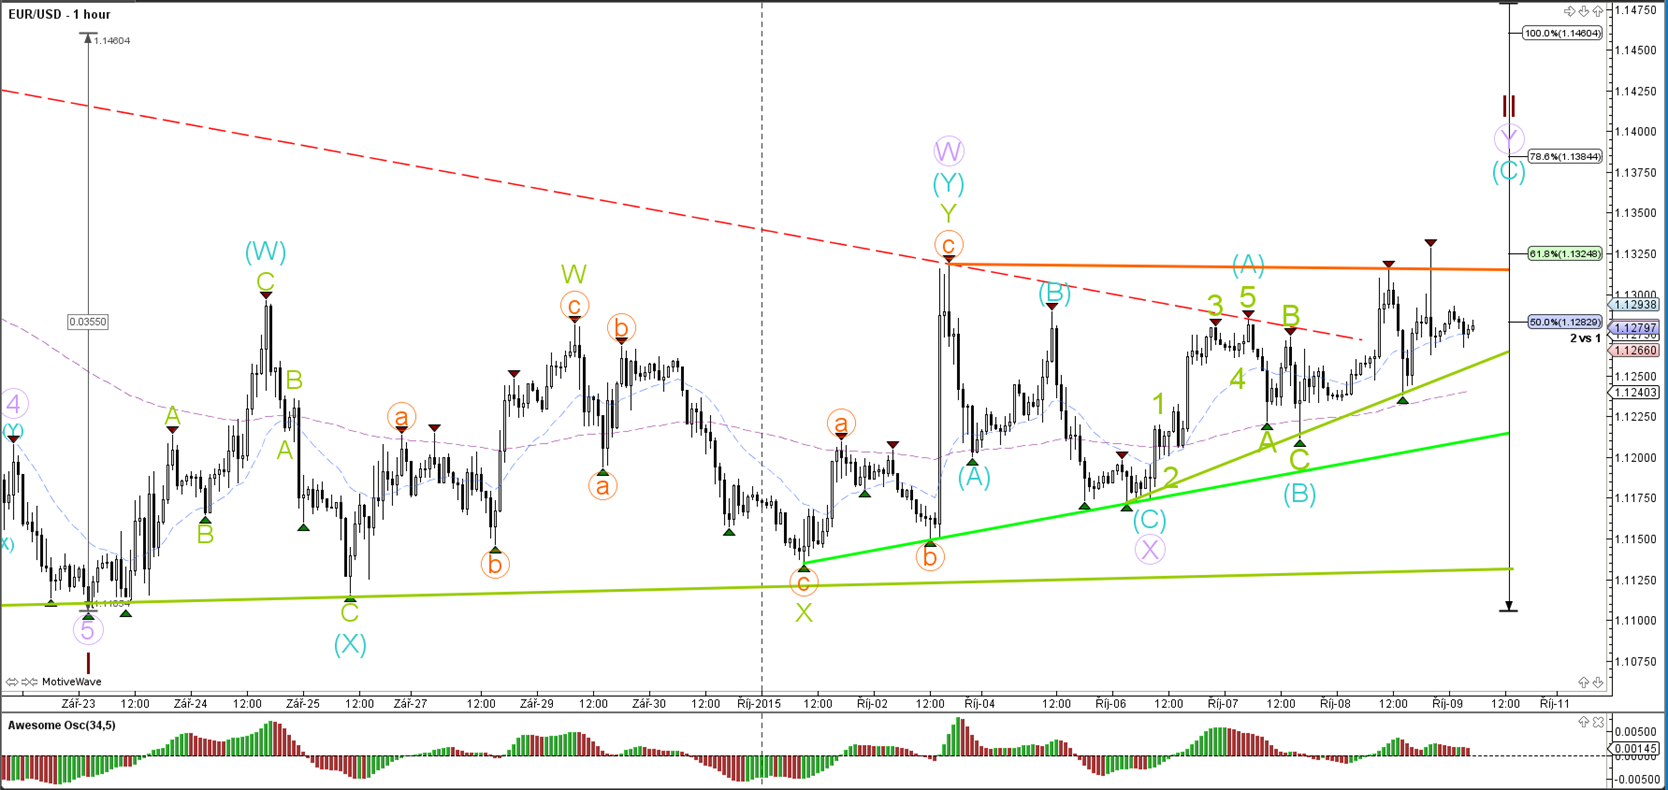
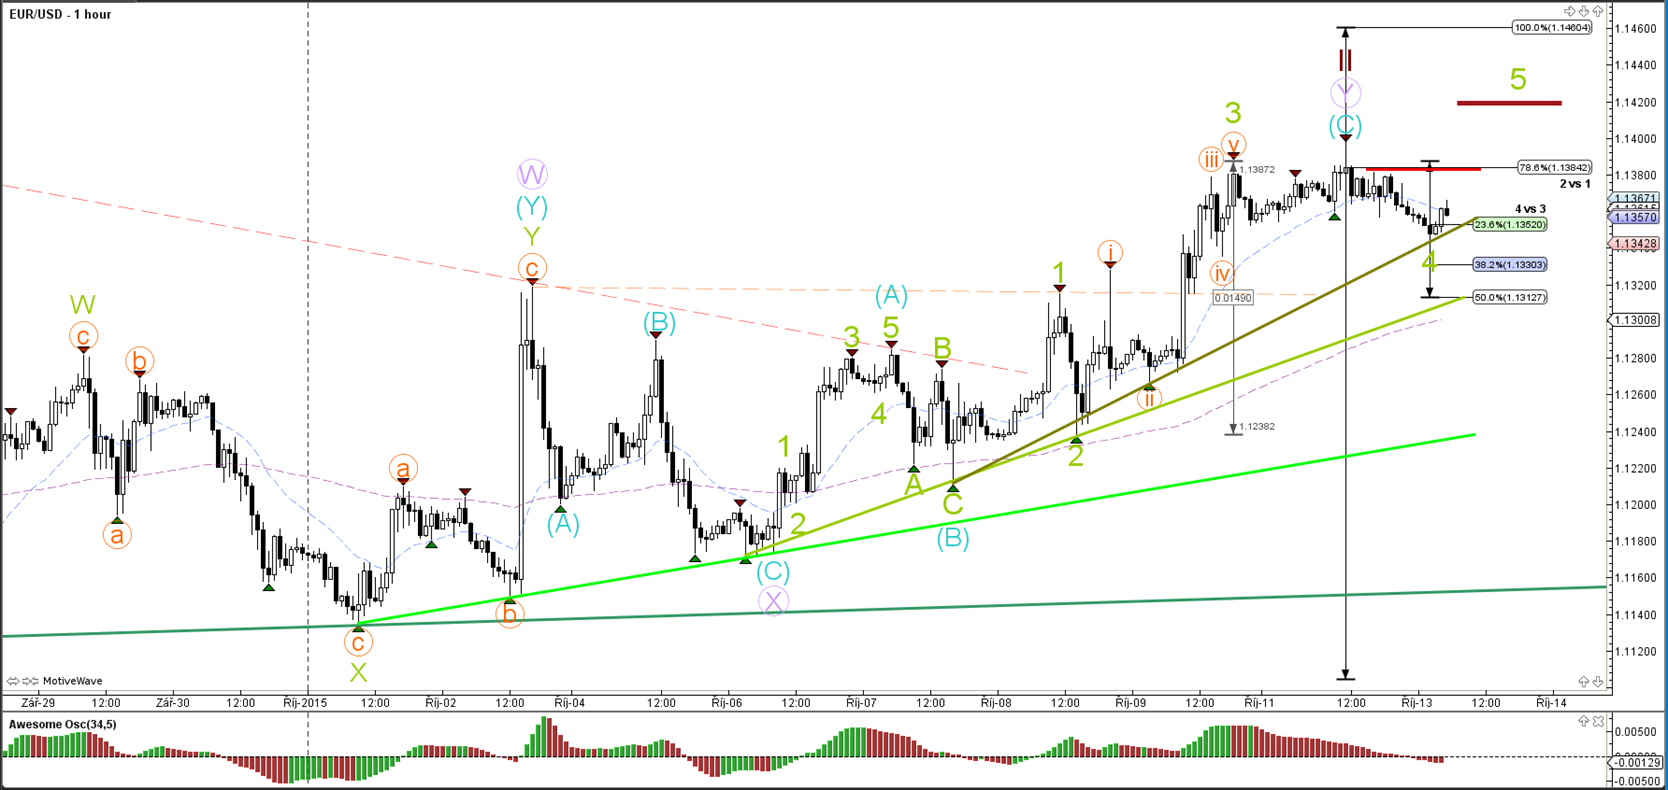
1 hour

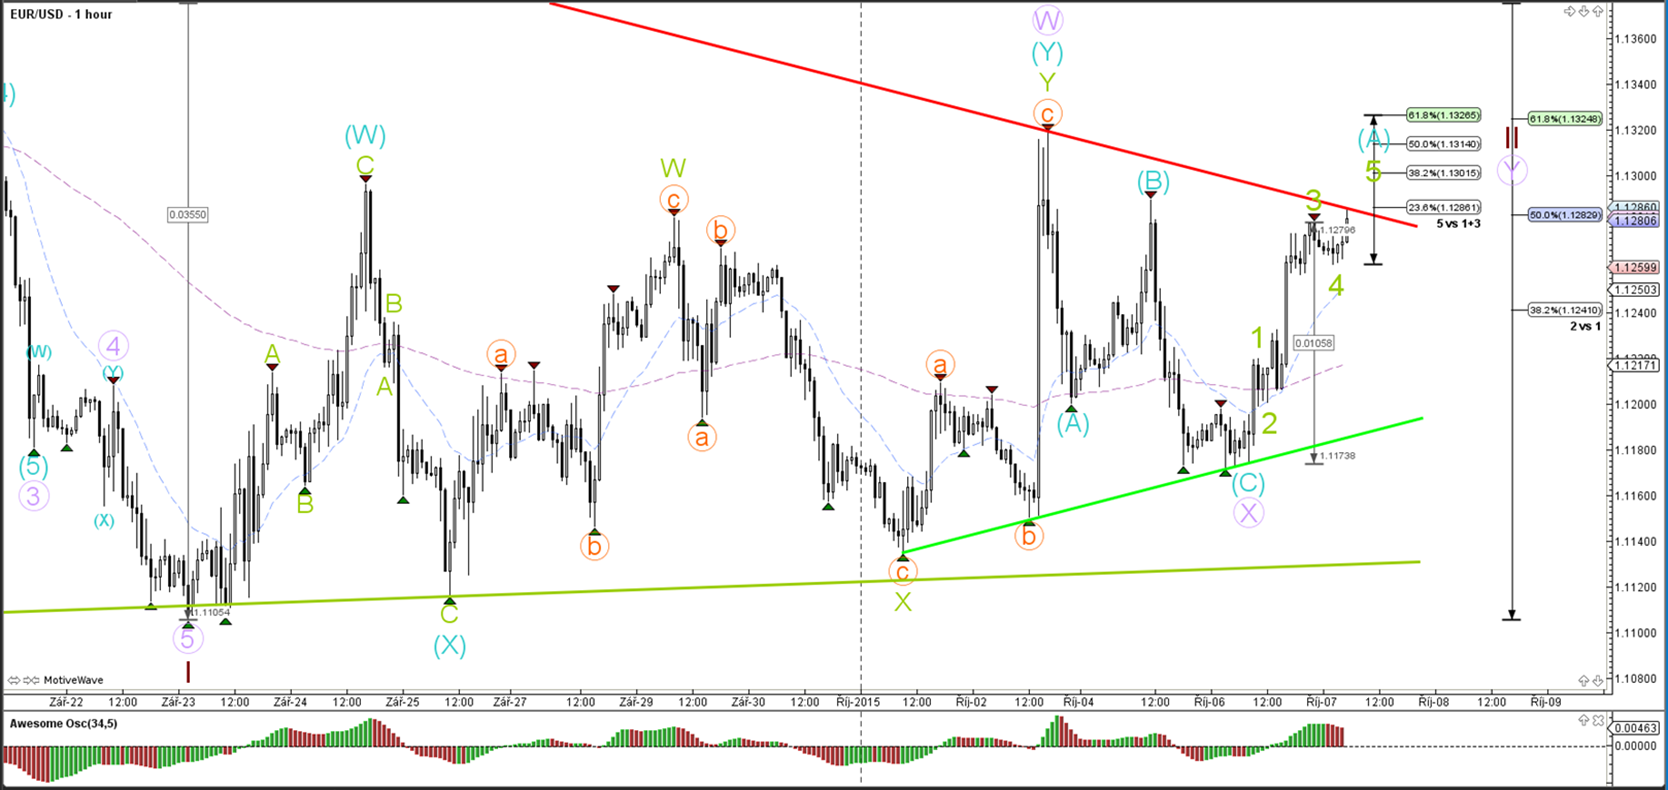
The EUR/USD made a bullish bounce at support (green) as part of the wave B (blue) turn around for a wave C (blue) rally.
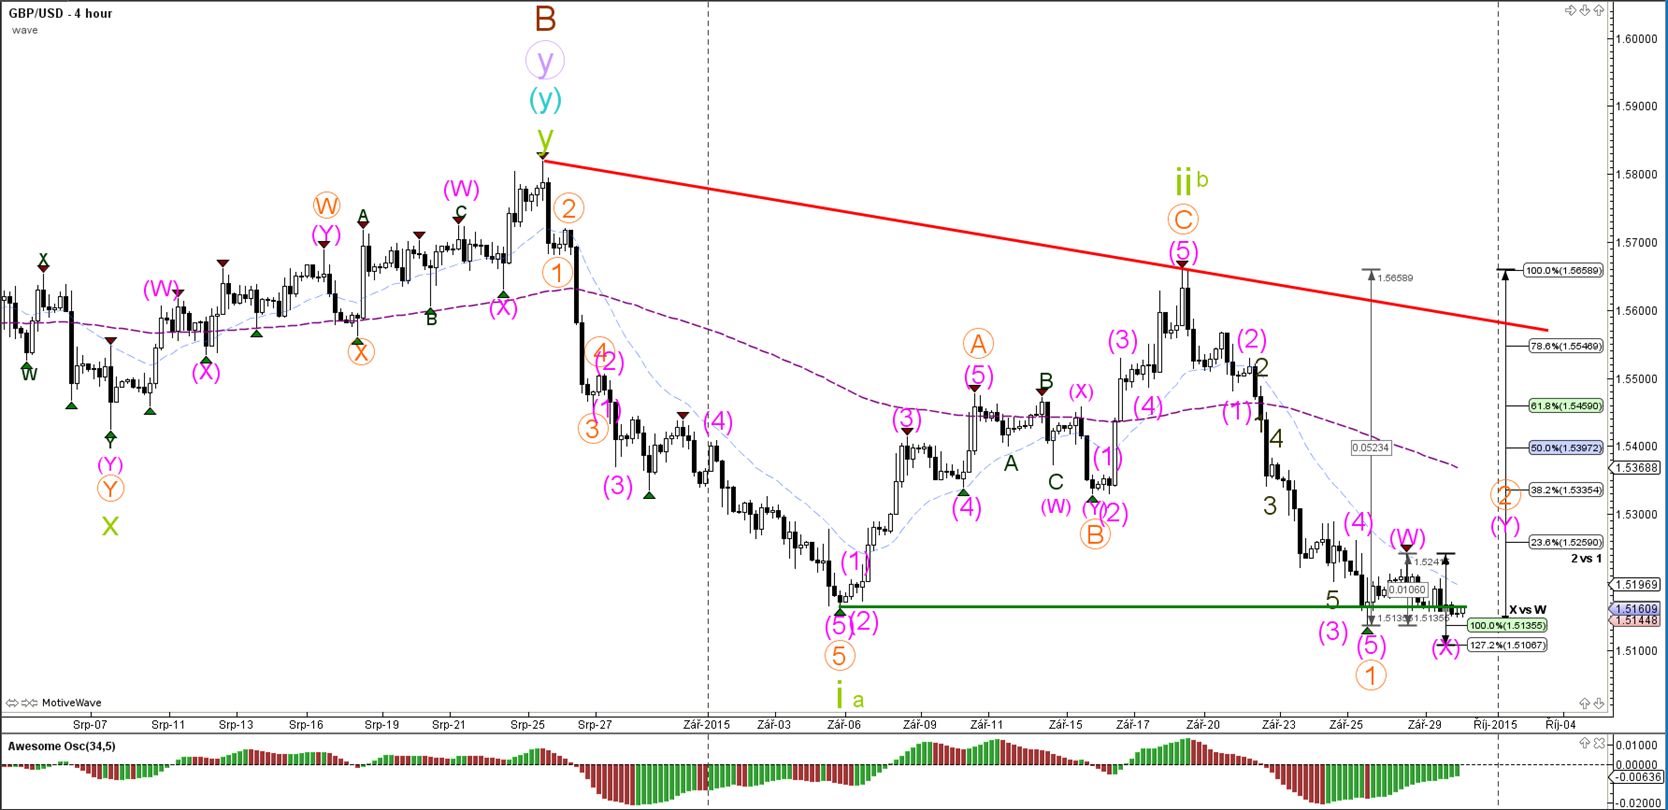
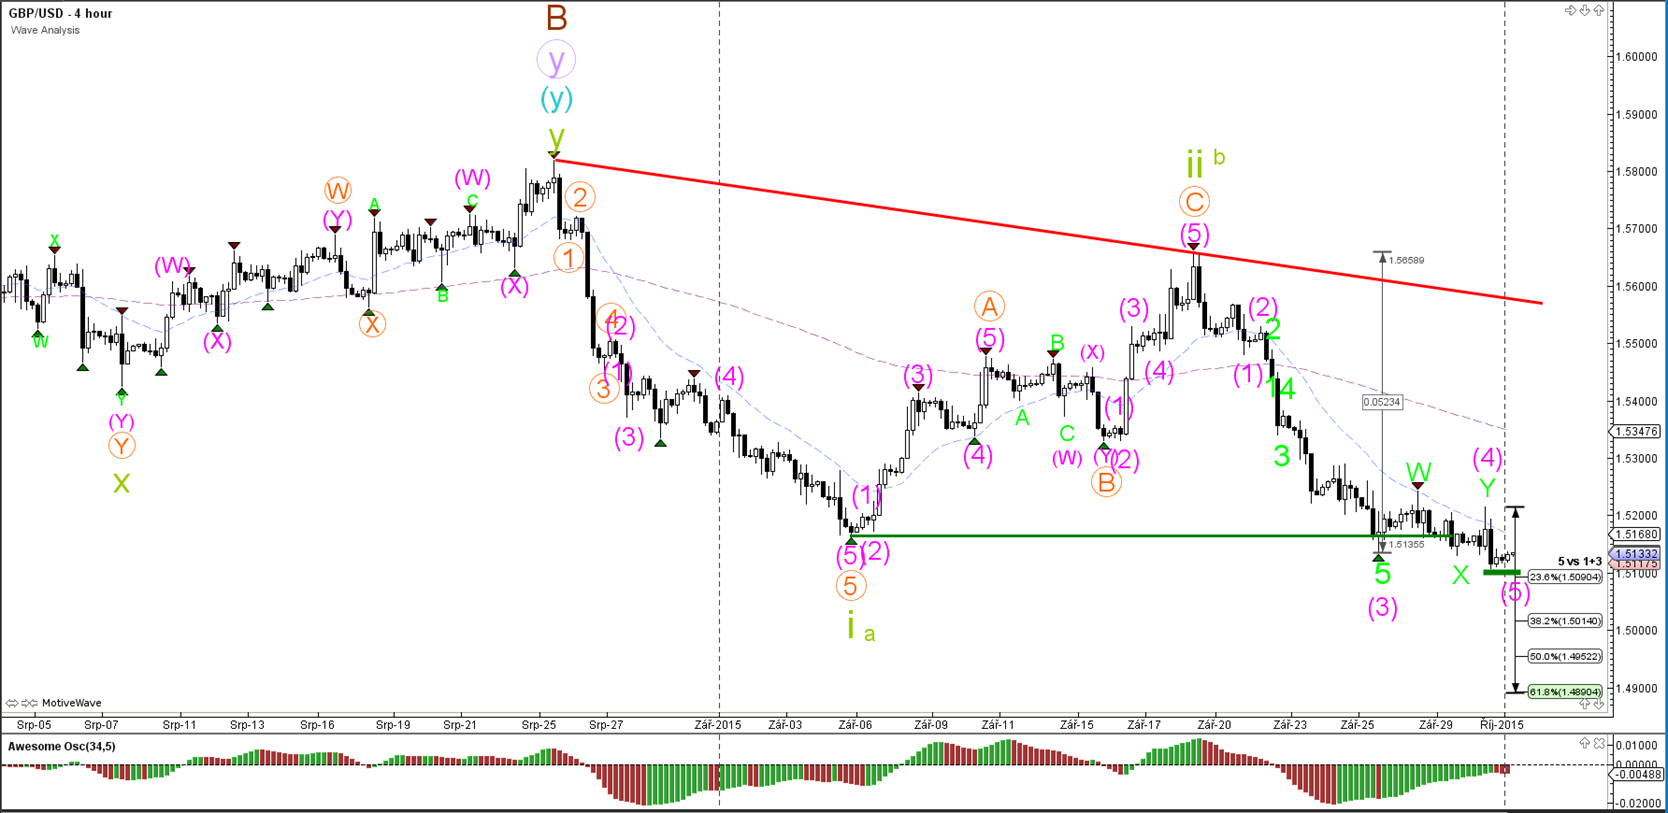
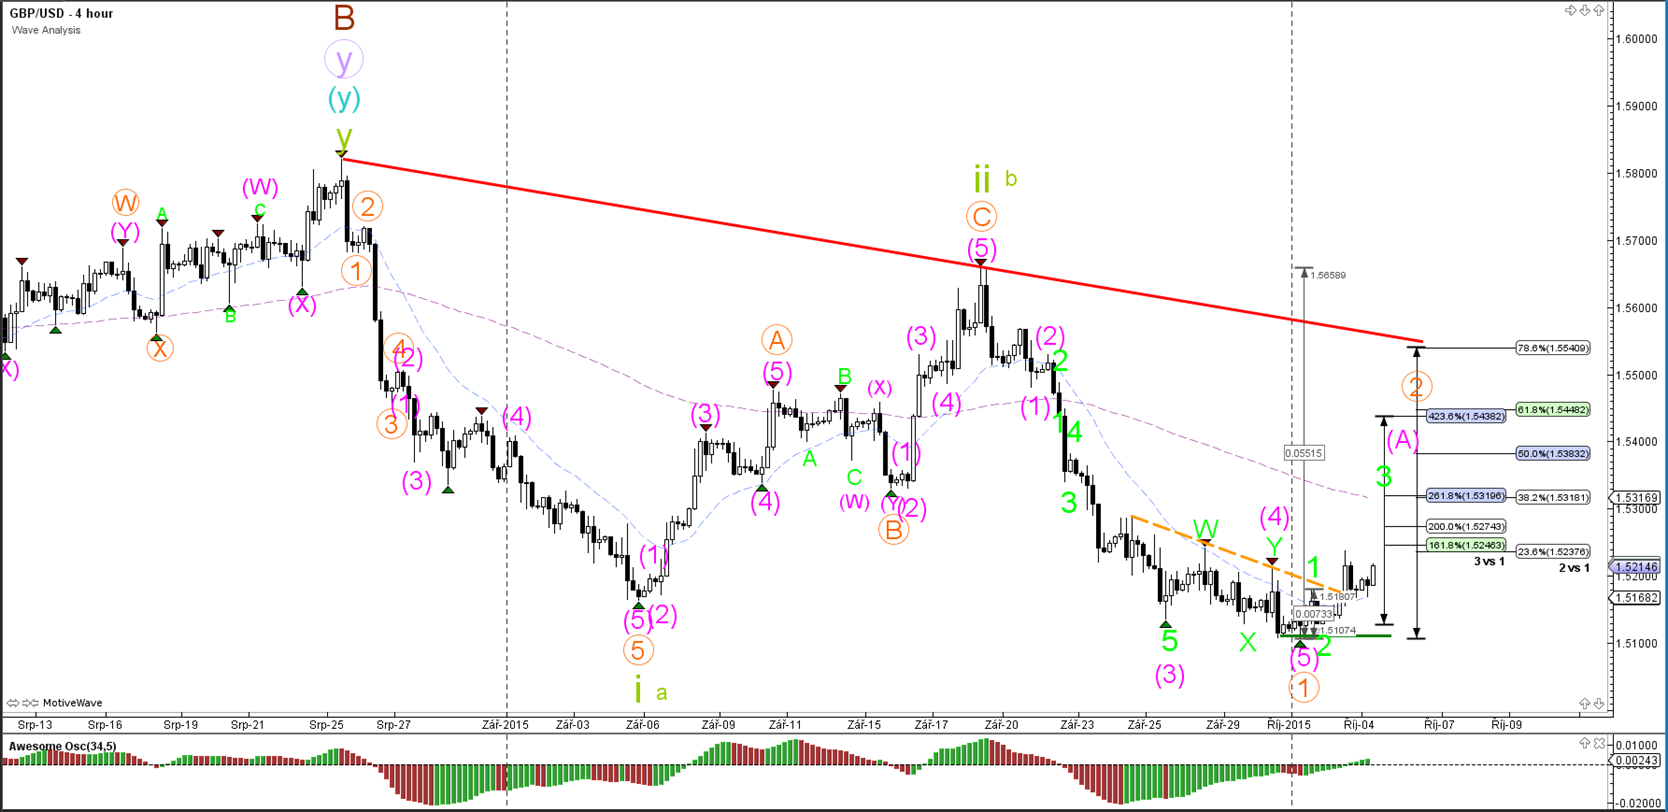
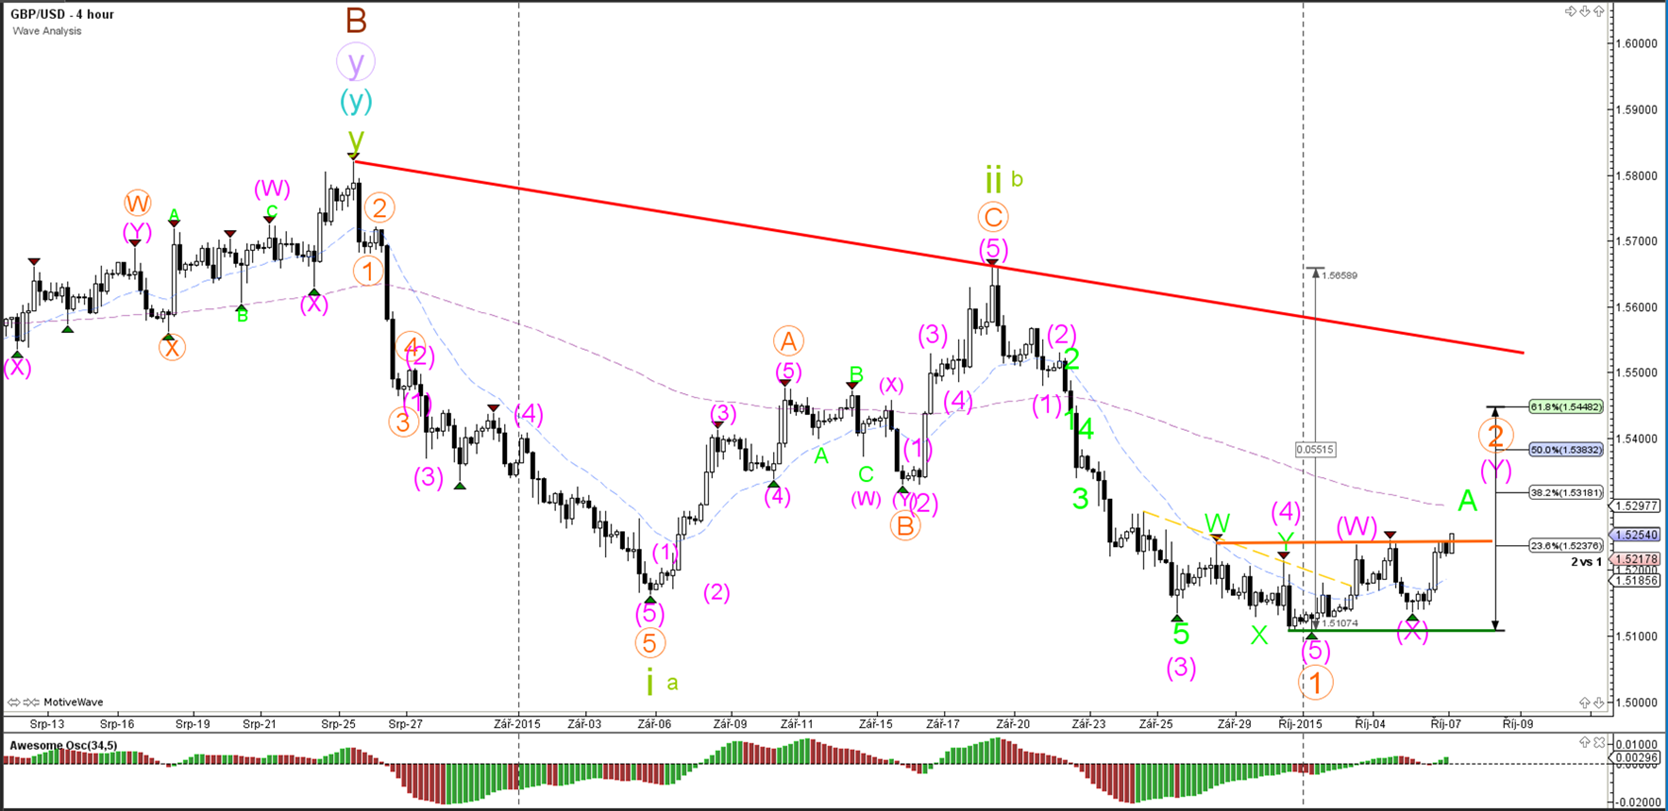
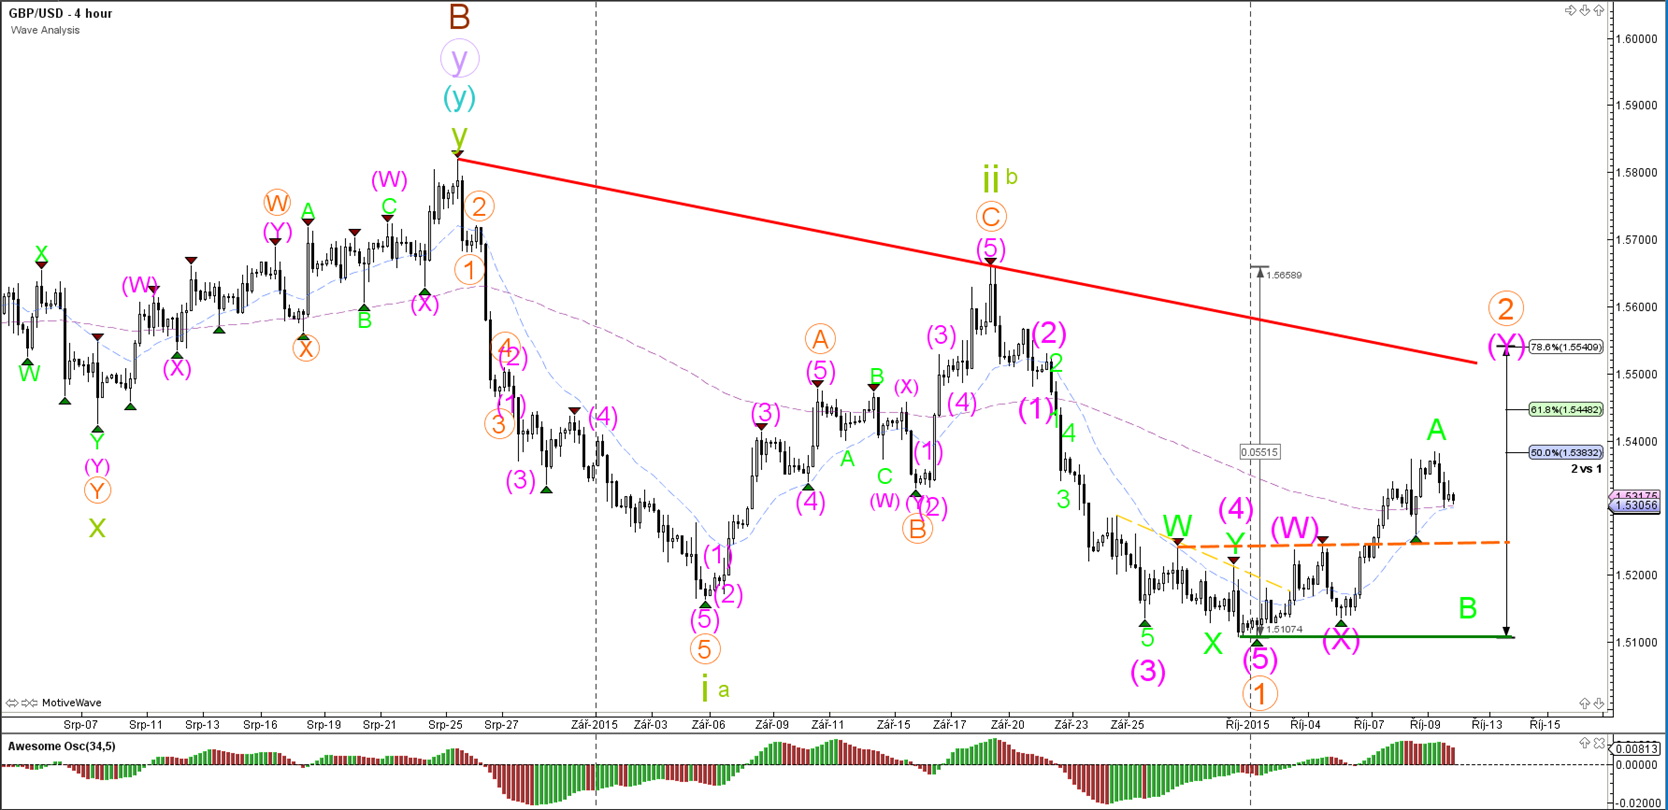
GBP/USD
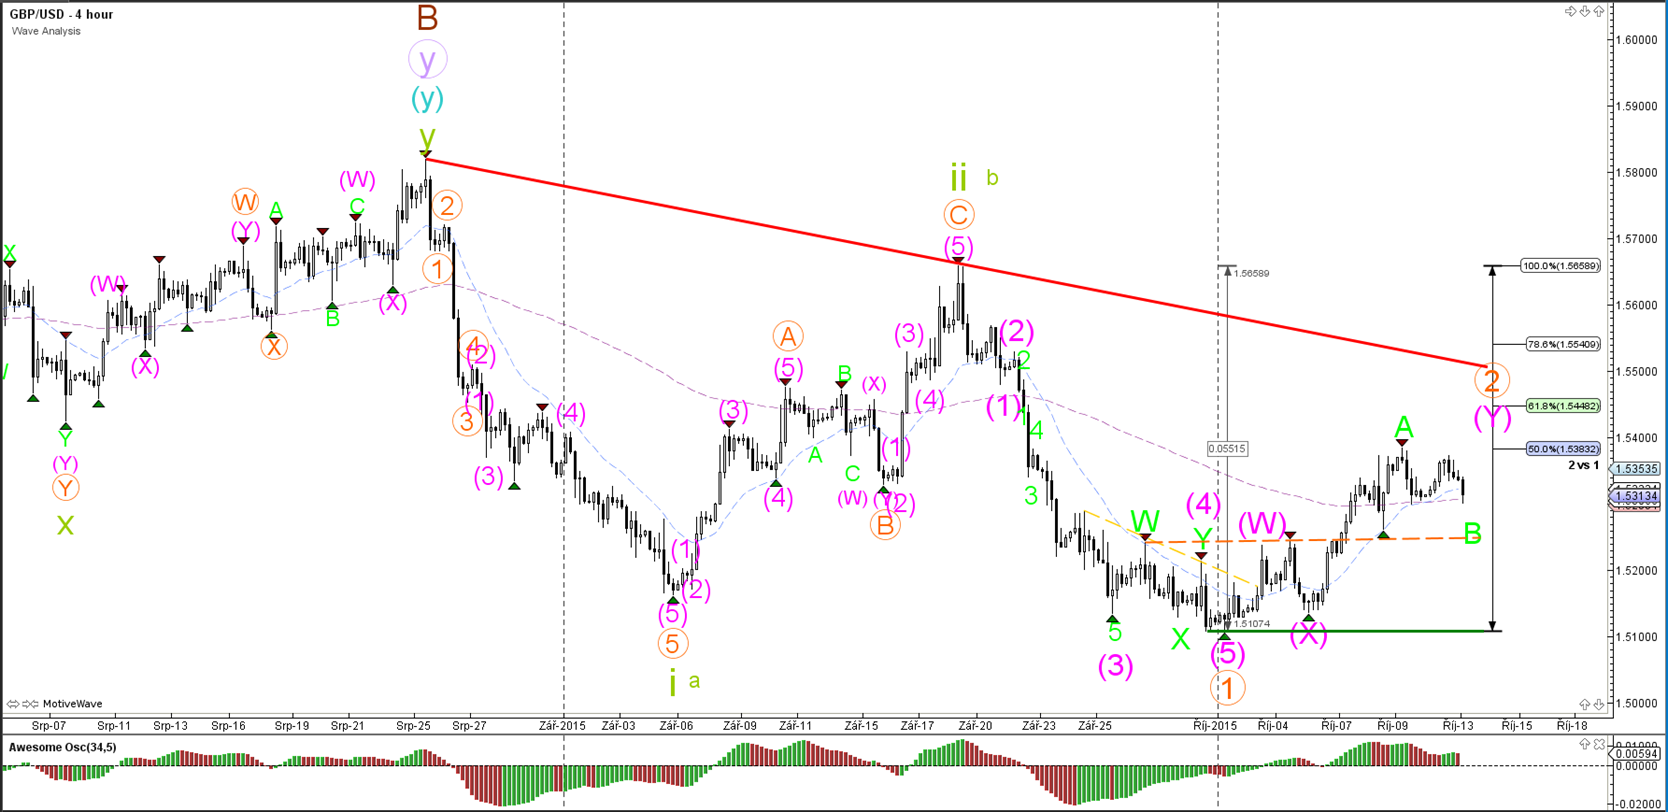
4 hour
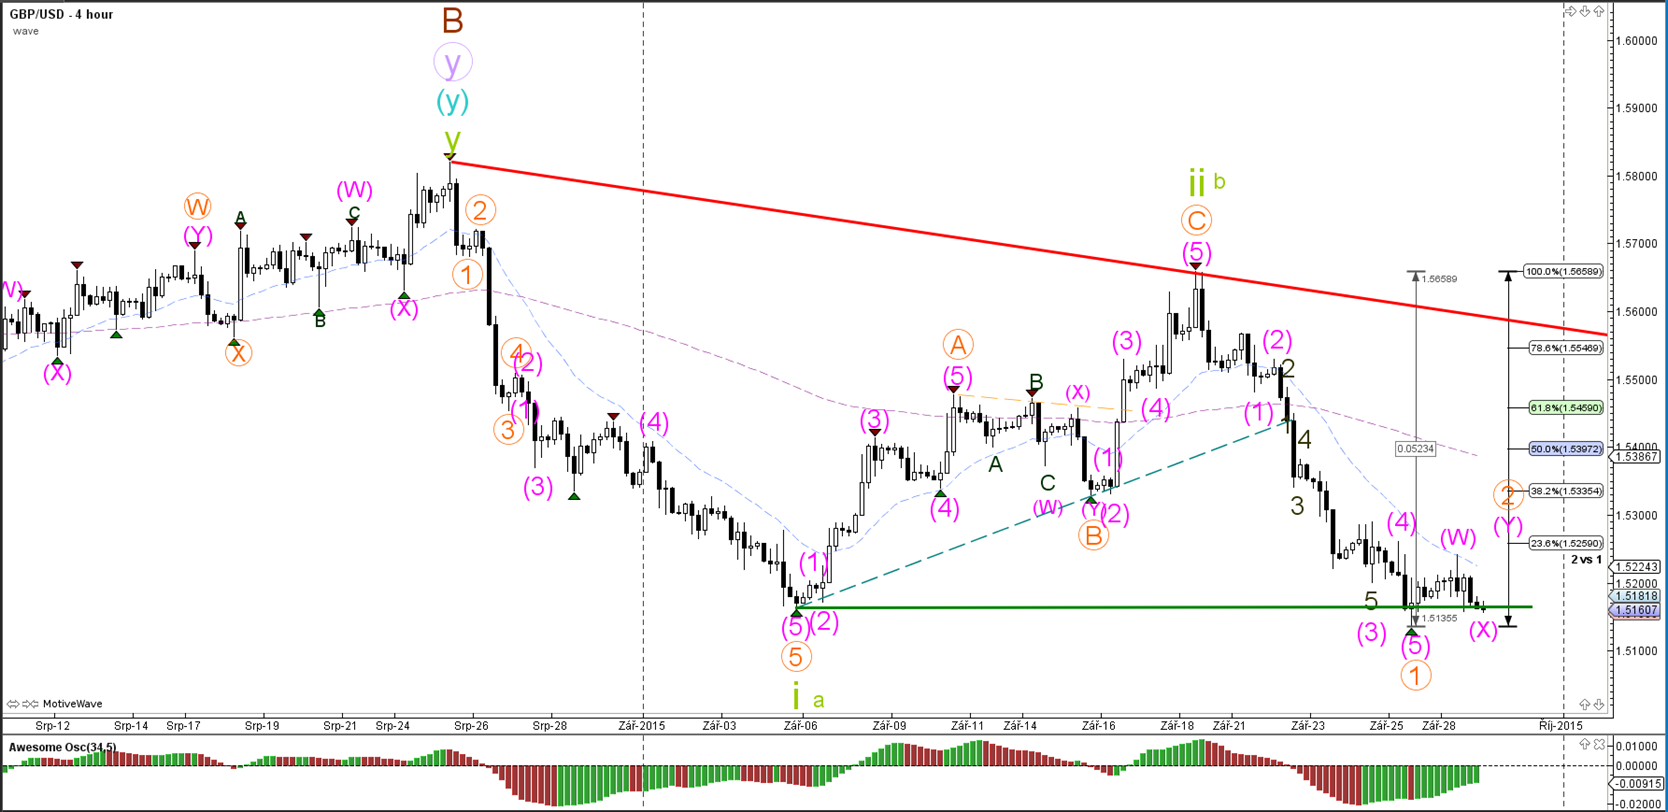
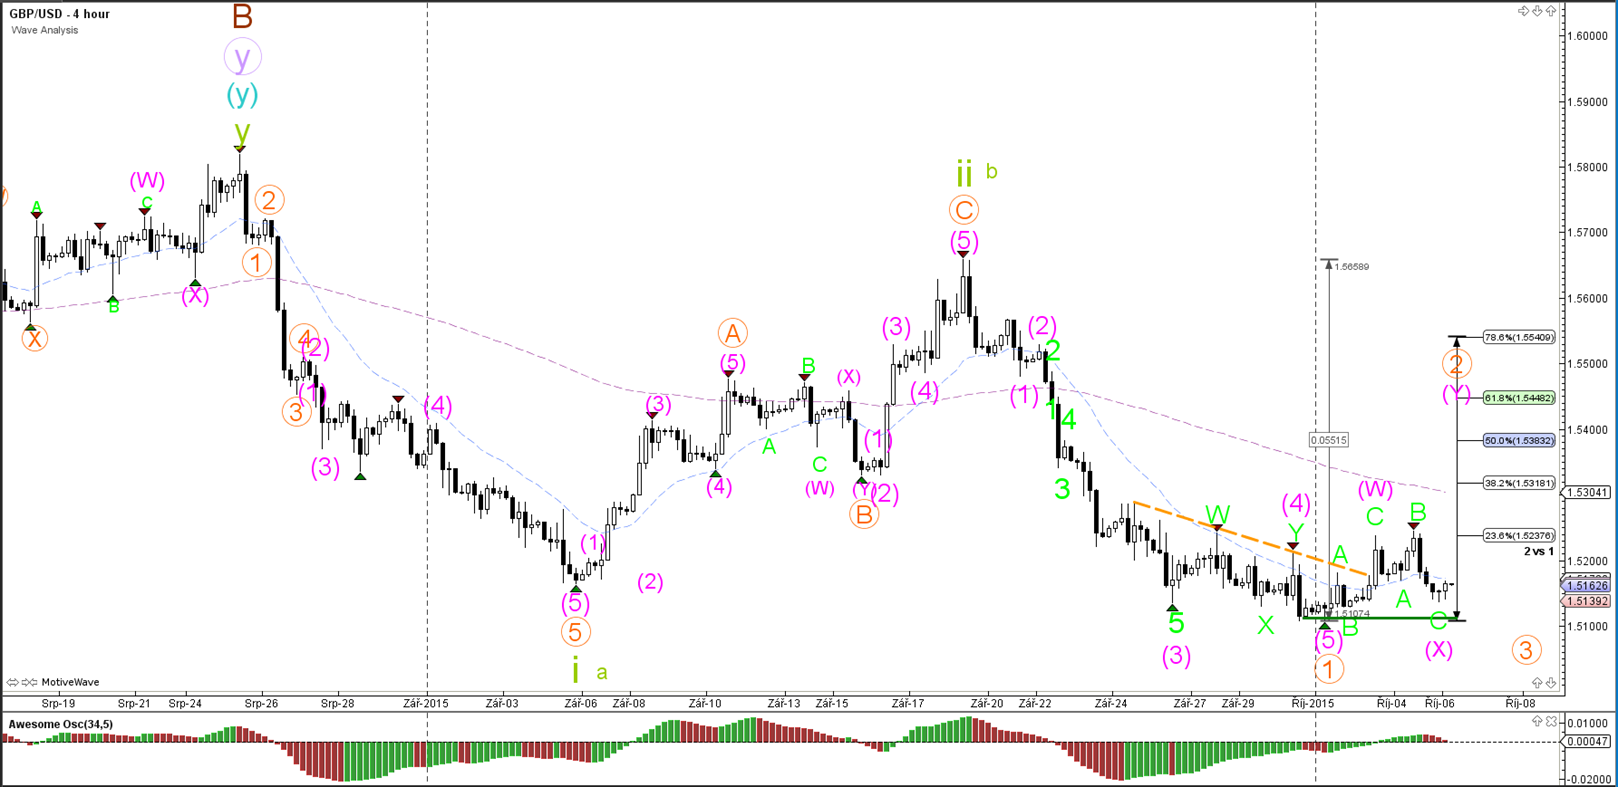
The GBP/USD is approaching the bottom support (green), which is a bounce or break spot. The current wave count is leaning towards a bounce as part of a WXY (pink) correction within wave 2 (orange).
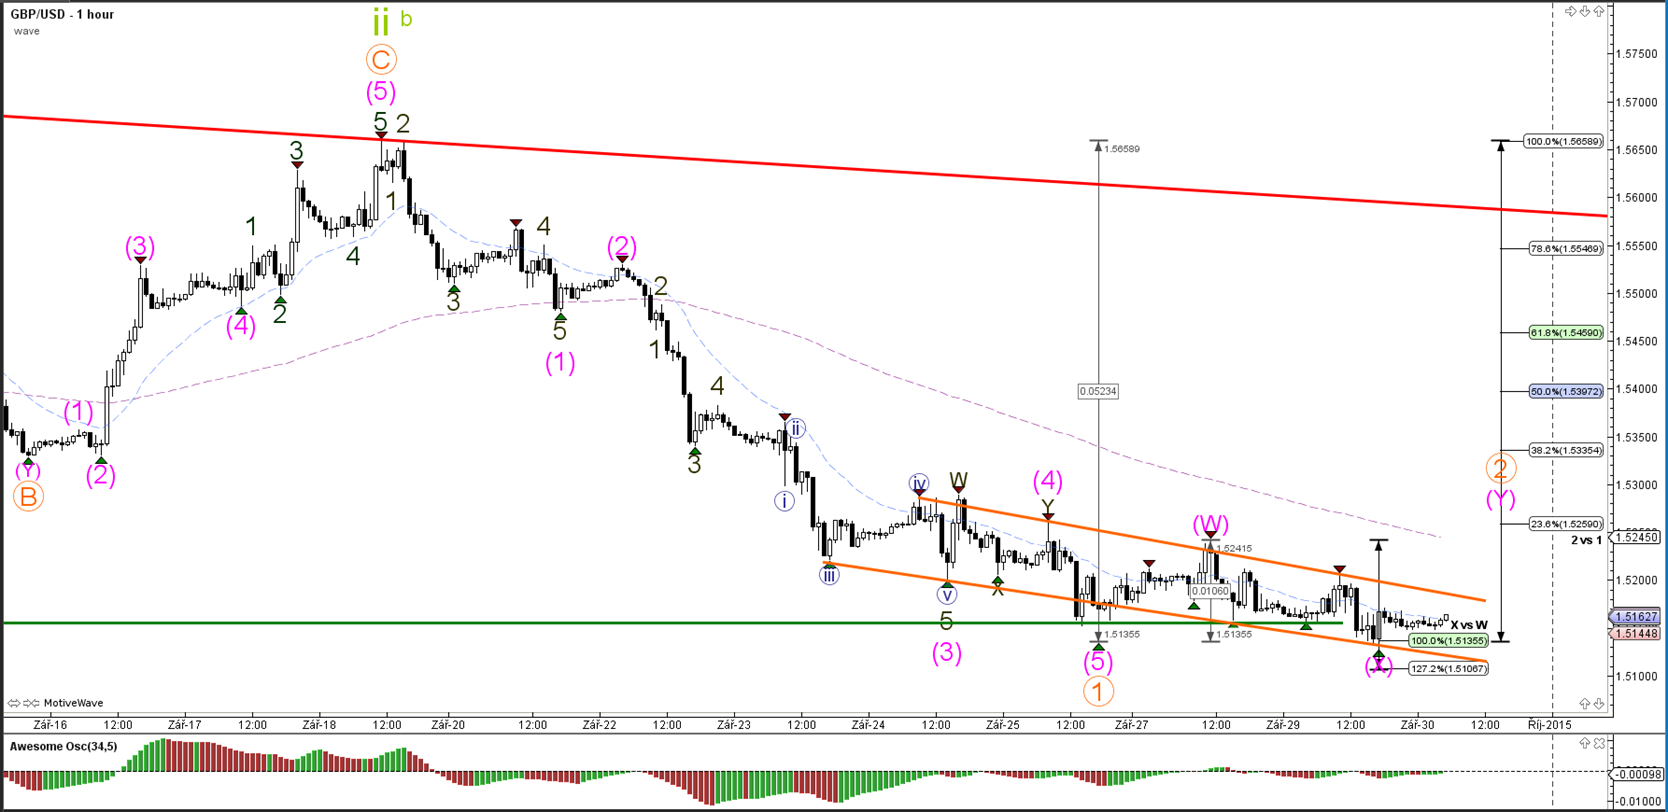
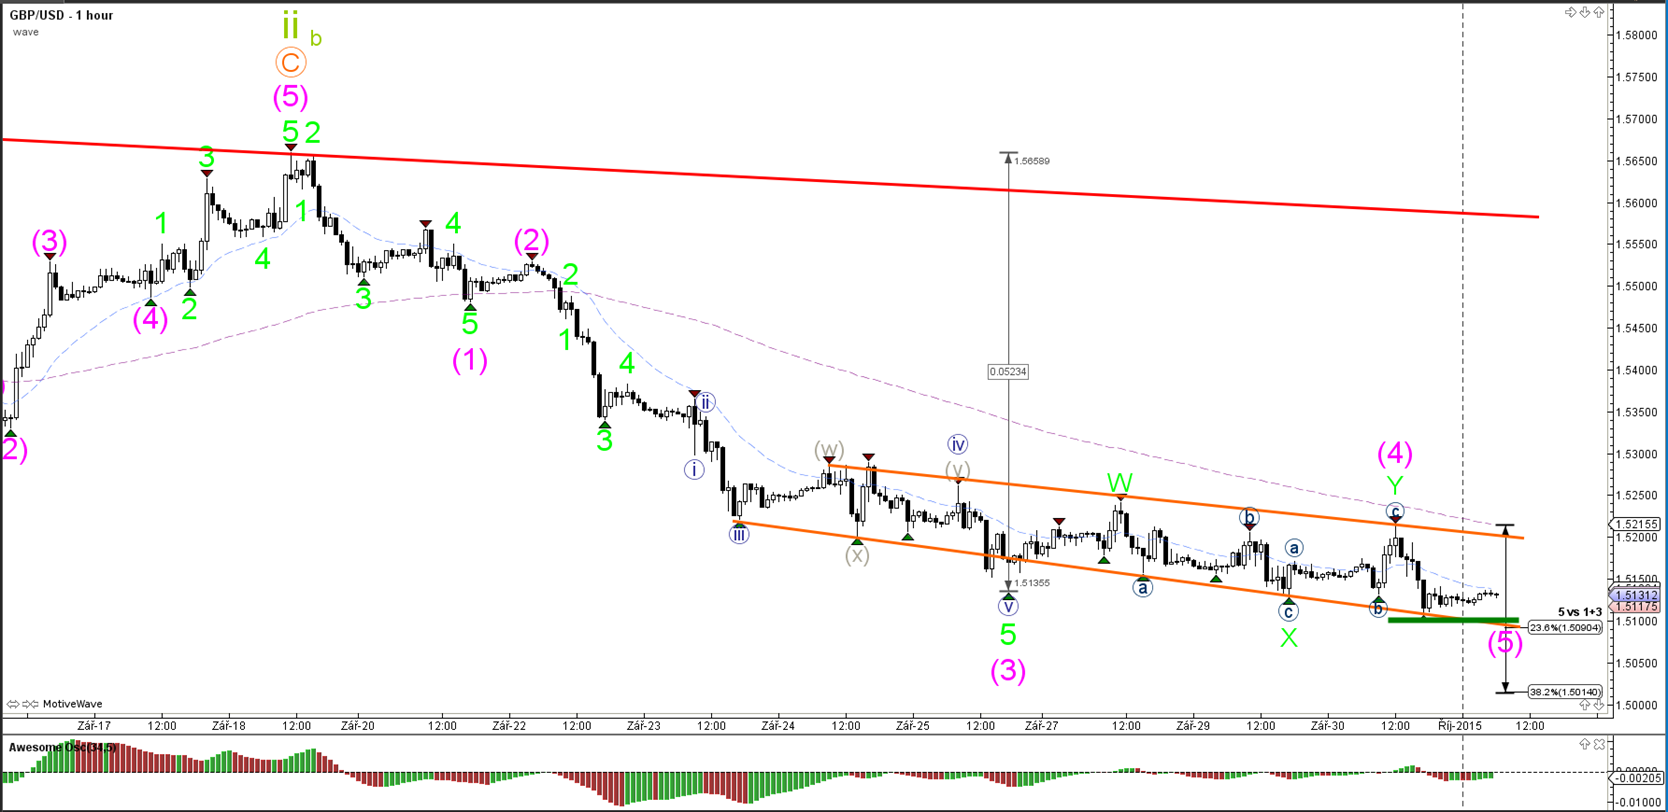
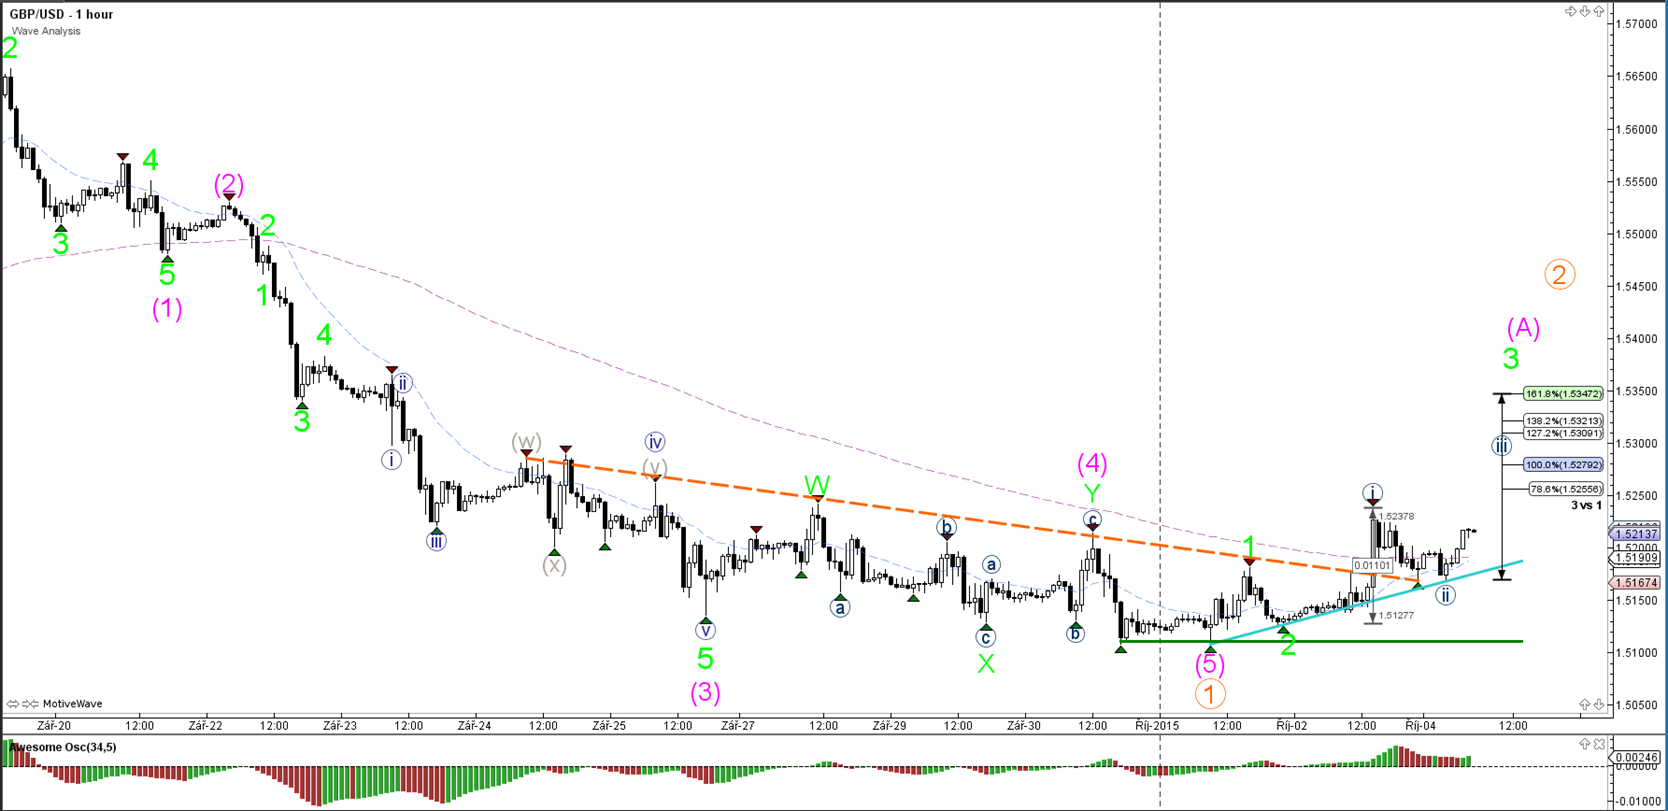
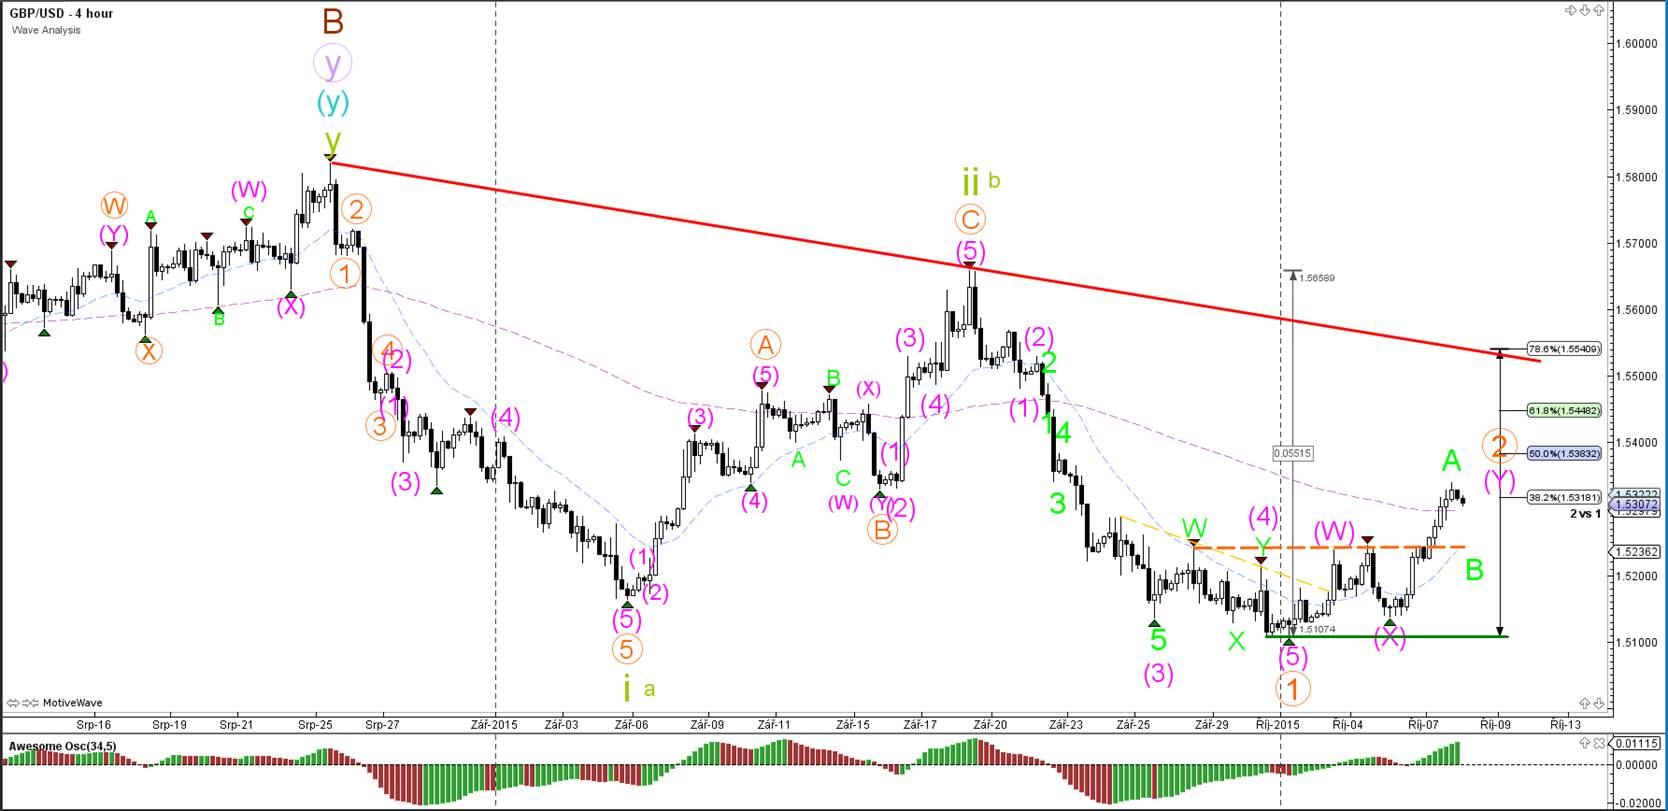
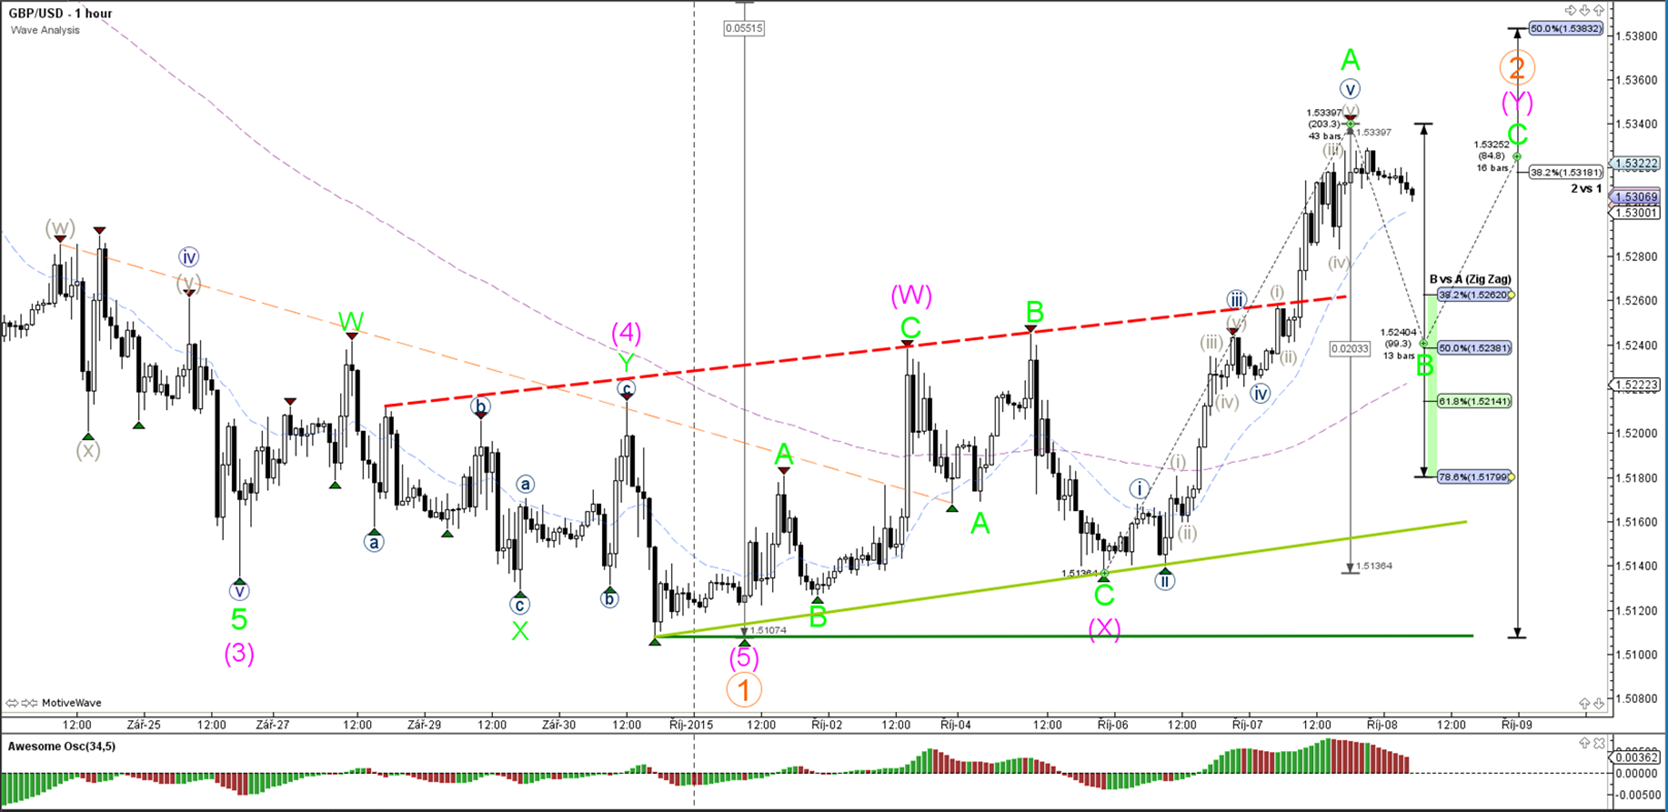
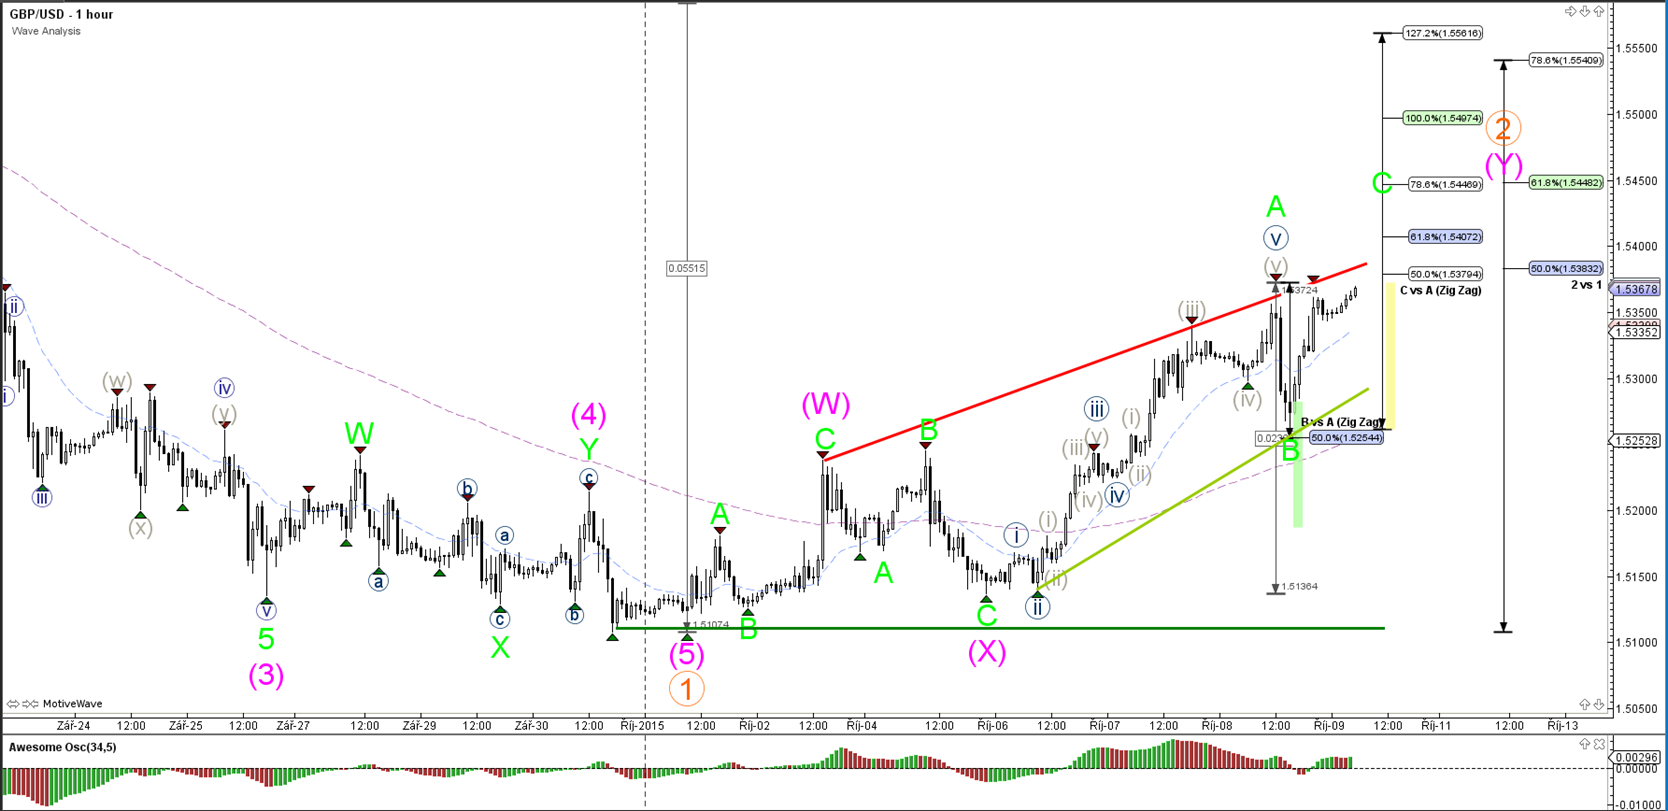
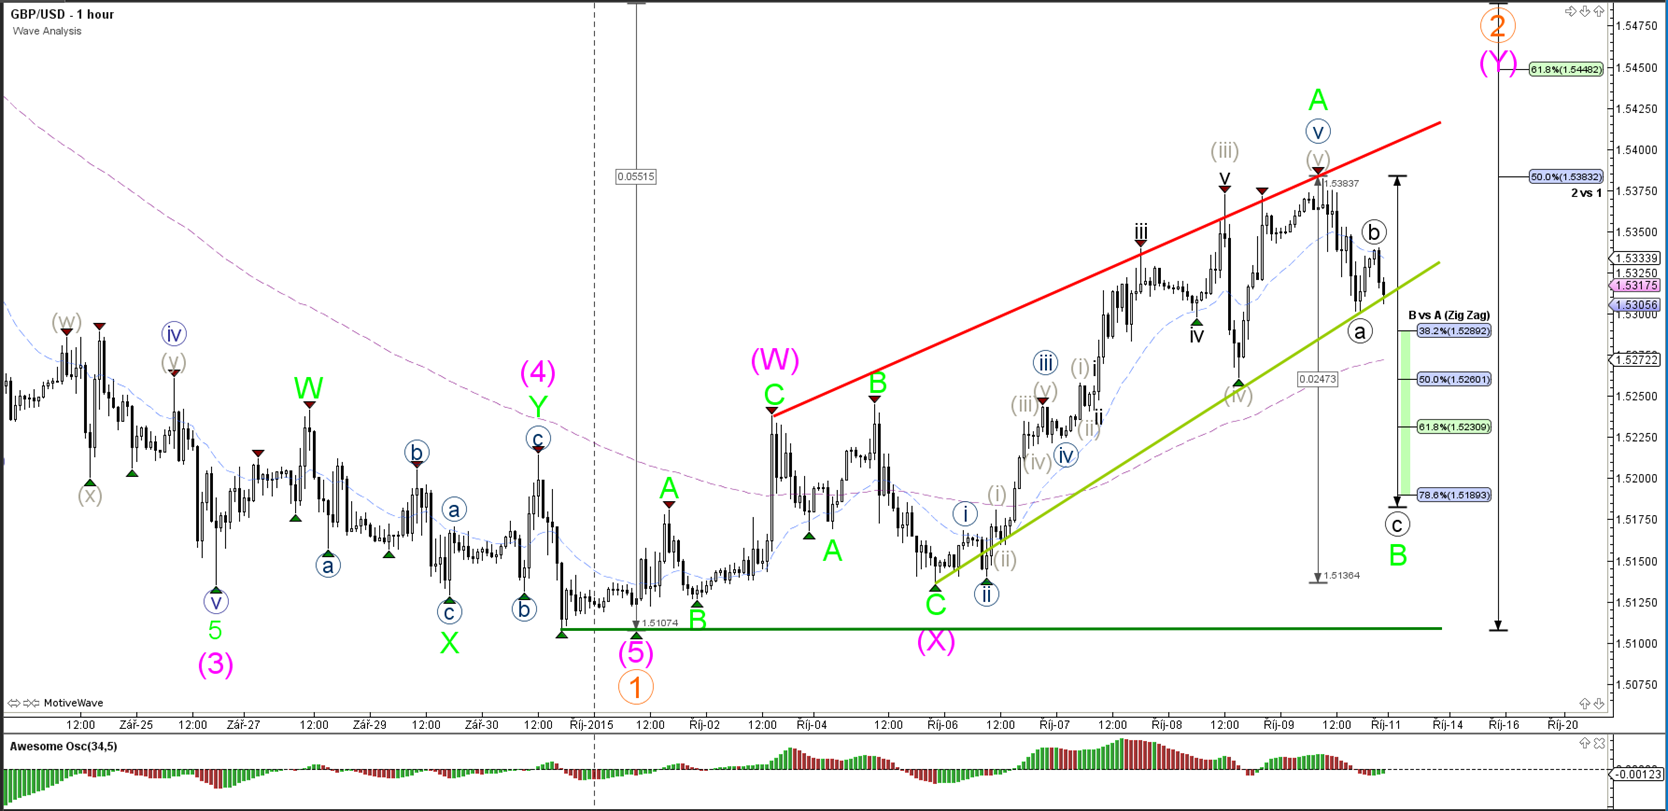
1 hour
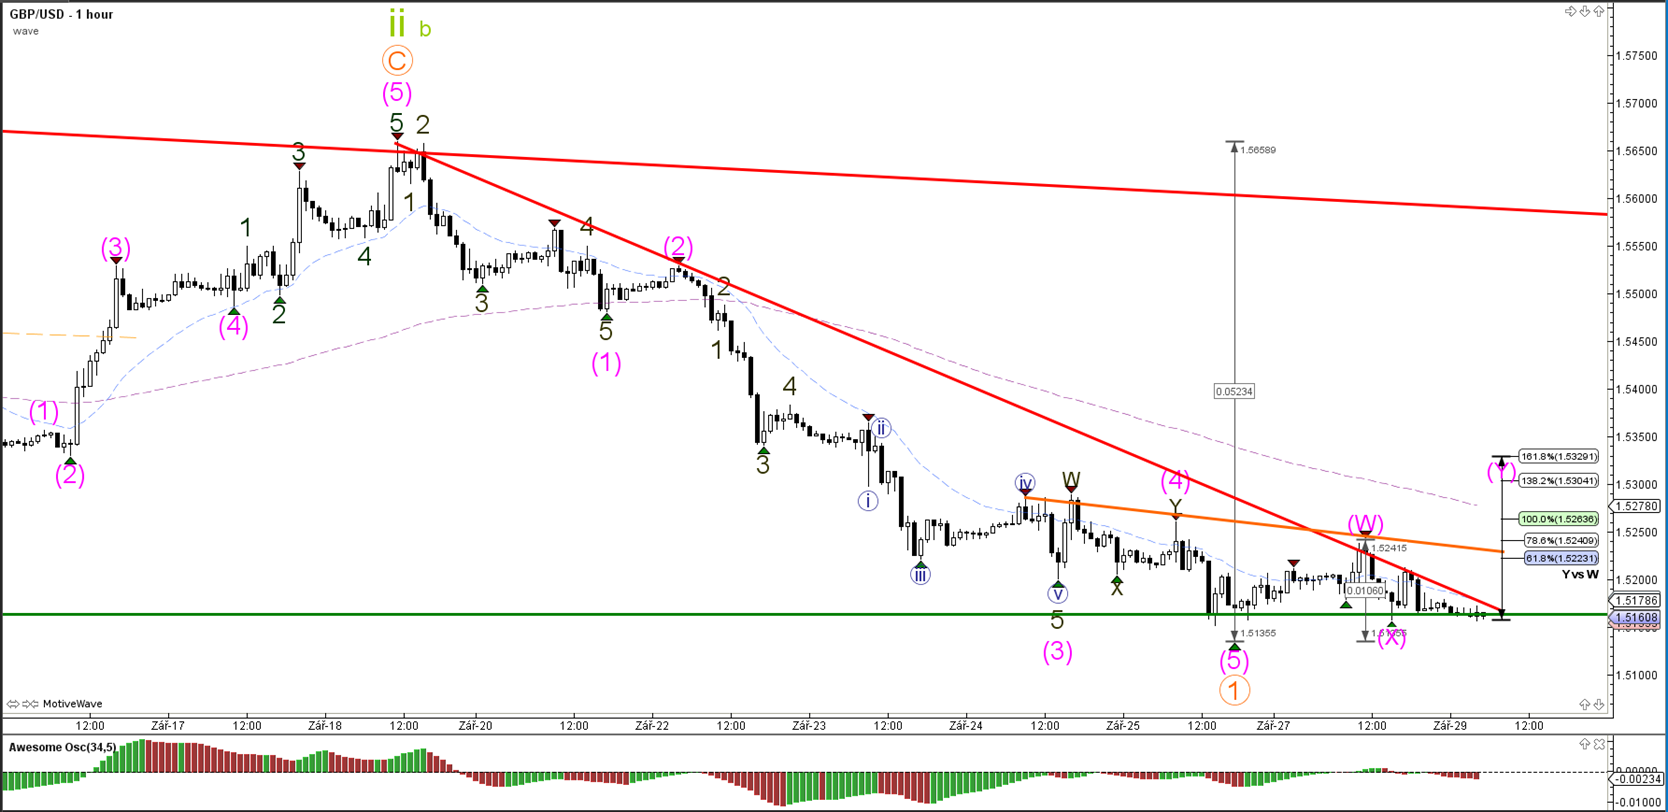
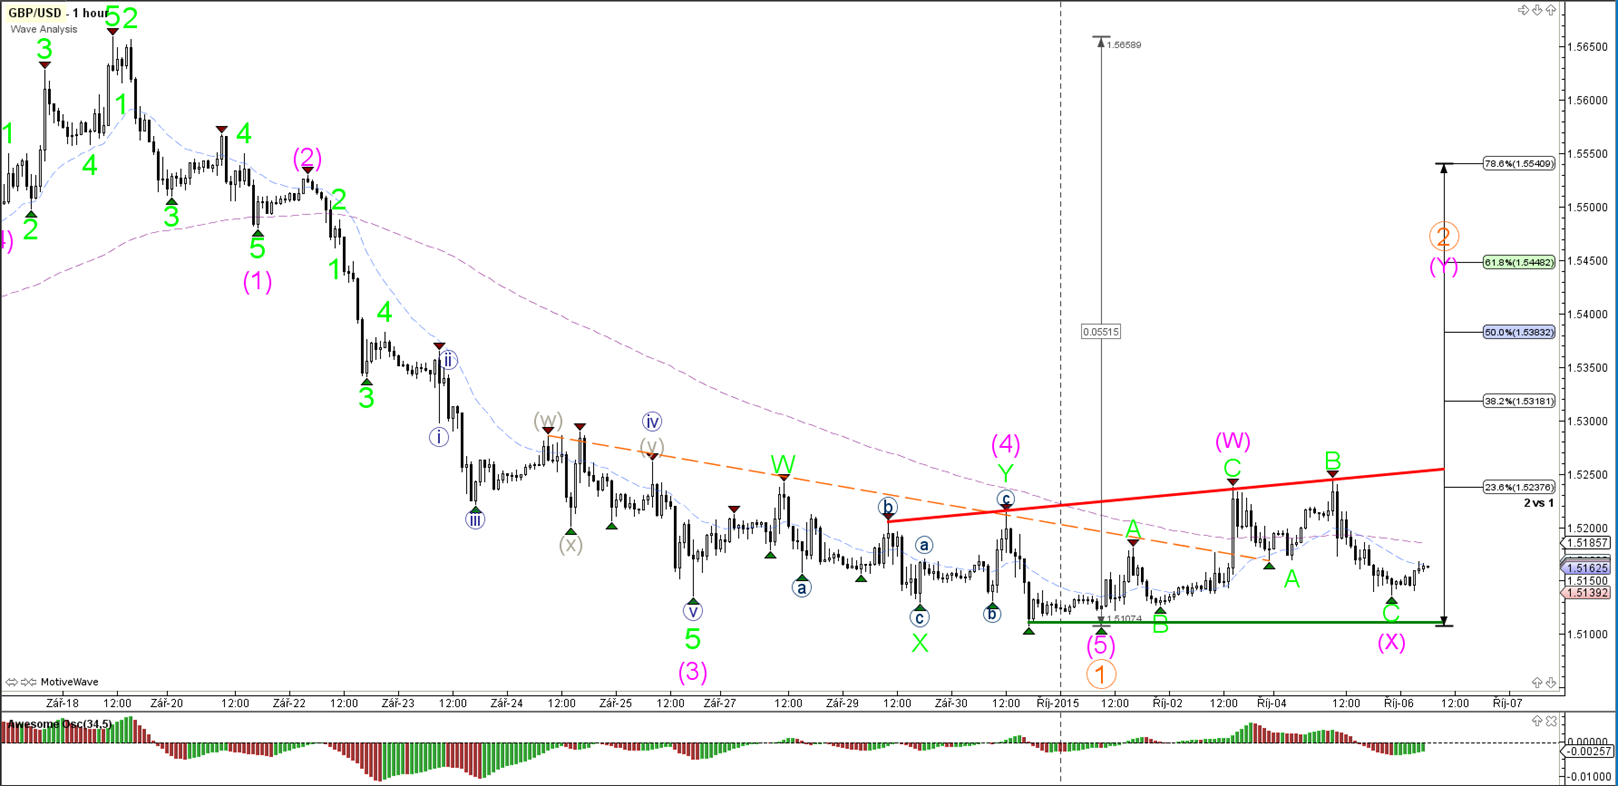
The GBP/USD is retesting the support level (green) for the 3rd time. A break below or above the lines could indicate the short-term direction.
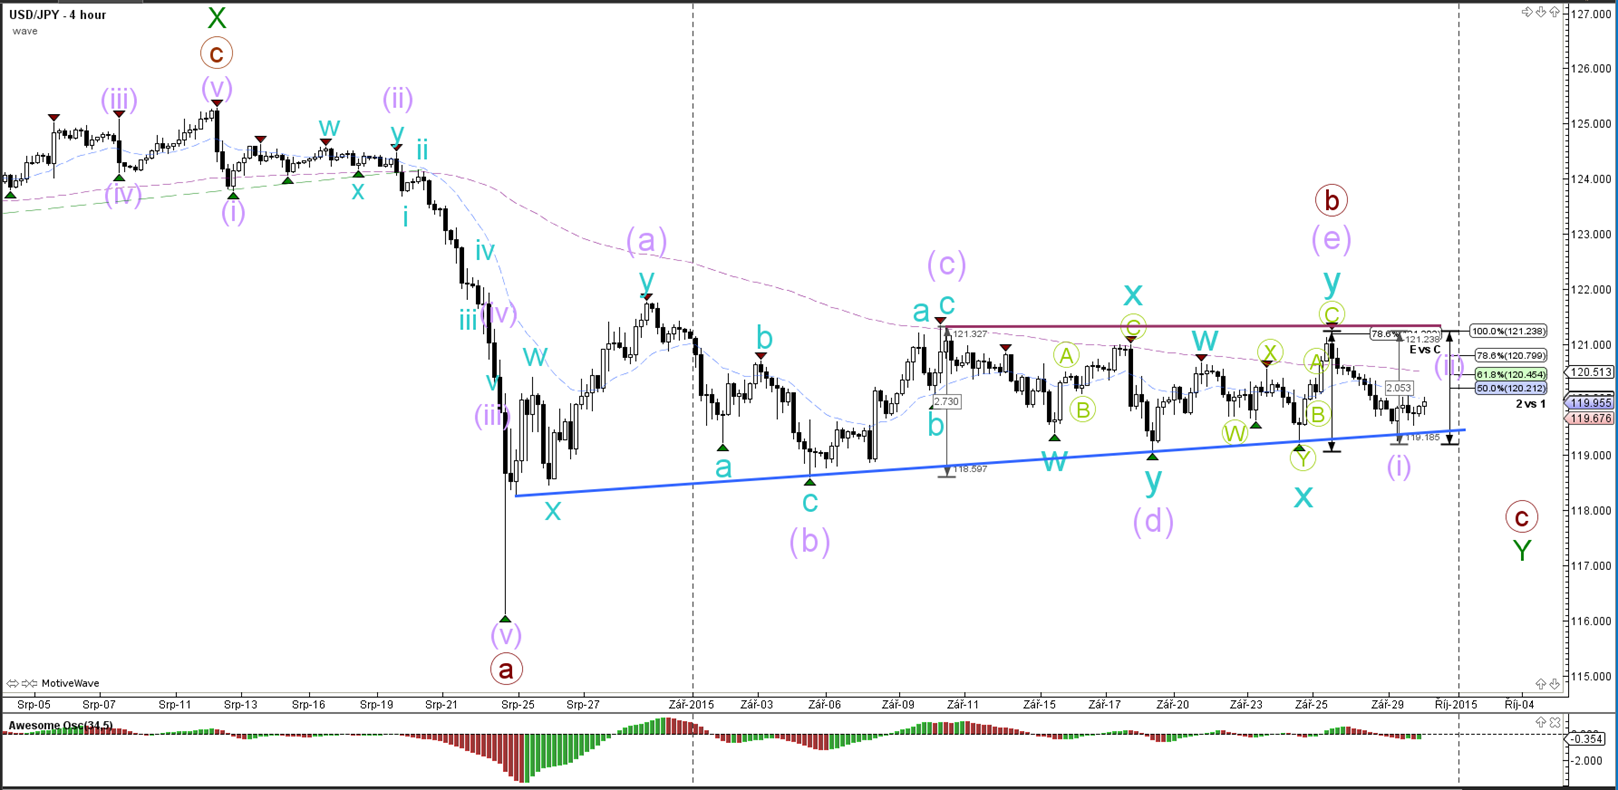
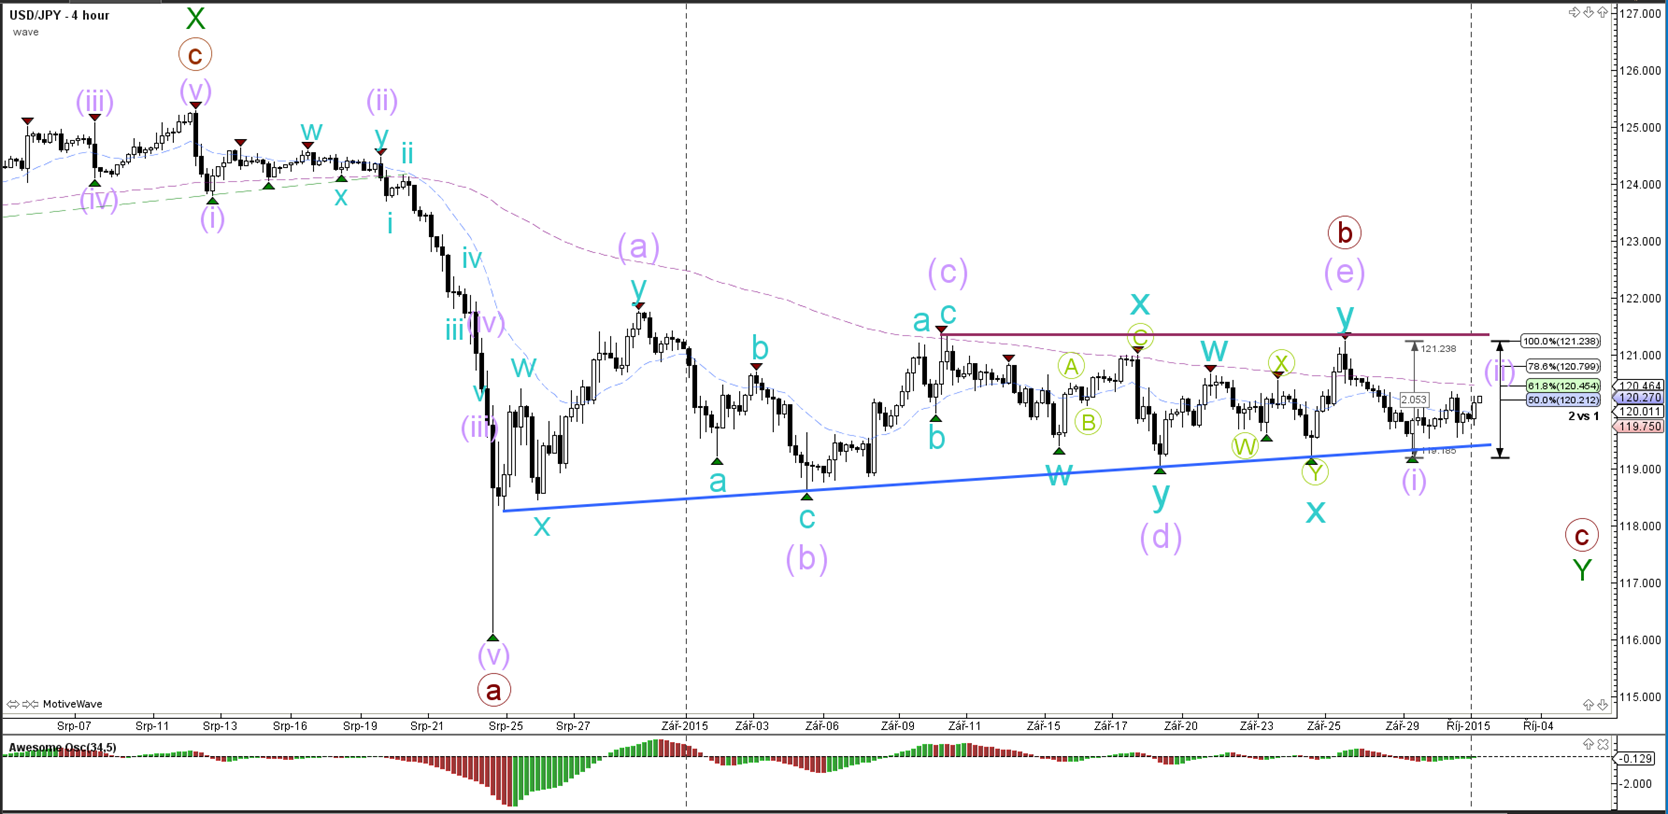
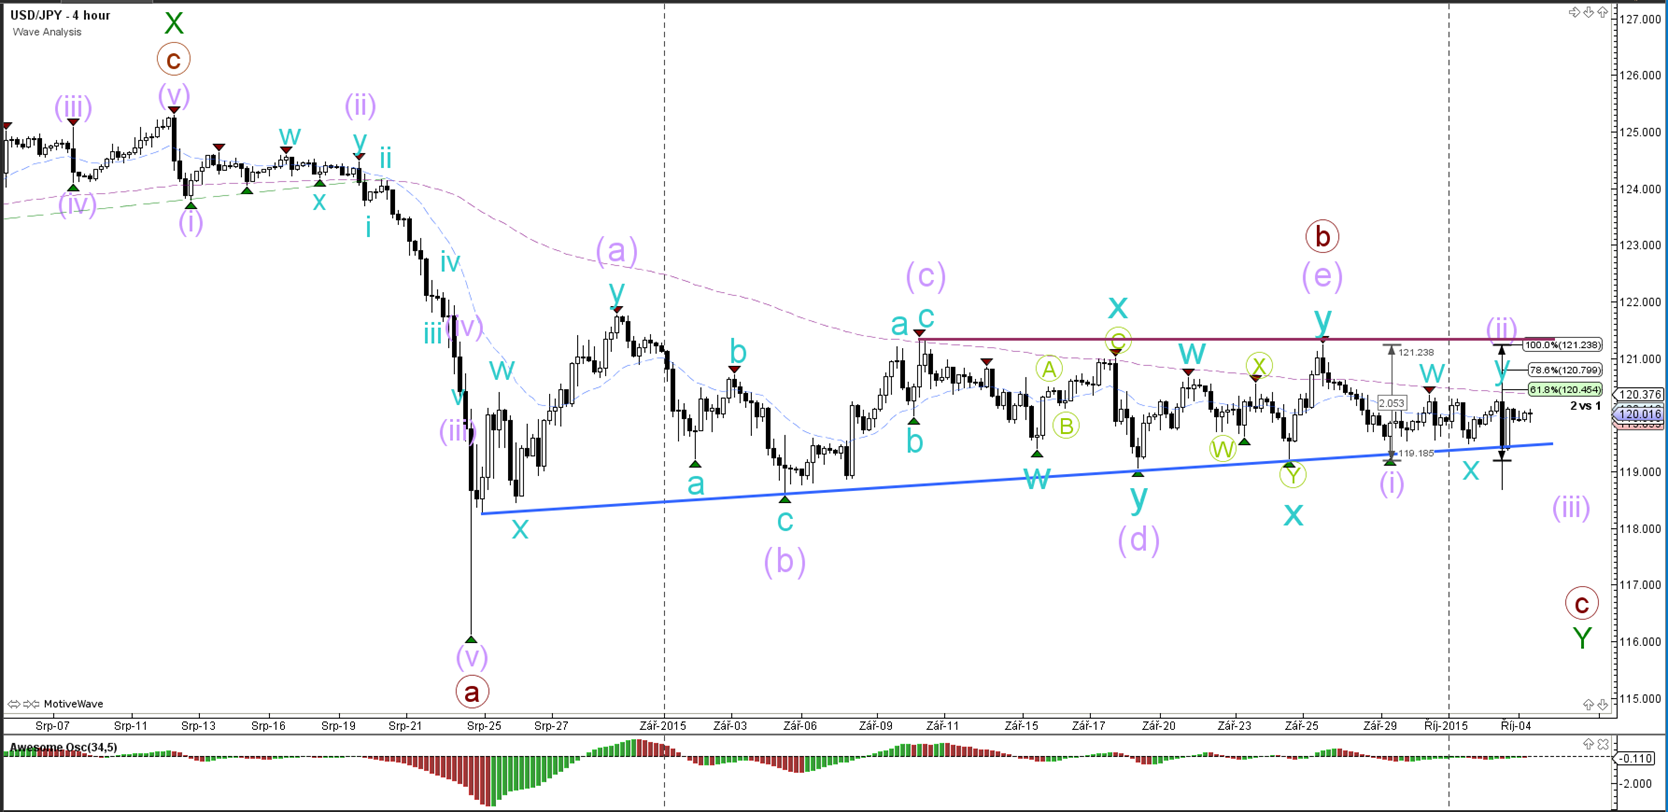
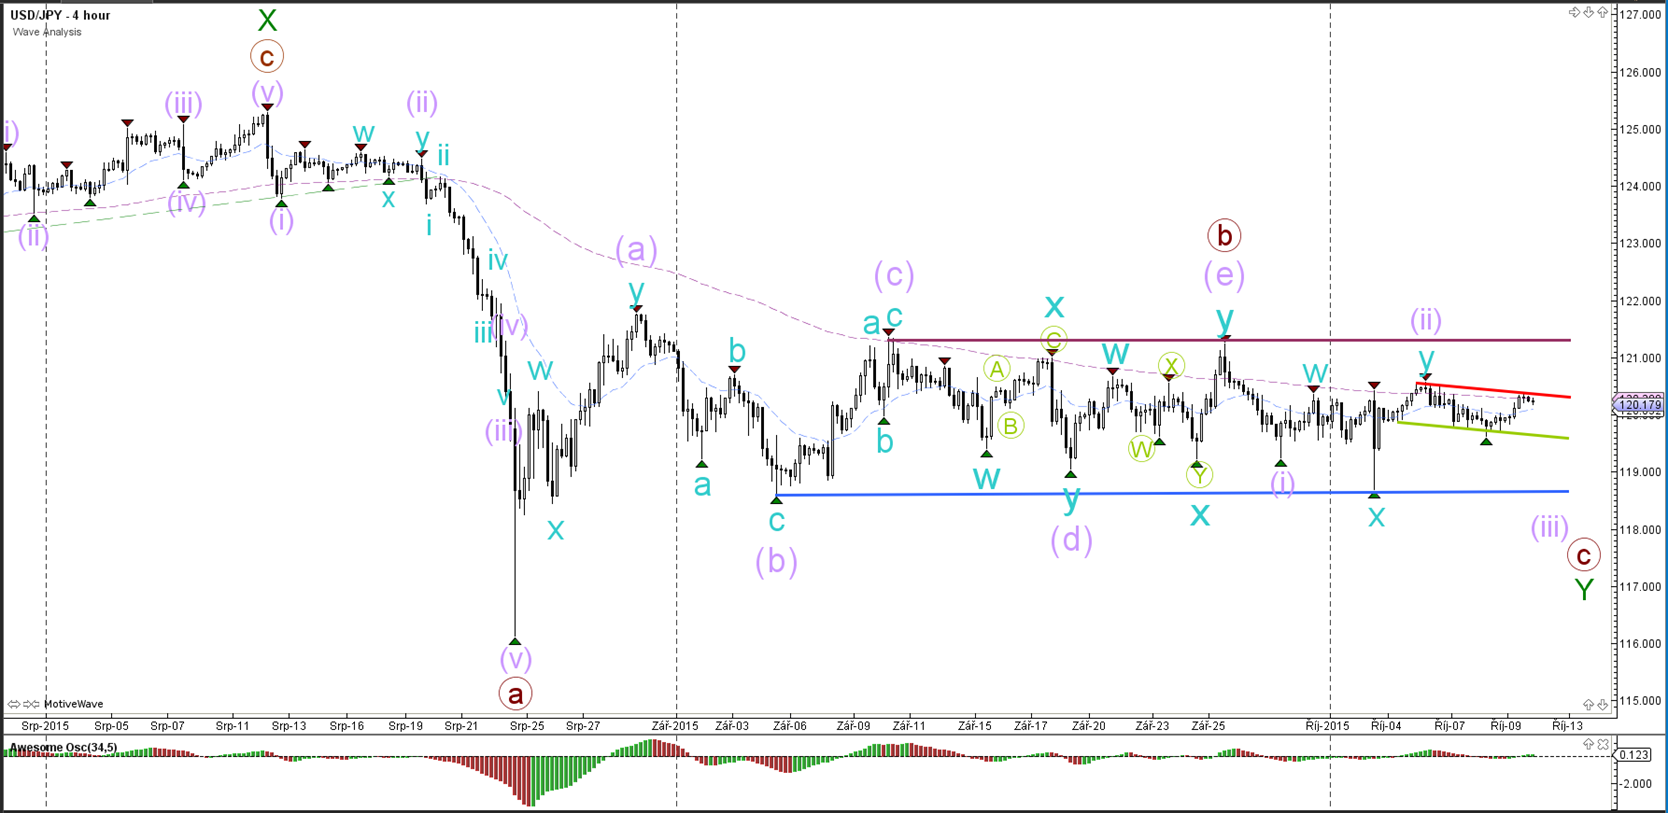
USD/JPY
4 hour

The USD/JPY has been moving down quickly since hitting the 78.6% Fibonacci level within the contracting triangle.
“Original analysis is provided by Admiral Markets”
EUR/USD
4 hour
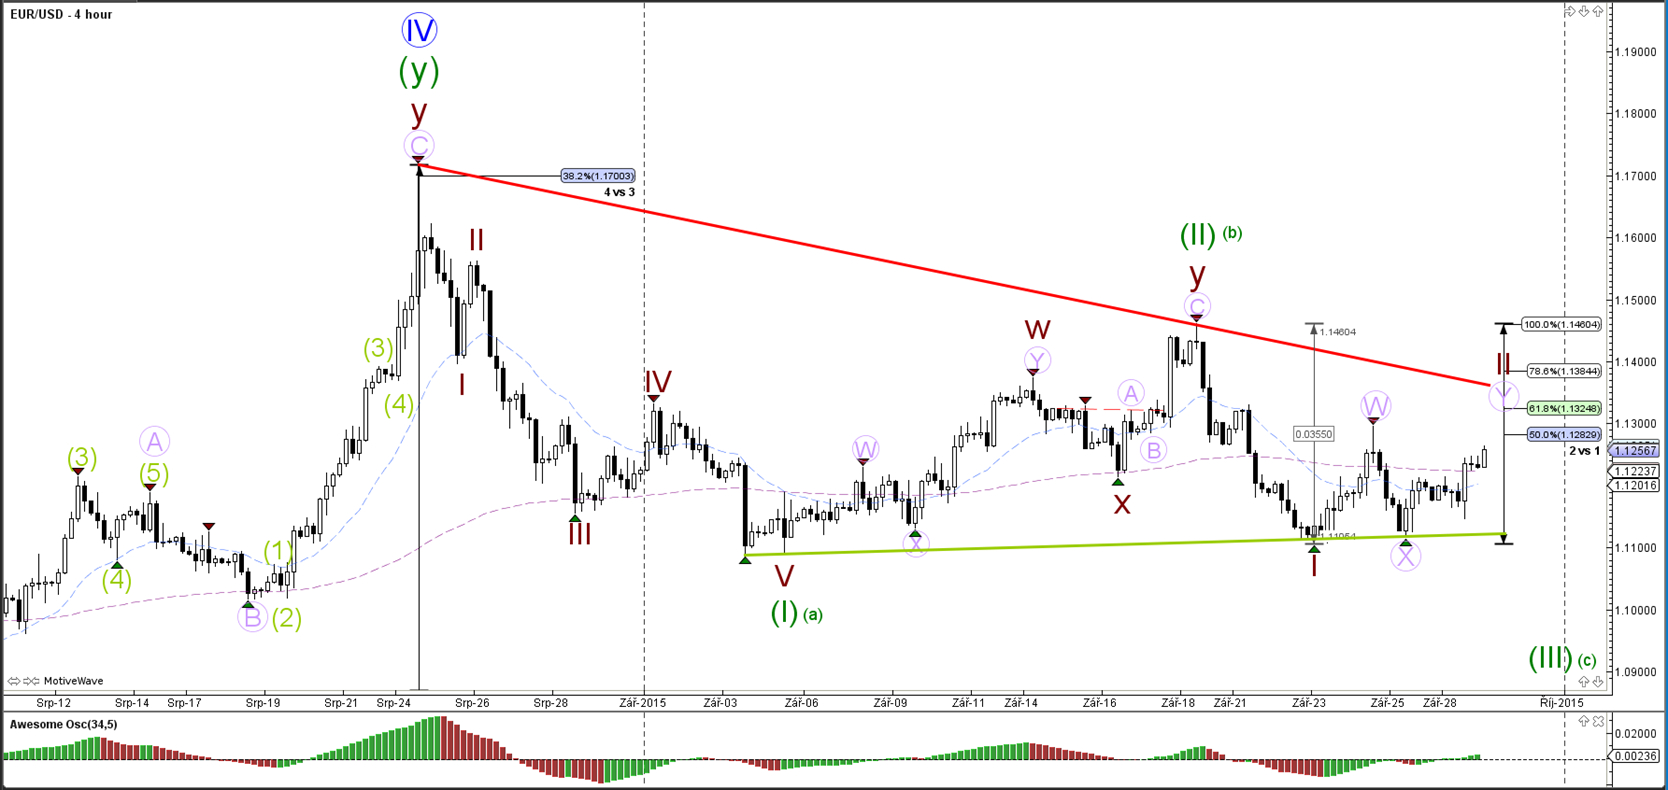
The EUR/USD is pulling back again within the wave 2 (brown) and has a potential of moving towards the 61.8% or the 78.6%. A break above the top (100%) invalidates the 1-2 development whereas a break below support (green) could initiate the start of wave 3 or C (green).
1 hour
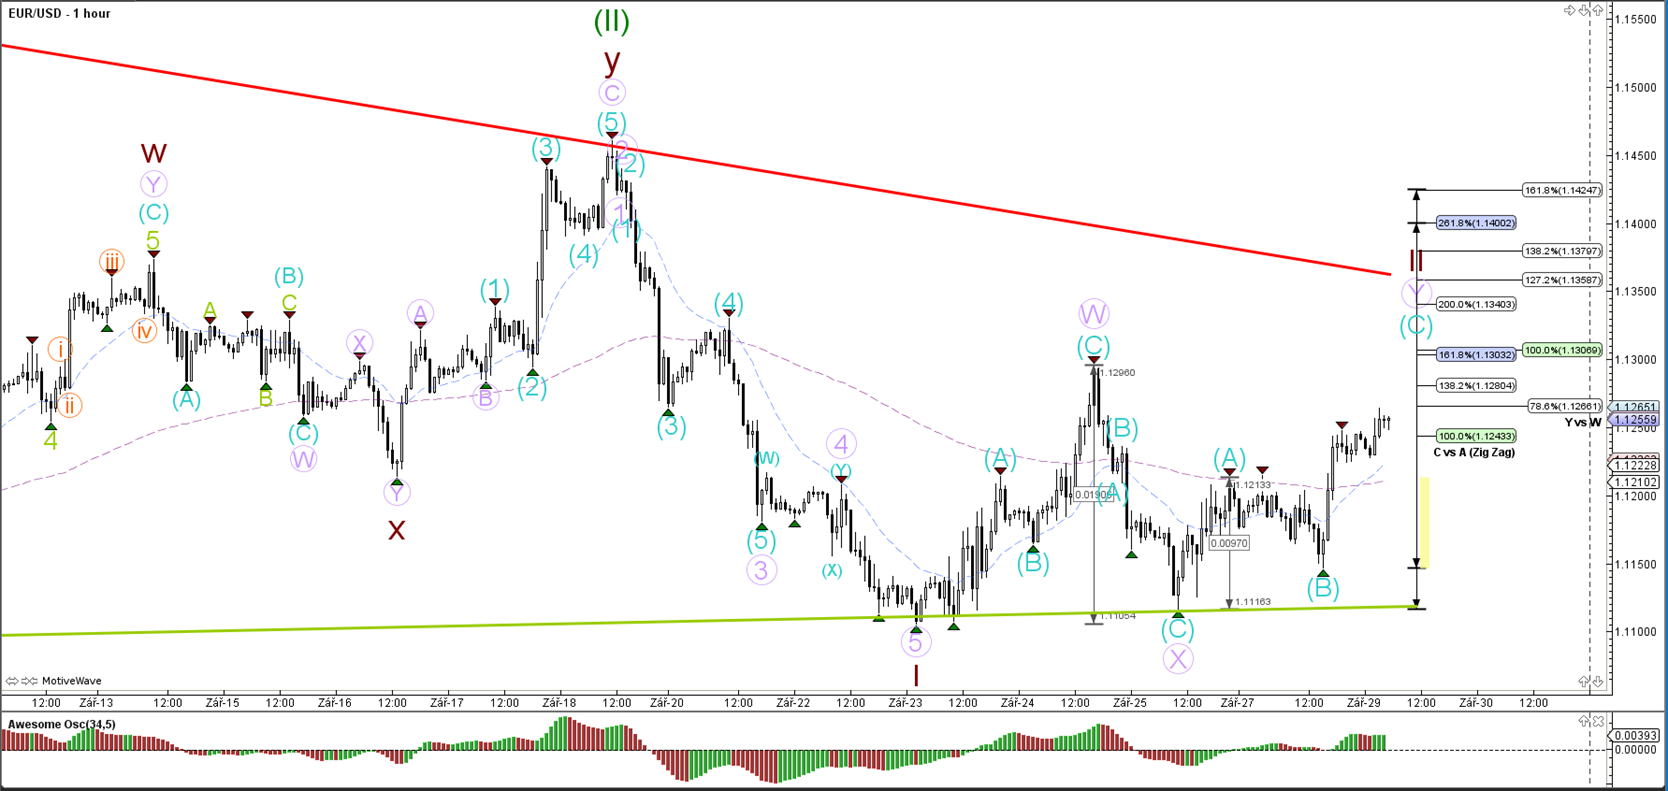
The EUR/USD made a bullish bounce at support (green) as part of the wave B (blue) turn around for a wave C (blue) rally.
GBP/USD
4 hour

The GBP/USD is approaching the bottom support (green), which is a bounce or break spot. The current wave count is leaning towards a bounce as part of a WXY (pink) correction within wave 2 (orange).
1 hour

The GBP/USD is retesting the support level (green) for the 3rd time. A break below or above the lines could indicate the short-term direction.
USD/JPY
4 hour
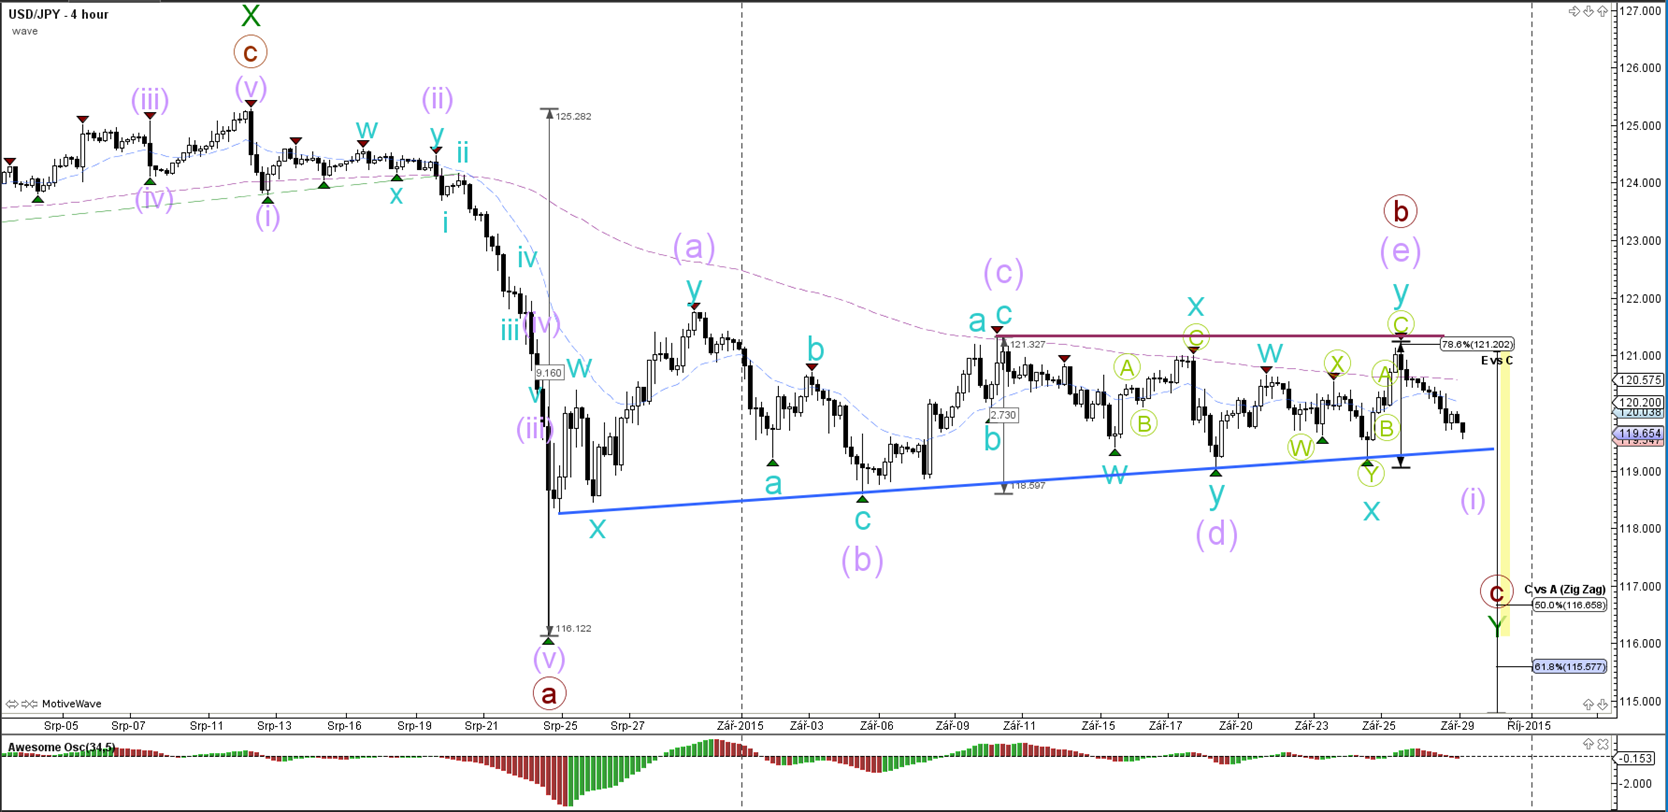
The USD/JPY has been moving down quickly since hitting the 78.6% Fibonacci level within the contracting triangle.
“Original analysis is provided by Admiral Markets”