Technical Analysis by Admiral Markets

USD/JPY Pinbar confluence formed


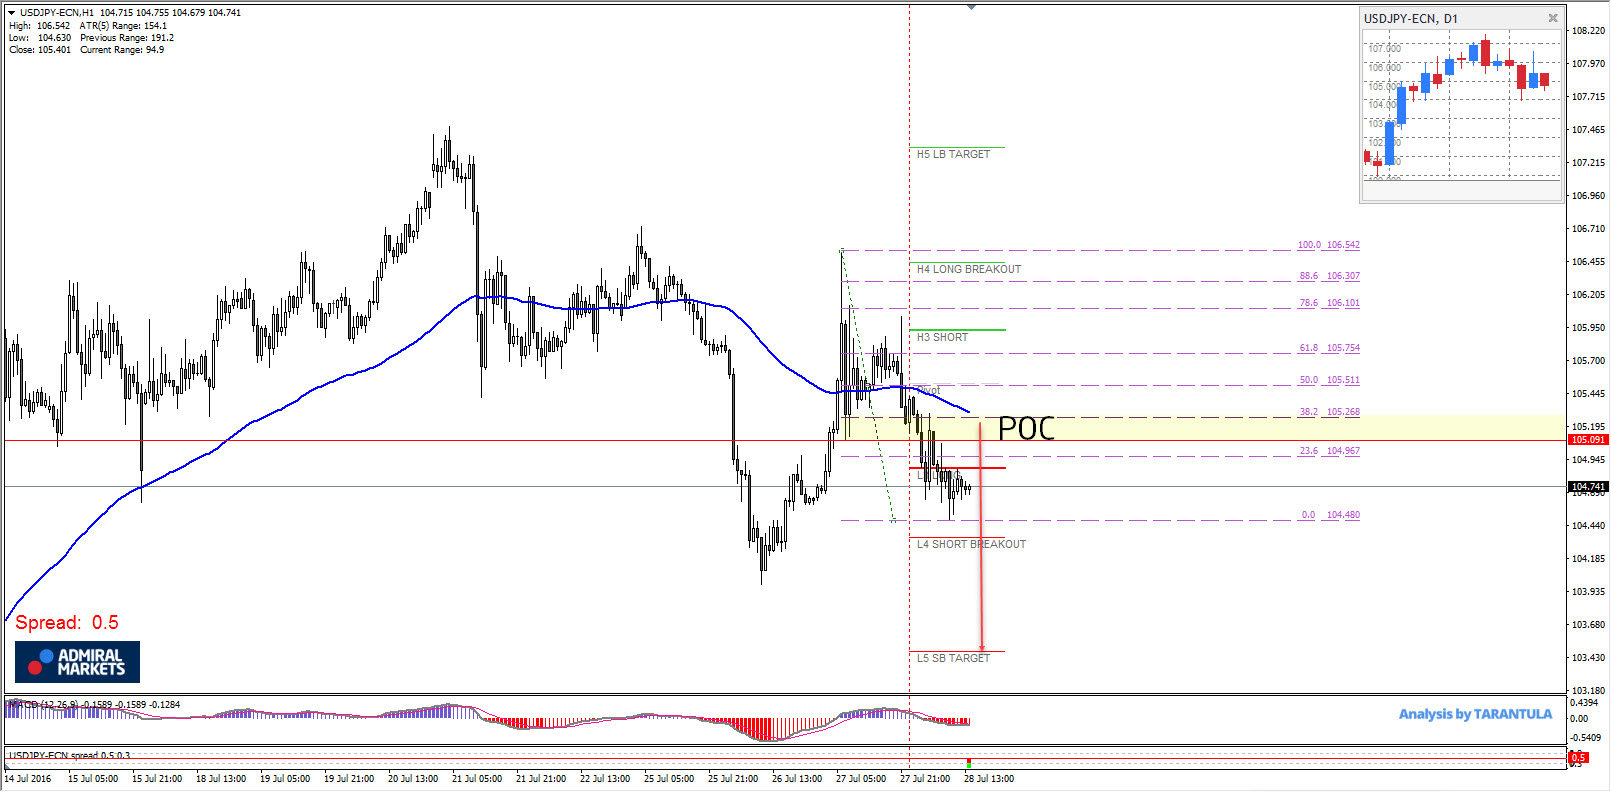
The USD/JPY aka "The Ninja" is in downtrend but after latest reports from BOJ, it has been put into a retracement mode. Abe's stimulus could be up to $354 billion. Technically the retracement is seen on H1 intraday chart and from a short term trading perspective we could see sell on rallies. 105.10-27 is POC zone (38.2, EMA89, Pin bar) and adding to that is 2 huge pin bars slightly above that are important as they mark near term historical sellers. If we see rallies to POC, we might see fresh shorts. If the pair breaks below 104.30 targets are 104.00 and 103.50. Today's important data is scheduled for 12:30 PM GMT is Unemployment claims so I wouldn't be surprised to see the ninja short term selling off 104.80 (L3 camarilla) before the news.


“Original analysis is provided by Admiral Markets
 
USD/CAD Daily bullish hammer but watch the news


The USD/CAD has formed a daily bullish hammer as we can see on our mini chart and it is in alignment with historical buyers a support. It suggests a bullish continuation. Currently the market is waiting for important CAD and USD GDP news so we need to pay attention to charts.

POC (50.0,EMA 89, steep trend line) stands within 1.3145-55 zone and if the zone holds we might see 1.3180 an 1.3203 (H4 CAM). If 1.3203 breaks 1.3250 is next target. However if we see a drop below 1.3145 on positive CAD and negative USD news the pair could drop below 1.3140 targeting 1.3100.

The pair is technically bullish so if we see good USD / bad CAD data, then the pair will be in both technical and fundamental alignment and long on dips (breakout) is the option.


“Original analysis is provided by Admiral Markets
 
USD/JPY hidden bullish divergence on H4 time frame


The USD/JPY fell heavily on Friday mostly because BOJ failed to deliver more QE. Additionally the BOJ didn't cut the interest rare and logically enough, the Yen strengthened. Due to Abenomics in Japan, and follow through risk-on as US Equities performing strongly overnight, Nikkei surged up and that was reflected on USD/JPY which shows a hidden bullish divergence on H4 time frame. The Ninja, how we call the USD/JPY has provided us more than 200 pips on both Session Recap and the previousUSD/JPY analysis if you followed it.

The price is currently retracing towards Friday lows but in addition to hidden bullish divergence we also see the trend line (purple color) just where the price divergence is showing up. The price POC is 101.28-58 (78.6, hidden bullish divergence, historical buyers) but due to divergence and trend line support, we might see the price rejecting off 102.00 too so watch it. If the price managed to close above 102.70 on 4h time frame we would see a continuation towards 103.50 and 104.60. The possible spike will be valid too if the price gets to POC2 100.55-85 ( L3,88.6,historical buyers ) so from the current standpoint USD/JPY looks like it could be bought on dips.


“Original analysis is provided by Admiral Markets
 
Yuppy is going down

The EUR/JPY is making bearish swings on daily chart and our mini chart suggests a continuation of bearish trend. Sell on rallies could be possible close to POC 113.35-50 (H3,DPP, trend line). Additionally POC zone is 78.6 fib of the last bearish swing on H1 chart. The target is 112.75 and if the price makes a momentum break below 112.75, it will target 112.25. Only below 112.25, 111.40 is possible but it will hardly happen today as we are in a holiday trading mode.
TA1.jpg
 
GBP/USD Strong marubozu candle on daily chart

TA2.jpg


The GBP/USD is waiting for BOE decision today regarding further reports and monetary policy. The pair is showing a strong marubozu candle on daily chart which indicates that most traders are exiting their short prior to BOE Official bank rate announcement. Whether they will cut the rate, it is yet to be seen but market is predicting a 0.25 % cut.

Technically we can see Head and Shoulders on intra day time frame but also strong buying off the support that is presented as two strong wicks (purple rectangle). If the pair breaks below 1.3270 we might see 1.3230 and 1.3170. Above 1.3350, 1.3415 is possible. Watch for volatility that will rise for sure just before the announcement and during the presser.
 
EUR/USD strong support within 1.1050 zone

TA3.jpg


The EUR/USD spiked straight from our POC after the analysis on Session Recap webinar. After initial spike the pair dropped after stronger than expected NFP data. Next POC zone is 1.1120-40 (38.2, WPP, H3, Inner trend line) but also pay attention to current rejection from 23.6 and EMA 89. Dark cloud that is formed on H4 could directly tank the price (without a pullback to POC) towards 1.1050-35. Only below 1.1035 the pair should test 1.0980 the confluence of L4 camarilla and rising trend line.
 
EUR/CHF bullish but close to historical sellers

TA_10_09_16.jpg


The EUR/CHF is in a strong uptrend but it is getting close to historical sellers. As we can see on the chart, the inner trend line has been broken and the pair is currently slightly above H3 - in no man's land. There are 2 scenarios. If the pair gets to historical sellers we could see sellers taking over the pair. POC2 (H4, quad-top, historical sellers) 1.0925-1.0935 is the zone for short entries towards 1.0890. Conversely, 1.0890-1.0900 POC ( inner trend line, L4, EMA89, DPP) is the zone where we might expect bounce towards 1.0930 zone. Pay attention to movement as the range is small and the pair is in the middle of nowhere at this point.
 
USD/CAD Dead cat bounce

TA_11_1.jpg


The USD/CAD has been dropping after a strong marubozu candle (highlighted in purple) breakout to the upside. At this point it is looking like a dead cat bounce. For all who are wondering what a dead cat bounce is there is an old adage saying that even a dead cat will bounce if it is dropped from high enough. In Forex if the strong rally is faded then we might assume a dead cat bounce. We can see that USD/CAD pair has countered a strong marubozu candle even stronger than its breakout and we can assume that the downtrend is in progress. POC (50.0, trend line, H3, EMA89) comes within 1.3075-95 zone and the price should face sellers if it gets there. If we see a deeper pullback next POC zone where now moment sellers are is POC2 (61.8,H4) 1.3120-30, and rejection should be valid. In both cases a sustained selling will get the pair down to 1.3020 followed by 1.2990. Only the breakout below 1.2990 will aim for 1.2920.

 
Last edited:
GBP/JPY is targeting sub 130.00 zones

technical_15_08_16.jpg


The dragon - GBP/JPY currency pair is in a strong downtrend. The uncertainty of the GBP due to upcoming Brexit, with the already sensitive Yen due to stimulus in Japan and bullish trends in Equities, just add to the overall volatility of the GBP/JPY pair. Currently the GBP/JPY is close to L3 Weekly PP so we might see some bounce before next leg of selling. Traders should pay attention to 131.80-132.00 zone. (H3, WPP) for short trade setups. Additionally we have another confluence coming within 132.35-60 zone (23.6, H4 WPP, historical sellers, inner trend line). Both zones should provide short trading opportunities towards 130.00. If we see break of 130.00 than 129.80 is the next target followed by 128.72 where we should see a bounce.
 
USD/CAD keeps selling on rallies in a strong zig zag

tech_17_8_16.jpg


The USD/CAD has been in a strong downtrend after a break of a trend line (blue) indicated by a failed W bullish pattern in uptrend (green rectangle). At this point we see a strong bearish zig zag targeting sub 1.2800 levels, if the pair proceeds with downtrend. Retracement to POC targets 1.2910-25 zone (61.8, historical sellers, H4 cam DPP, EMA89). If we don't see a pullback towards POC then we will need watch for h1 momentum or 4h close below L3 - 1.2850 that could tank the pair down to 1.2788. Below 1.2788, the pair is targeting 1.2722.


Back
Top