Technical Analysis by Admiral Markets

GBP/USD double top in progress

TA18_08.jpg


The GBP/USD has broken through resistance on the winds of Inverted Head and Shoulders pattern (green rectangle). POC comes within 1.3165-80 and we could see rejection towards 1.3102 and if it breaks then 1.3020 is next. POC (double top, 61.8, bearish order block) should reject the price but if we see a 4h close above 1.3180 then 1.3238 is next. Pay attention to POC and levels as the price either rejects or breaks through POC.

Follow @TarantulaFX on twitter for latest market updates
 
NZD/USD Potential bearish M shaping up
Technical.jpg


The NZD/USD aka "Kiwi" has been in a range mode but as we can see on the daily mini chart the pair has been rejecting from daily resistance. The pair could possibly make an M 1 2 3 reversal pattern if it rejects from POC 0.7250-70 (WPP, X cross™, EMA89). The target will be 0.7200. If 0.7200 breaks M will be confirmed targeting 0.7164 and 0.7115 if we see the breakout of 0.7164. So at this point we are focused on a possible rejection from POC.

Follow @TarantulaFX on twitter for latest market updates
 
GBP/USD is ready to take off

5sept.png


The GBP/USD aka the cable, is currently set for a possible reversal towards 1.3370 and 1.3456. We have an important POC. The price is currently 1.3328 but we could easily see the rejection towards 1.3370. POC1 (23.6, double trend line, mini rounded bottom) is 1.3287-1.3315 and anywhere in this zone the price might reject. If the price breaks 1.3370 with a strong 1h momentum or we see a 4h close above 1.3370, 1.3456 should be next. Buy the dips seem to be valid now as MACD slope is also positive on higher time frames.

1.3200 needs to hold in order for the price to remain bullish.
 
USD/CAD hidden bullish divergence at L5 pivot

709.jpg


The USD/CAD has broken through 1.2900 as predicted on a previous Session Recap webinar straight to the target. At this point we can see a hidden bullish divergence at L5 camarilla pivot point that could give us a retracement for next short opportunity. There are 2 scenarios. First scenario is trend move. If the price proceeds to POC 1.2925-40 (bearish order block, L3,divergence trend line), it could reverse to 1.2820 and 1.2764. POC is also protected by 38.2 and EMA89 just above it. Second scenario is H1 momentum or 4h close below L5 weekly camarilla - 1.2815. In that case traders should look for 1.2764 target.
 
GBP/JPY hidden divergence could empower bulls

2016_09_08_13_55_38.png


The dragon, GBP/JPY pair made a strong move to the upside from 132.00 zone. After hitting 138.35 it dropped and currently its at POC zone 135.22-50 (double bottom, lower price harami, divergence trend line, L3, 61.8). The price could spike from the zone towards 136.10 and further 136.70. Only above 136.75 we could see another retest of 138.00.However, divergence could fail if the price dropped below 134.75 and in that case way to 133.95 would be open. So at this point traders should focus on possible spike from POC zone.
 
GBP/USD Rooftop pattern in progress

2016_09_12_13_16_48.png


The GBP/USD is dropping from 1.3450 zone on a strong rooftop pattern momentum. The pattern is huge and sell into rallies could be the option now provided that bearish momentum on higher time frames is intact. POC (61.8, EMA89, inner trend line) 1.3285-1.3300 should reject the price towards 1.3235. If 1.3235 breaks next is 1.3208. 4 hour close below should tank the pair towards 1.3152. If you take a look at daily chart you can see a dark cloud cover lurking at resistance where a giant rooftop pattern is on H1 timeframe. It hints for additional confluence for short trades.
 
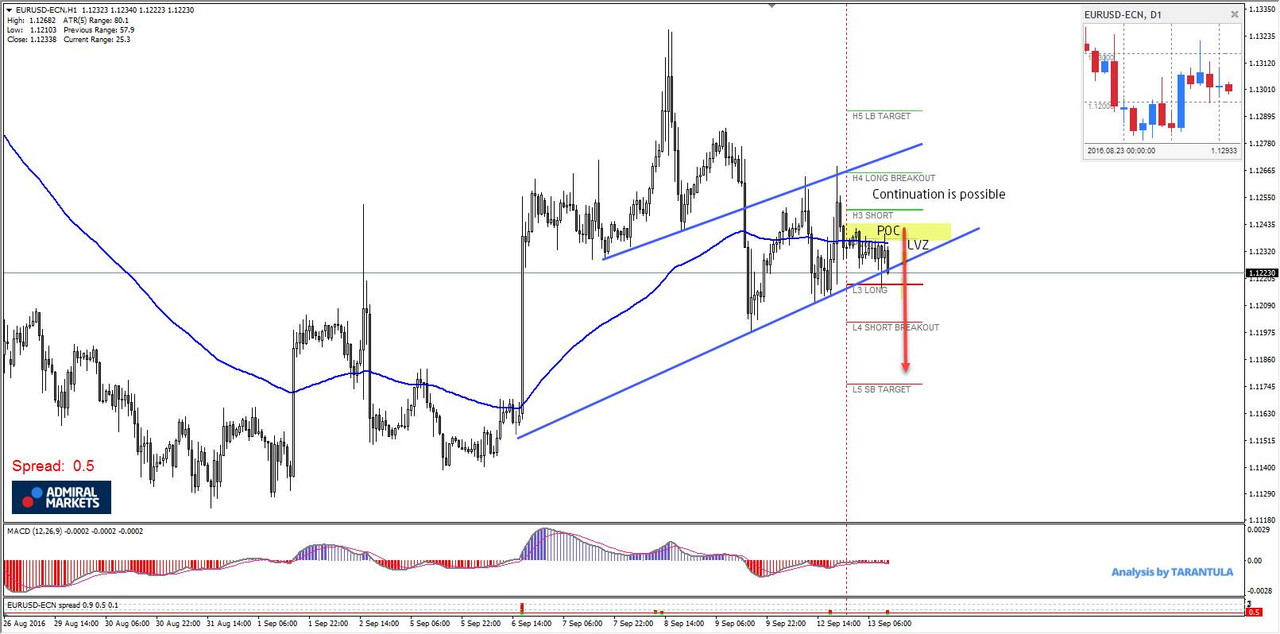
EUR/USD Continuation is possible

1309.jpg


The EUR/USD has rejected from POC as show in yesterday's Session recap webinar and today we might have a continuation caused by weaker than expected German ZEW economic sentiment result. 1.1235-45 zone could provide a continuation from yesterday's drop off 1.1270 zone as long as 1.1280 stays strong. LVZ - Low volatility zone has shown within POC that is consolidating at EMA 89 and we could also see a potential M pattern. Targets for the down move are 1.1200 and 1.1175. Additionally we can see a pinbar on daily chart cueing for a further bearish continuation.
 
USD/JPY another higher low is printed out

2016_09_15_13_47_01.jpg


The USD/JPY aka "ninja" has been printing out higher highs and higher lows on intra day charts. If 101.75 holds we might see another push towards 102.70 and 103.05 as we can see a T89 on H4 chart. POC comes withing 102.05-102.18 (trend line/steep trend line, L3, X-Cross ™,historical buyers). Although I am not a fan of steep trend lines, this one follows the price and it is making an X-Cross ™ with other confluence factors. New rejection could use a fresh momentum from a new higher low towards fresh daily highs. However if 101.75 fails we could see a dip towards 101.30.
 
EUR/USD hidden bullish divergence at 88.6 fib

2016_09_19_12_49_02.jpg


The EUR/USD has dropped to POC zone on 4h time frame which is still showing uptrend. August trend line is making an X cross ™ with H3 camarilla and weekly pivot point suggesting a possible retest. Daily bearish candle could use some retracement to the upside based on a direct drop on Friday. POC zone (88.6, trend line) is supported by hidden bullish divergence so the zone 1.1145-1.1166 could spike the price to the upside targeting 1.1200 and 1.1225. If the divergence fails and the price drops below 1.1115 we could see 1.1080 followed by 1.1050 and 1.1020.
Only if the price breaks 1.1225 the door towards 1.1280 will be open.
 
EUR/USD showing strength due to USD weakness

The EUR/USD is showing strength due to neutral to dovish FED and USD weakness. The USD weakness is even more pronounced as EURGBP is flat and DAX is pushing higher that goes completely in accordance with my previous DAX analysis and US Fed decision market impact. There is a risk-on in the markets because Bond Yields are staying the same.

Nenad.jpg


At this point EUR/USD POC zone is 1.1200-1.1215 (H3,38.2,historical buyers) and a pullback towards the zone could be use for potential long trades. However a clear break and close above red trend line is needed for price to push higher towards 1.1263 that is an X-Cross ™ target confluence. 1.1285 is showing historical sellers so we might see some sell off around this level.
 
Back
Top