Sive Morten
Special Consultant to the FPA
- Messages
- 18,771
Fundamentals
Reuters reports U.S. dollar rose against the yen and euro on Friday in scant volume, with many major markets still closed after the Christmas holiday. The greenback approached a 7-1/2-year peak against the yen and moved close to a 2-1/2-year high versus the euro based on the view the U.S. economy is expanding at a fast enough clip that the Federal Reserve could consider ending its near-zero interest-rate policy in mid-2015, analysts said.
"You have to be long-term bullish on the dollar next year. There's going to be a dip-buying mentality" said Rob Zukowski, senior technical analyst at 4Cast Ltd. based in New York.
Trading activity will likely pick up only a tad early next week due to another shortened week when markets will be closed on New Year's Day.
Data on Tuesday that showed the U.S. economy growing at its fastest quarterly pace in 11 years underscored the divergence in paths between the world's largest economy and those of Japan and Europe, where monetary policy is expected to remain loose to boost growth and avert deflation.
Data released on Friday highlighted some of the struggle the Bank of Japan faces. The year-on-year rise in Japan's core consumer prices slowed to 2.7 percent in November from 2.9 percent in October as a result of the steep drop in crude oil prices.
Widening differentials between U.S. and record-low Japanese and German yields should favor the dollar as more traders return from holidays.
U.S. two-year Treasuries yield held a 0.84 percentage point premium over the comparable German Schatz yield, which was the largest since early 2007. It held a 0.74 point yield premium over two-year Japanese government debt, close to the biggest level since May 2010, according to Reuters data.
As we’ve said once in daily video today’s report will be dedicated to Canadian dollar. Mostly because CAD stands at the eve of interesting setup on long-term chart. But let’s go step by step. First, let’s take a look at recent CFTC data on CAD.
Unfortunately we do not have data for 23rd of December, but only on 16th. Still even this data shows increasing of long speculative positions. Particularly due recent growth of buyer’s interest – we see increasing in open interest of Canadian dollar, while short positions have not decreased and stand at high levels. What is interesting for us is starting of careful purchasing of CAD.
Open interest:
 Shorts:
 Longs:

Also, as we know CAD stands in tight relation to Crude Oil prices:
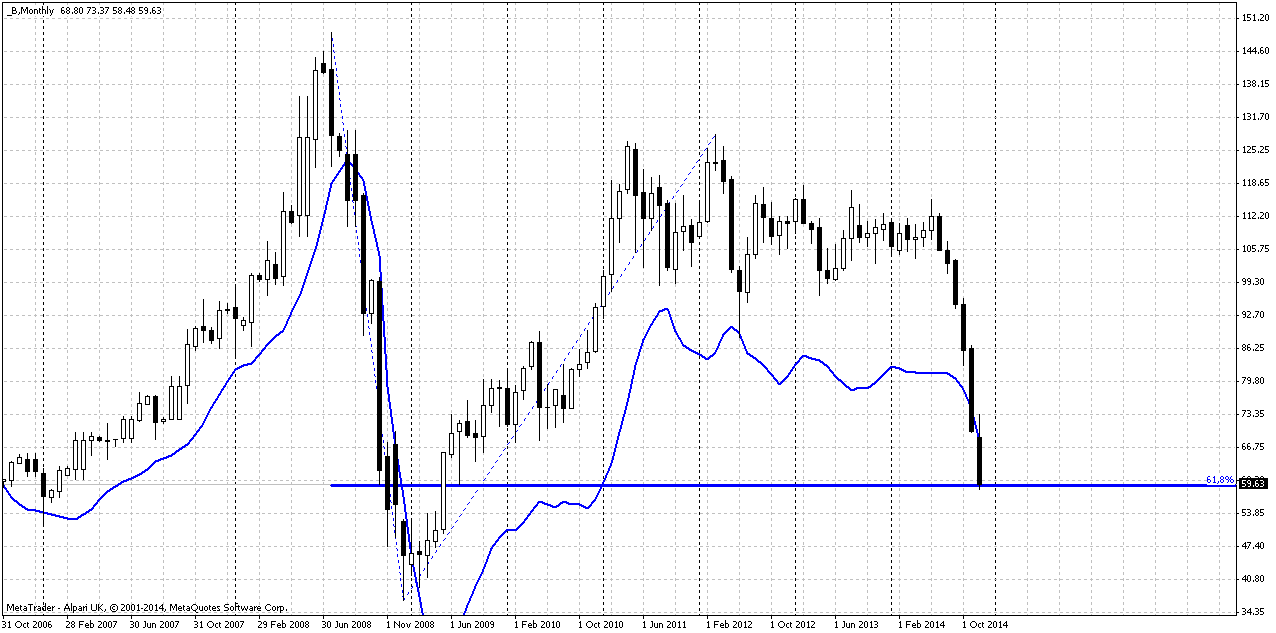
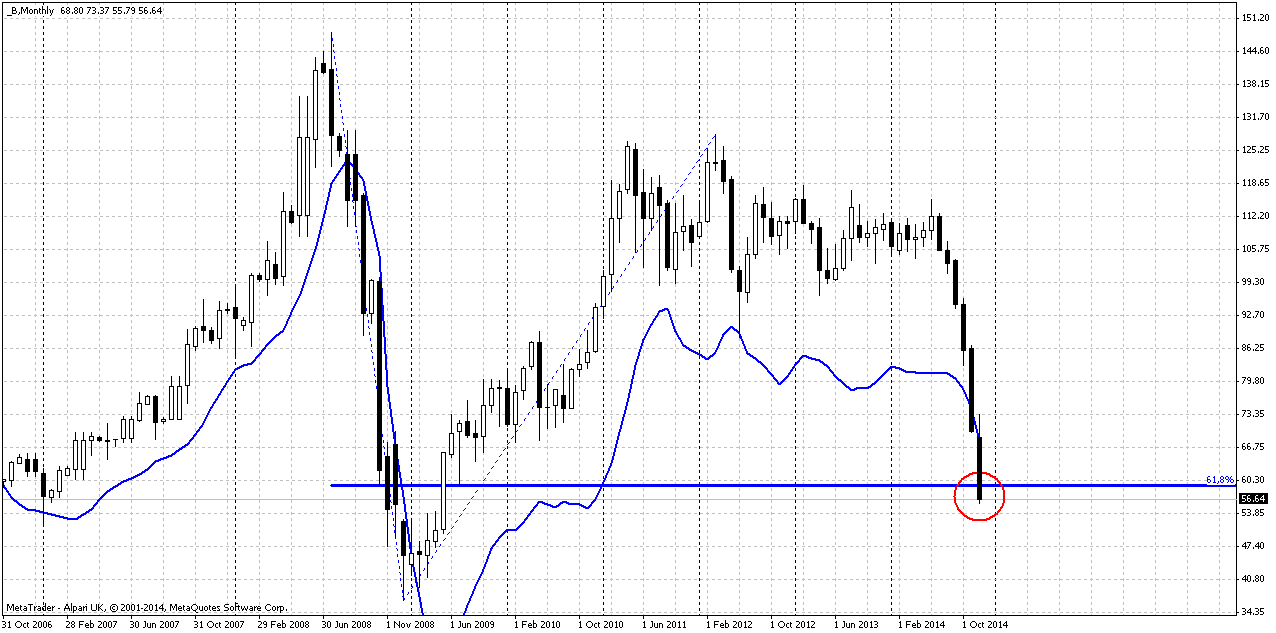
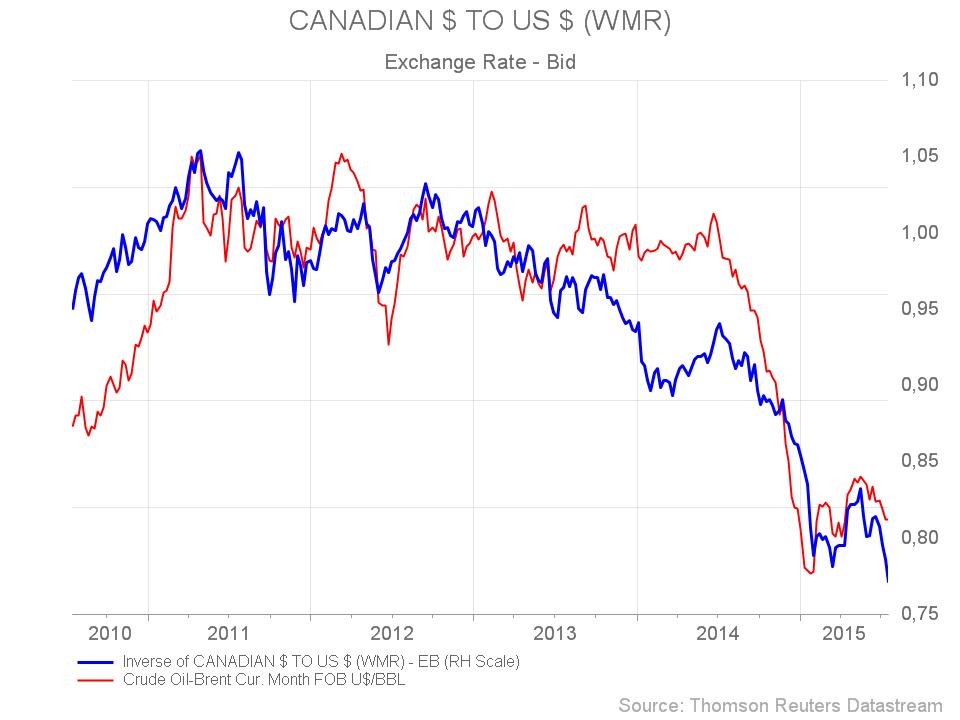 Recent data on Crude storages in US has shown solid increasing. These numbers definitely would lead to drop in crude prices in other time, but recently crude just has swallowed them and stand tight around 60$. Currently nobody knows how deep Crude could fall. Recent level will be 37-40$. Average production costs stands around 35$ and it consists of two approximately equal parts of production - cheap with 5-20$ production expenses and expensive one – 30-60$. Currently there are no doubts that drop in crude prices are not normal market behavior and mostly is driven by geopolitical reasons. This is artificial drop. That’s why it could continue further, but in this case 50% of producers will closely come to breakeven point of production. And it will be more and more difficult to push price lower. May be there will no further pushing down at all. But, Crude stands at strong oversold at all time frames and at major 0.618 monthly AB=CD target. Technically this gives market support. 60$ per barrel is low level by itself, especially in winter and recent reaction of crude oil futures on data release just confirms our thoughts.
This moment has solid relation to analysis that we will make today with CAD. Because CAD also stands at very important level.
Technicals
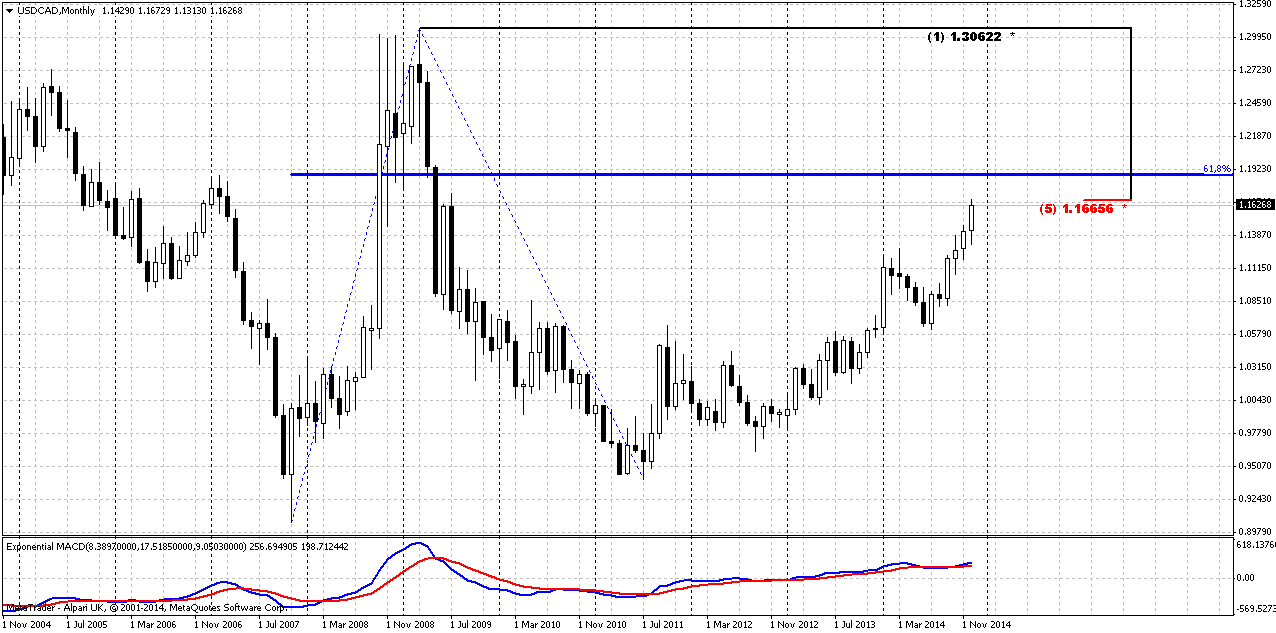
Monthly
On monthly chart trend is bullish, market is not on overbought yet. Here you can see upside AB-CD pattern that is mirror to Crude oil. The only difference is that Crude has hit 0.618 target while CAD is not yet.
Target stands approximately at 1.19. Meantime market right now has reached major 0.618 Fib resistance level at 1.1665. We do not have any pivots here, because CAD has moved above all pivots – Yearly PP, YPR1 and YPR2. Major information here is reaching of Fib resistance level. Still, existence of major target slightly higher obliges us take any short position with caution.
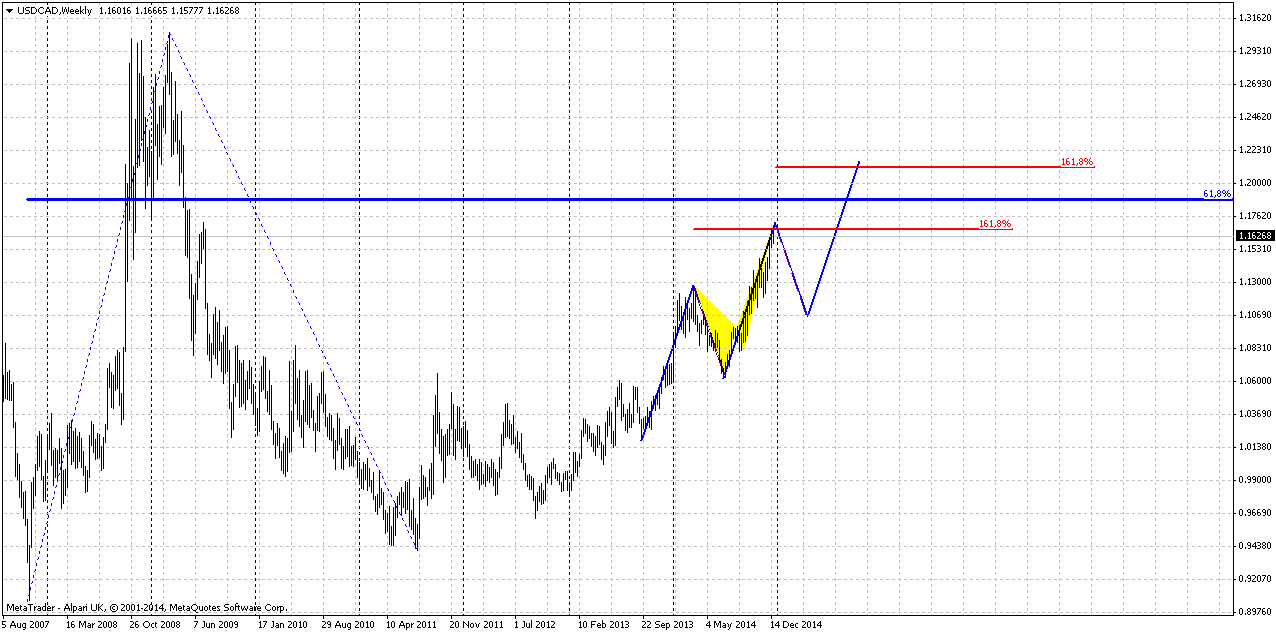
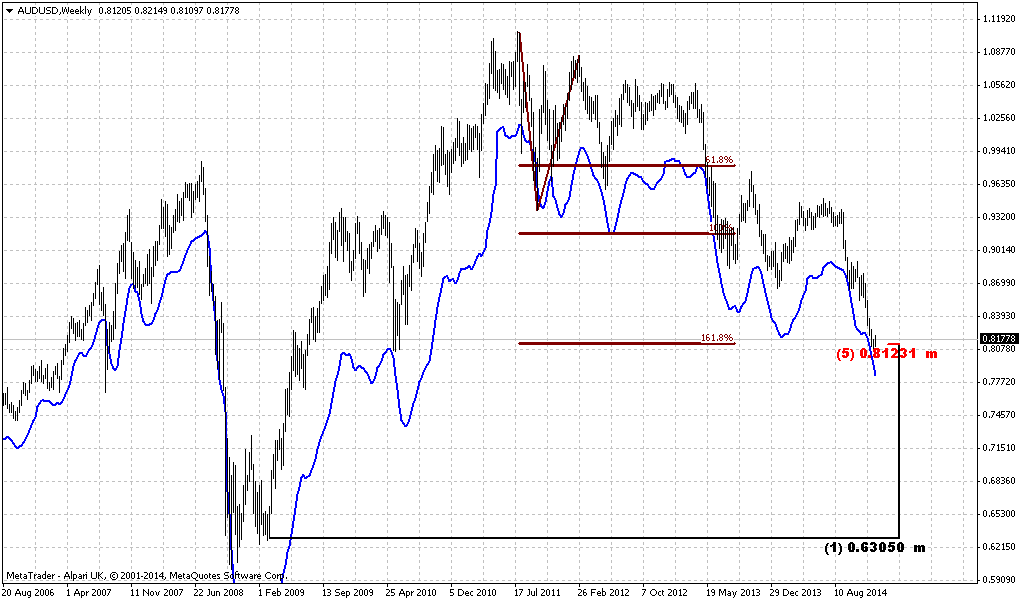
Weekly
Weekly chart is the second big part of long-term puzzle. Here market shows that 1.1665 is not just Fib resistance but Agreement level that is accompanied by weekly overbought and confirmed by completed 1.618 butterfly “Sell” pattern. This is also MPR2, but this is minor add-on. If we would get monthly 0.618 target just 200 pips higher, we would say that this is perfect set up for short entry. Existence of untouched monthly target obliges us to think about any short position with caution.
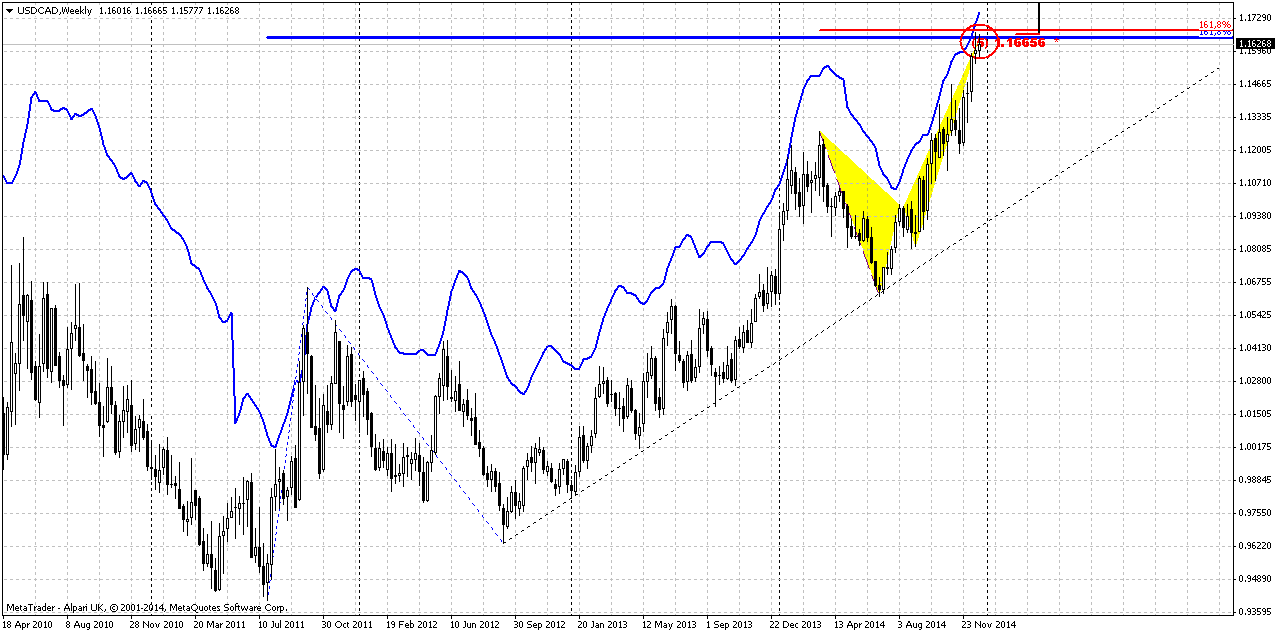
Still in short-term period market could start to form some pattern on lower time frame charts that could become reversal one and at the same time suggests minor upside continuation, such as butterfly, 3-drive or something of this sort: take a look our butterfly here could be 2nd drive of big 3-Drive pattern. Still, before 3rd drive will appear – really deep retracement could happen.
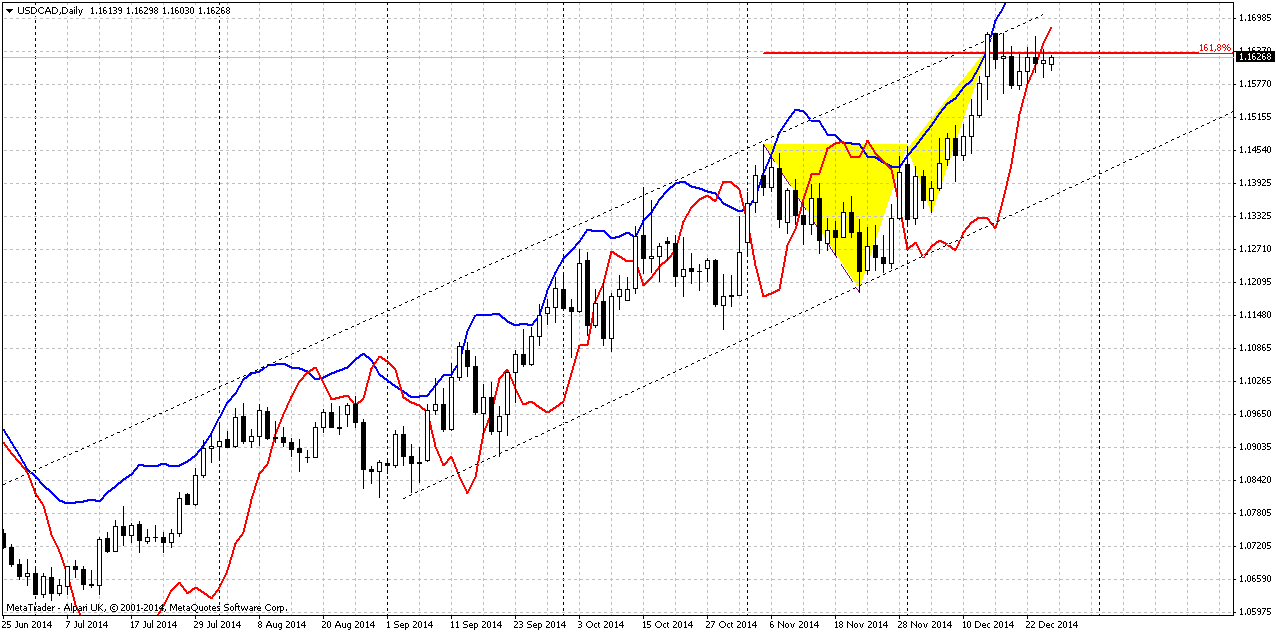
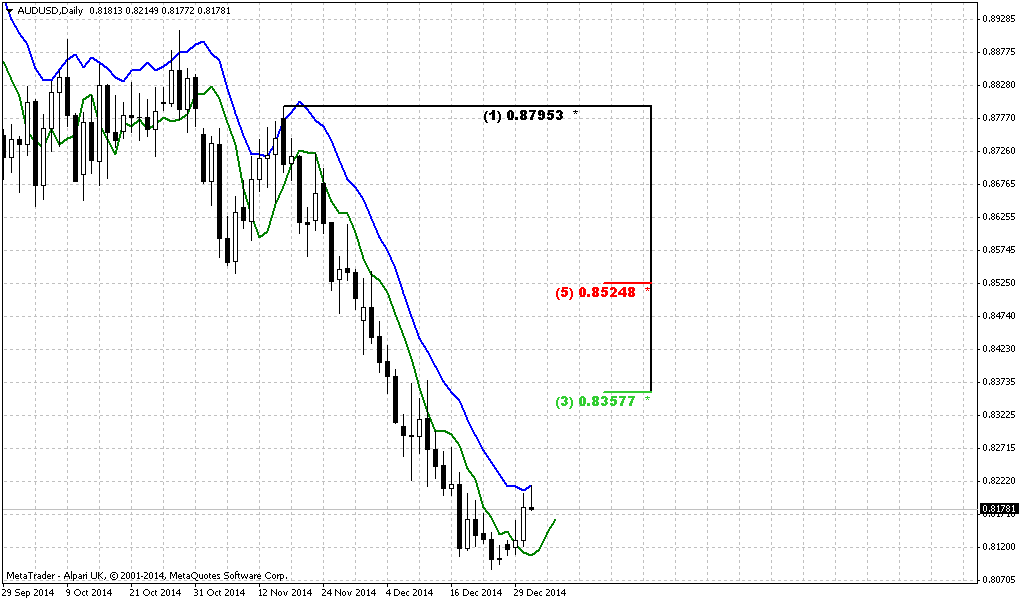
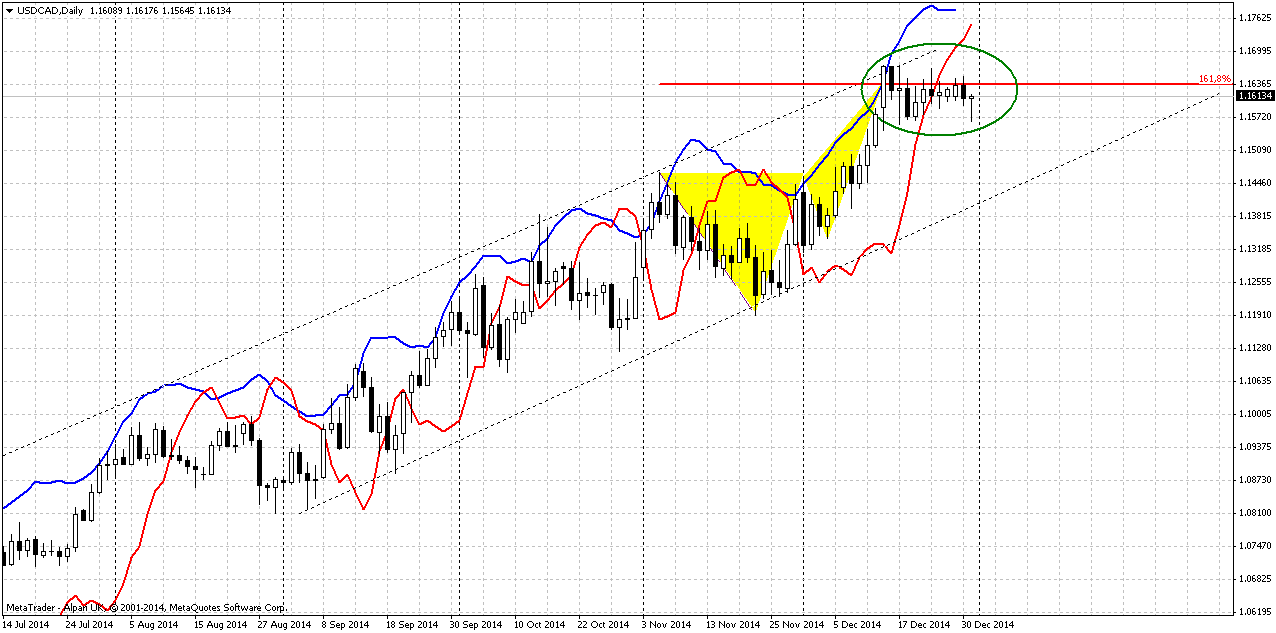
Daily
Here market also has completed some patterns. In general it stands in long upside channel. Currently we have completed butterfly “sell” at daily overbought. But as you can see market does not hurry to turn down. We even have bullish grabber here. Flat standing at important resistance could be the sign of bullish dynamic pressure and could lead to further upside action. May be this butterfly will become first drive of 3-Drive pattern.
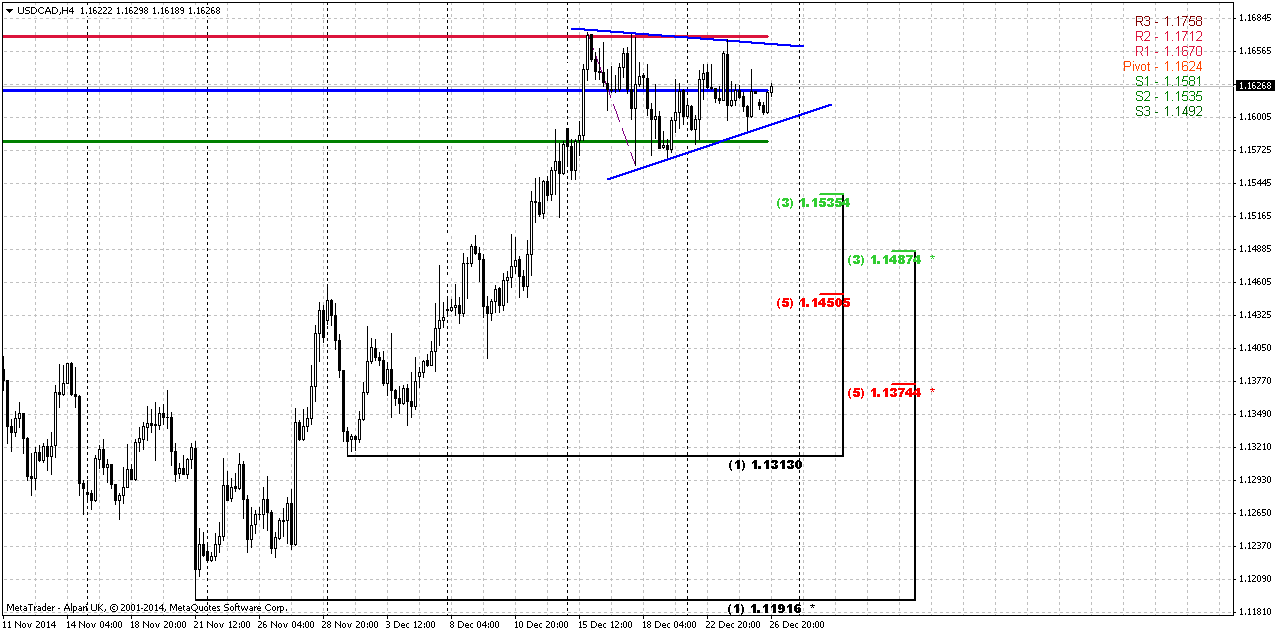
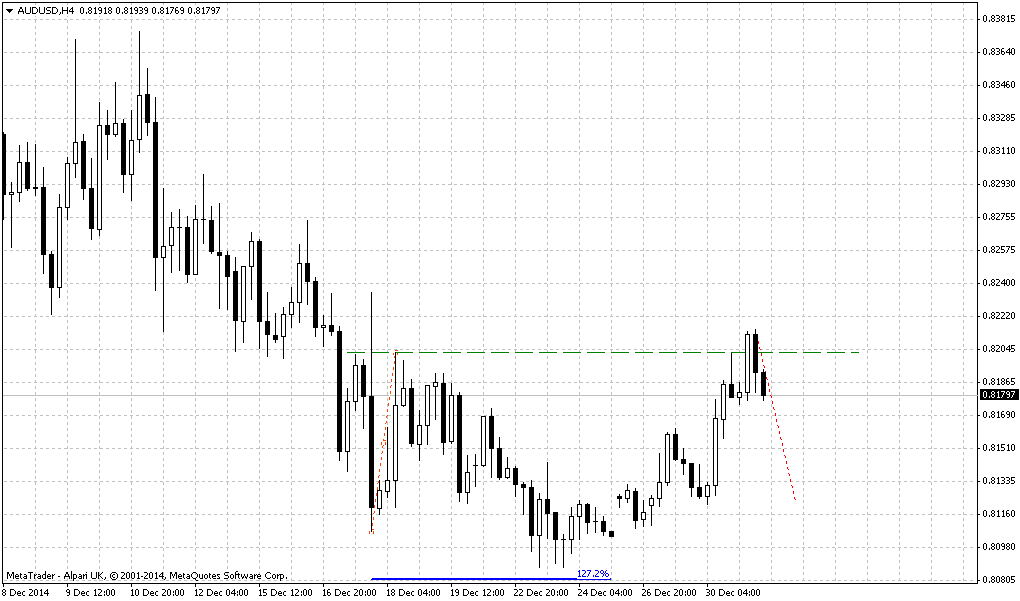
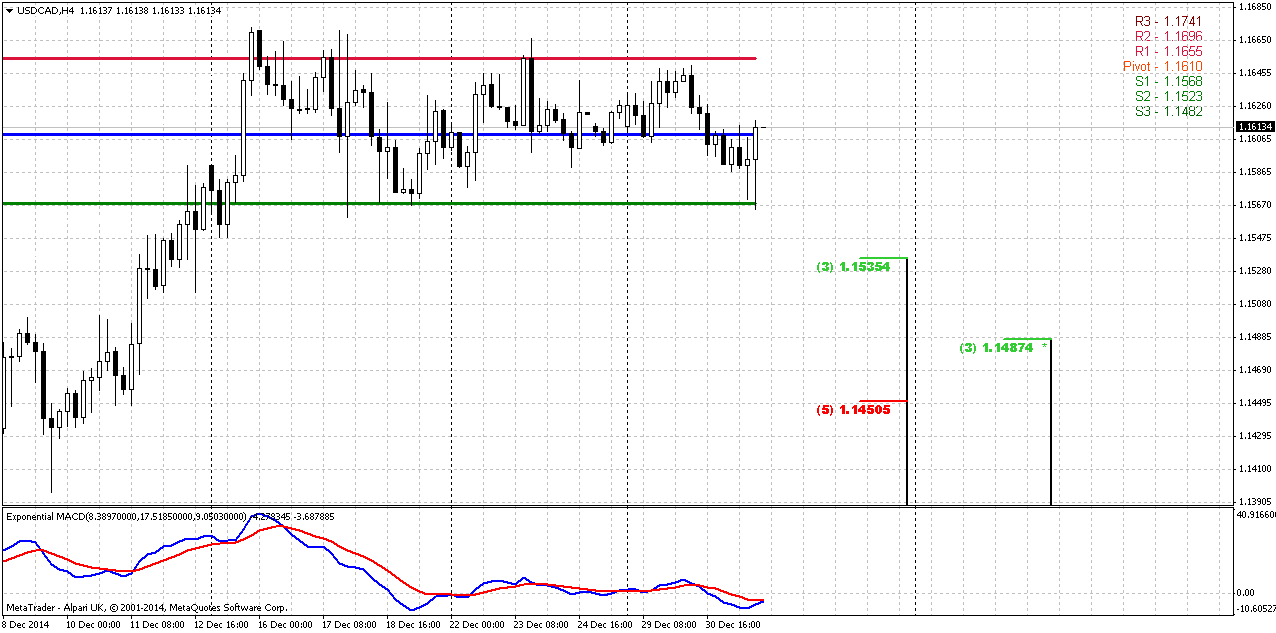
4-hour
Here market is forming some triangle or pennant pattern that theoretically works as continuation one and could shift to butterfly “sell”, for example. But should not forget that we stand at strong weekly resistance and it is logical to expect some (at least minor) retracement down. As market stands rather tight on previous week – pivot levels also stand tight and in fact envelope current market action. Any unexpected breakout of triangle, i.e. downside will suggest that retracement is started, but its depth could be absolutely different. Weekly chart does not exclude action even to 1.10 area.
Conclusion:
Right now as Crude oil as CAD market come to very important moment and met solid areas. But the paradox of situation is we do not see yet response on touching of these areas because too few time has passed since then.
As we know longer-term patterns and levels overrule shorter-term ones. It means that chances on downward retracement look preferable compares to current immediate upside continuation. Although it will follow with high probability but a bit later.
The technical portion of Sive's analysis owes a great deal to Joe DiNapoli's methods, and uses a number of Joe's proprietary indicators. Please note that Sive's analysis is his own view of the market and is not endorsed by Joe DiNapoli or any related companies.
Reuters reports U.S. dollar rose against the yen and euro on Friday in scant volume, with many major markets still closed after the Christmas holiday. The greenback approached a 7-1/2-year peak against the yen and moved close to a 2-1/2-year high versus the euro based on the view the U.S. economy is expanding at a fast enough clip that the Federal Reserve could consider ending its near-zero interest-rate policy in mid-2015, analysts said.
"You have to be long-term bullish on the dollar next year. There's going to be a dip-buying mentality" said Rob Zukowski, senior technical analyst at 4Cast Ltd. based in New York.
Trading activity will likely pick up only a tad early next week due to another shortened week when markets will be closed on New Year's Day.
Data on Tuesday that showed the U.S. economy growing at its fastest quarterly pace in 11 years underscored the divergence in paths between the world's largest economy and those of Japan and Europe, where monetary policy is expected to remain loose to boost growth and avert deflation.
Data released on Friday highlighted some of the struggle the Bank of Japan faces. The year-on-year rise in Japan's core consumer prices slowed to 2.7 percent in November from 2.9 percent in October as a result of the steep drop in crude oil prices.
Widening differentials between U.S. and record-low Japanese and German yields should favor the dollar as more traders return from holidays.
U.S. two-year Treasuries yield held a 0.84 percentage point premium over the comparable German Schatz yield, which was the largest since early 2007. It held a 0.74 point yield premium over two-year Japanese government debt, close to the biggest level since May 2010, according to Reuters data.
As we’ve said once in daily video today’s report will be dedicated to Canadian dollar. Mostly because CAD stands at the eve of interesting setup on long-term chart. But let’s go step by step. First, let’s take a look at recent CFTC data on CAD.
Unfortunately we do not have data for 23rd of December, but only on 16th. Still even this data shows increasing of long speculative positions. Particularly due recent growth of buyer’s interest – we see increasing in open interest of Canadian dollar, while short positions have not decreased and stand at high levels. What is interesting for us is starting of careful purchasing of CAD.
Open interest:
Also, as we know CAD stands in tight relation to Crude Oil prices:
This moment has solid relation to analysis that we will make today with CAD. Because CAD also stands at very important level.
Technicals
Monthly
On monthly chart trend is bullish, market is not on overbought yet. Here you can see upside AB-CD pattern that is mirror to Crude oil. The only difference is that Crude has hit 0.618 target while CAD is not yet.
Target stands approximately at 1.19. Meantime market right now has reached major 0.618 Fib resistance level at 1.1665. We do not have any pivots here, because CAD has moved above all pivots – Yearly PP, YPR1 and YPR2. Major information here is reaching of Fib resistance level. Still, existence of major target slightly higher obliges us take any short position with caution.
Weekly
Weekly chart is the second big part of long-term puzzle. Here market shows that 1.1665 is not just Fib resistance but Agreement level that is accompanied by weekly overbought and confirmed by completed 1.618 butterfly “Sell” pattern. This is also MPR2, but this is minor add-on. If we would get monthly 0.618 target just 200 pips higher, we would say that this is perfect set up for short entry. Existence of untouched monthly target obliges us to think about any short position with caution.
Still in short-term period market could start to form some pattern on lower time frame charts that could become reversal one and at the same time suggests minor upside continuation, such as butterfly, 3-drive or something of this sort: take a look our butterfly here could be 2nd drive of big 3-Drive pattern. Still, before 3rd drive will appear – really deep retracement could happen.
Daily
Here market also has completed some patterns. In general it stands in long upside channel. Currently we have completed butterfly “sell” at daily overbought. But as you can see market does not hurry to turn down. We even have bullish grabber here. Flat standing at important resistance could be the sign of bullish dynamic pressure and could lead to further upside action. May be this butterfly will become first drive of 3-Drive pattern.
4-hour
Here market is forming some triangle or pennant pattern that theoretically works as continuation one and could shift to butterfly “sell”, for example. But should not forget that we stand at strong weekly resistance and it is logical to expect some (at least minor) retracement down. As market stands rather tight on previous week – pivot levels also stand tight and in fact envelope current market action. Any unexpected breakout of triangle, i.e. downside will suggest that retracement is started, but its depth could be absolutely different. Weekly chart does not exclude action even to 1.10 area.
Conclusion:
Right now as Crude oil as CAD market come to very important moment and met solid areas. But the paradox of situation is we do not see yet response on touching of these areas because too few time has passed since then.
As we know longer-term patterns and levels overrule shorter-term ones. It means that chances on downward retracement look preferable compares to current immediate upside continuation. Although it will follow with high probability but a bit later.
The technical portion of Sive's analysis owes a great deal to Joe DiNapoli's methods, and uses a number of Joe's proprietary indicators. Please note that Sive's analysis is his own view of the market and is not endorsed by Joe DiNapoli or any related companies.


") I have learned the hard way about trading against strong trends such as on $/CAD and $/Yen. (Especially the loonie!) It looks like at least another leg down now on Oil, so as per update we should see 1.1750/1.19 on CAD and on Oil next support is $50.50 approx!?
I have learned the hard way about trading against strong trends such as on $/CAD and $/Yen. (Especially the loonie!) It looks like at least another leg down now on Oil, so as per update we should see 1.1750/1.19 on CAD and on Oil next support is $50.50 approx!?