Sive Morten
Special Consultant to the FPA
- Messages
- 18,706
Hello Sive. Can you tell me if this is a correct context for B&B Buy if the bar closes above the 3x3? If so, is the target .618 of the whole move down? Or .618 of the most recent move down? Thank you for teaching.
Hi Icarus,
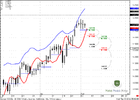
No, there is no context for B&B, because this is poor thrust down. Thrust should have minimum 8-10 thrusting bars, preferrably with no close above 3x3.
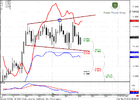
And here we have 4 bars down then 0.382 retracement and then again 3 bars down. You can take a look at daily NZD to see how perfect thrust should look like.
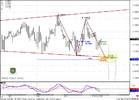
About the target -
Suppose, that we have good thrust down, and then retracement up when you're entered short. Your target - 0.618 support from this retracement up move, but not from the thrust, because you're entering in the same direction as a thrust - hence the target is below your entrly and not above.
Hope that helps