Mr. Morten,
Could you take us through the kiwi analysis, as it should have it's second close below the 3x3 on the daily, as well as bouncing off of the MACDP. I will post a chart soon.
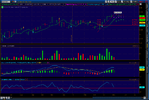
On the weekly the trend is still bullish, but nearest retracement target is sitting at monthly pivot point at 7820 and then support sits at 38.2% around 7745 area.
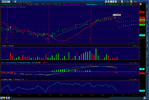
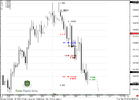
On the daily chart, this is where I get a little confused as to what constitutes DRPO because while we did not have one last week, as of today 5/4/11 we will have two consecutive closes below 3x3. I suppose this does not make a directional signal, but it would not cross the MACDP (red line), and there is no dollar strength. for me I would look at how the price acts around 38.2% retrace of current down move at 7962. If this is a strong bearish trend, price should bounce off of either the 38.2% or 50% fib retracement.
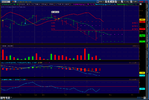
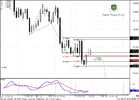
On the 4 hour chart, we have a bearish trend and the 3x3 is already containing the price action. I have shown the retracement from the focus point to the recent top.
Please provide your input to this, as I am still learning to trust my analysis, and you have way more experience.