Sive Morten
Special Consultant to the FPA
- Messages
- 18,771
Monthly
In the beginning of our research I would like to refresh quarterly chart of US Dollar Index. We will return to it from time to time, since it contains our long-term forecast, that we’ve discussed in details here:
https://www.forexpeacearmy.com/fore...pro-weekly-october-31-november-04-2011-a.html
Now we see that this forecast starts to work. In fact it has started to work right after discussion, but this is very long term chart, so to see some effect we need some time to pass. This discussion will be mostly useful for positional traders. We will try to make analogy with EUR/USD chart, since dollar index includes in calculation EUR as much as 56% and relation between Dollar index and EUR is significant (see research mentioned above).
So, here we see nothing more but Gartley “222” buy that coincides with two bullish stop grabbers. Red line is DiNapoli MACD Predictor indicator that shows trend. Currently quarterly trend on dollar index is bullish. Application of simple Fib extensions gives us three targets – 0.618 at 84.012, 1.0 – 91.006 and 1.618 – 102.322. Since this move has started from stop grabbers – they suggest take out of previous highs, that’s why 0.618 extension does not quite suitable for us. Most probable target is Agreement with 0.382 Fib resistance and 91.006 1.0 extension target of AB=CD pattern. Extended target is also an Agreement with 102.322 and 0.618 Fib resistance, but we can’t definitely say anything about it. Possible it could be reached, but we need to see how price action will develop, while target around 91.00 should be reached based on patterns that already have been formed. What level on EUR/USD is matched to 91.00 on dollar index?
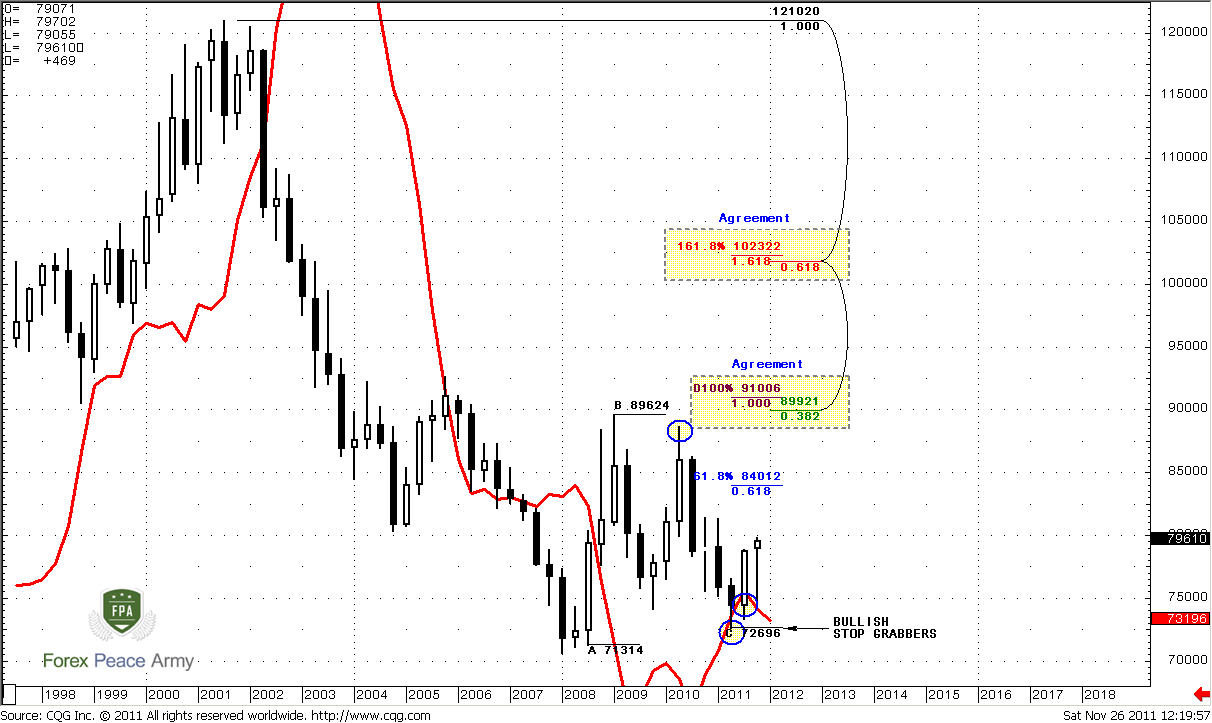
Since market should take out previous highs on Index – it means that it should take previous lows at EUR/USD and the nearest targets that stand below it are – 1.1482 and 1.1657. We can call it as 1.15 area. Still, if we will apply the Fib extension in the same way as on quarterly dollar index, then we will get 1.0 extension target around 1.10. This lets us to make long-term forecast, that we will adjust from time to time based on price action on lower time frames. This forecast is 1.10-1.15 area. So, if you are positional trader and hold positions long-term – that is your nearest destination.
Now let’s focus directly on monthly chart. Trend is bearish, current bar down looks impressive – opens at the high and stands now at the low. Currently we have to be very careful, since we are approaching to monthly Agreement at 1.2905-1.3040 area. Market stands neither on oversold nor at overbought.

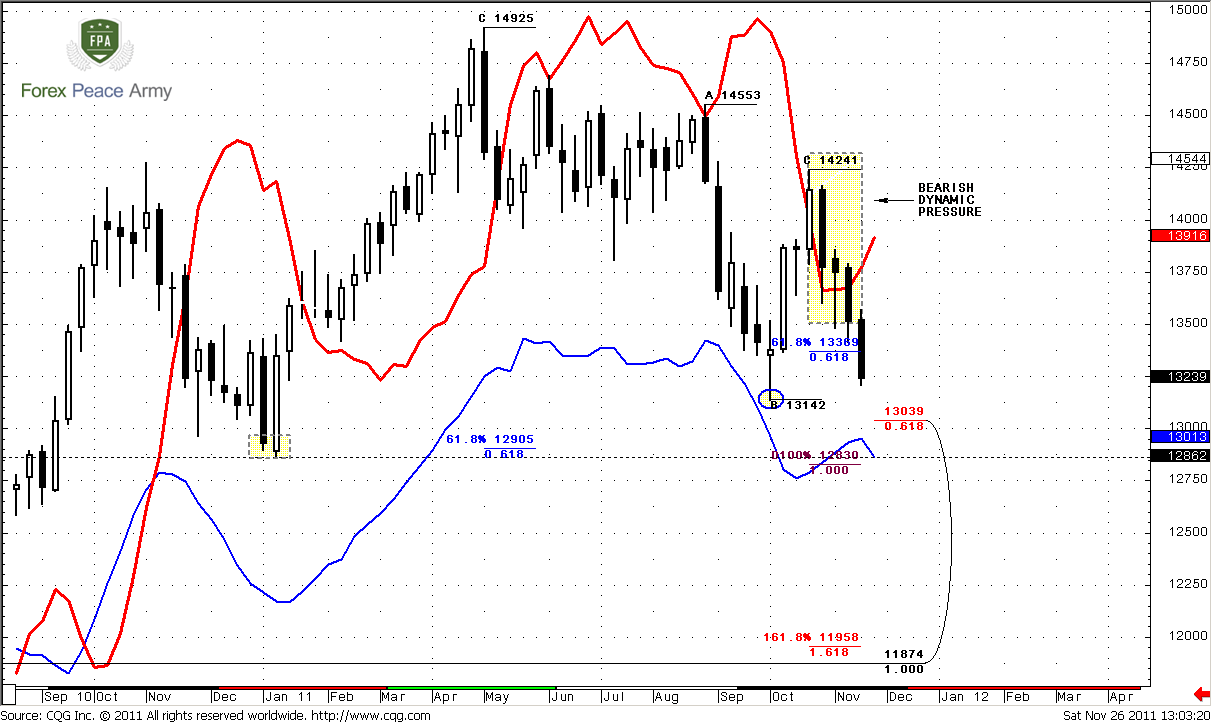
Weekly
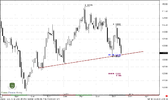
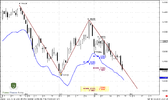
Weekly trend is strongly bearish. We can see how bearish dynamic pressure works. Initially price action does not support trend shifting – next it accelerated down and should take out previous lows. Our major focus in medium-term perspective is most recent AB=CD pattern with target at 1.2830 and weekly oversold – very close to monthly Agreement.
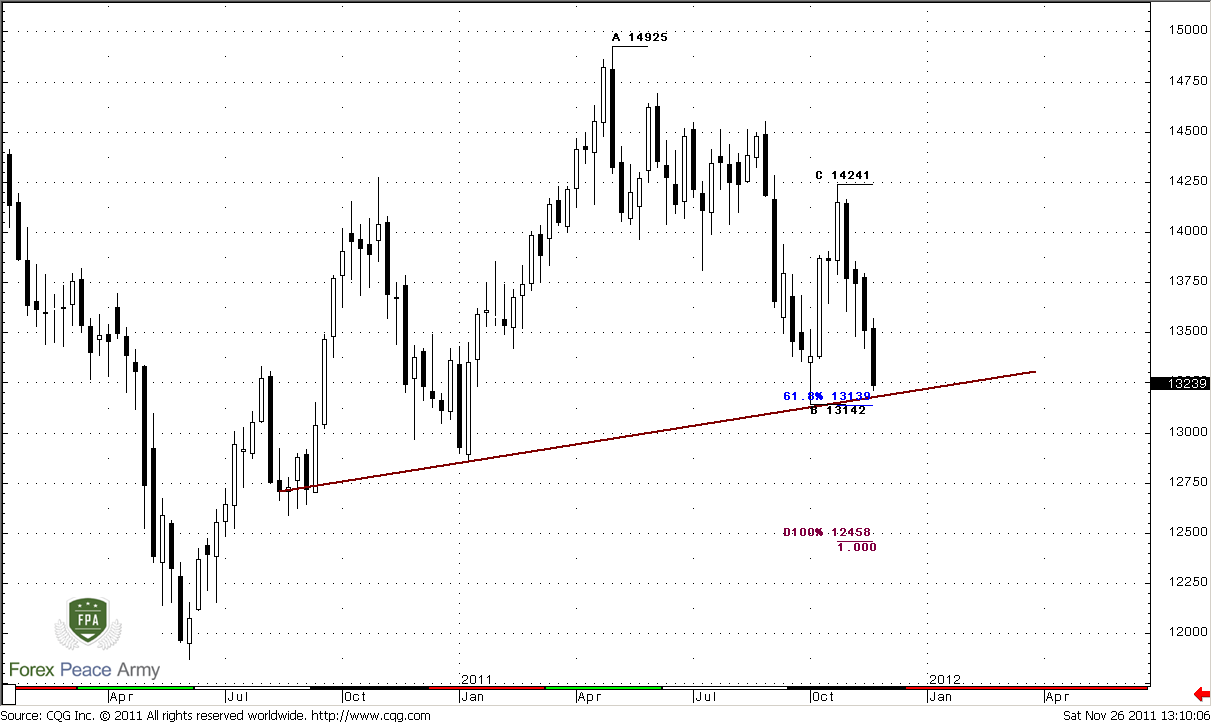
Also I would like to show you a bit different picture – once we already had a look of it. This is not quite H&S pattern, because it looks too skewed and disharmonic. Still, it has something from H&S. It’s nearest target is 1.2458, I suppose:
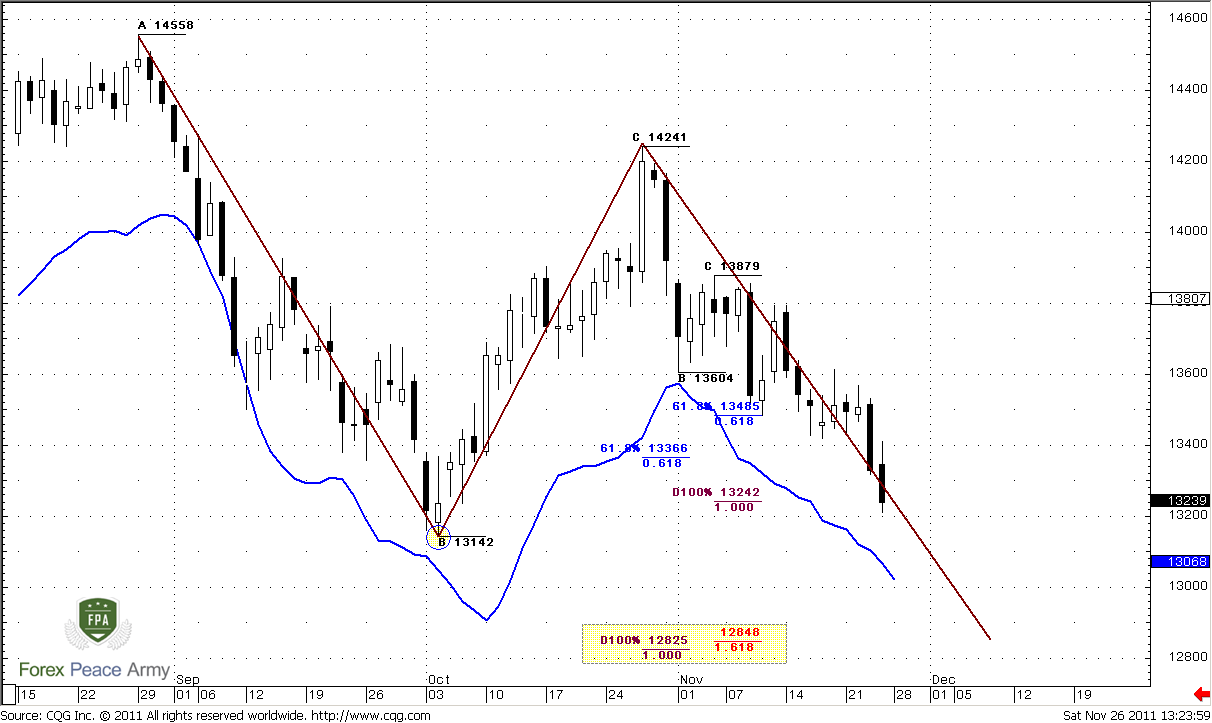
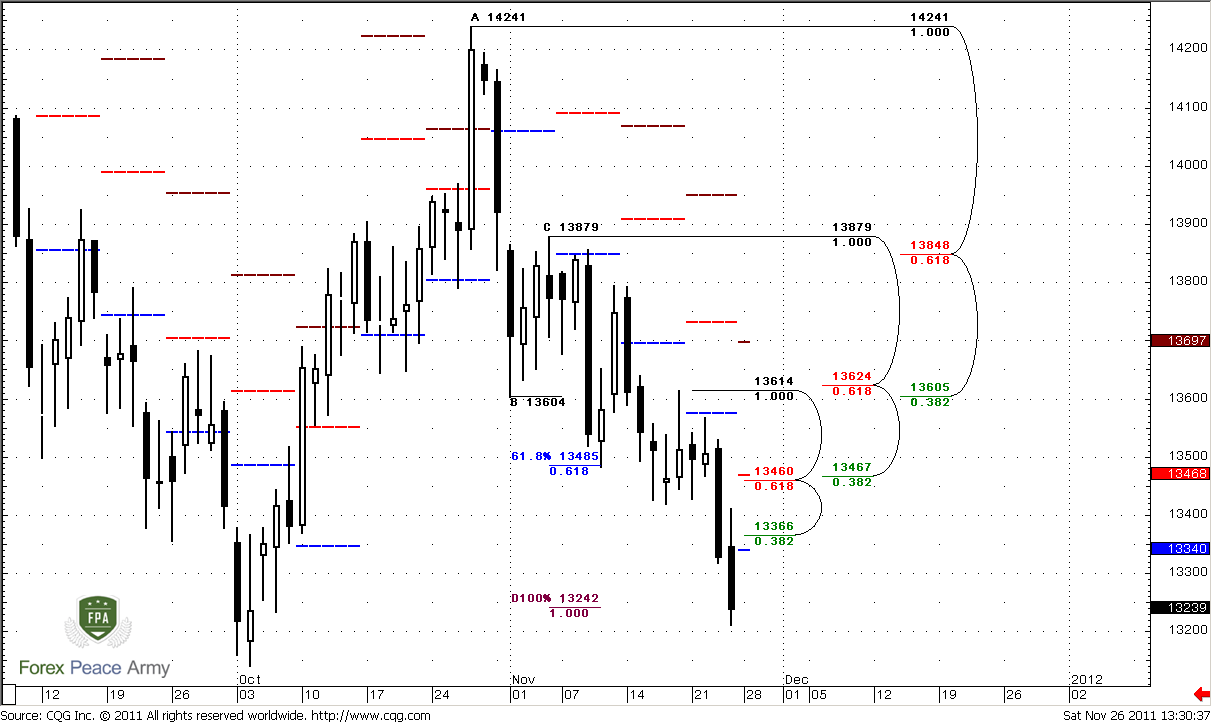
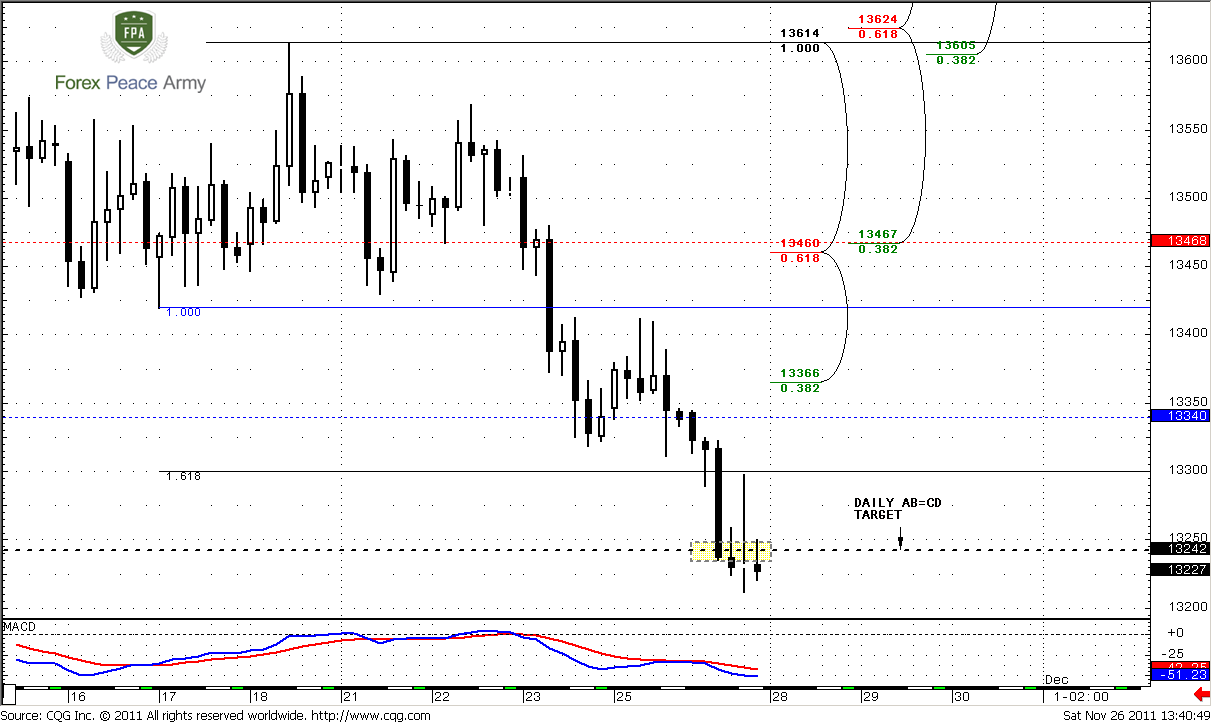
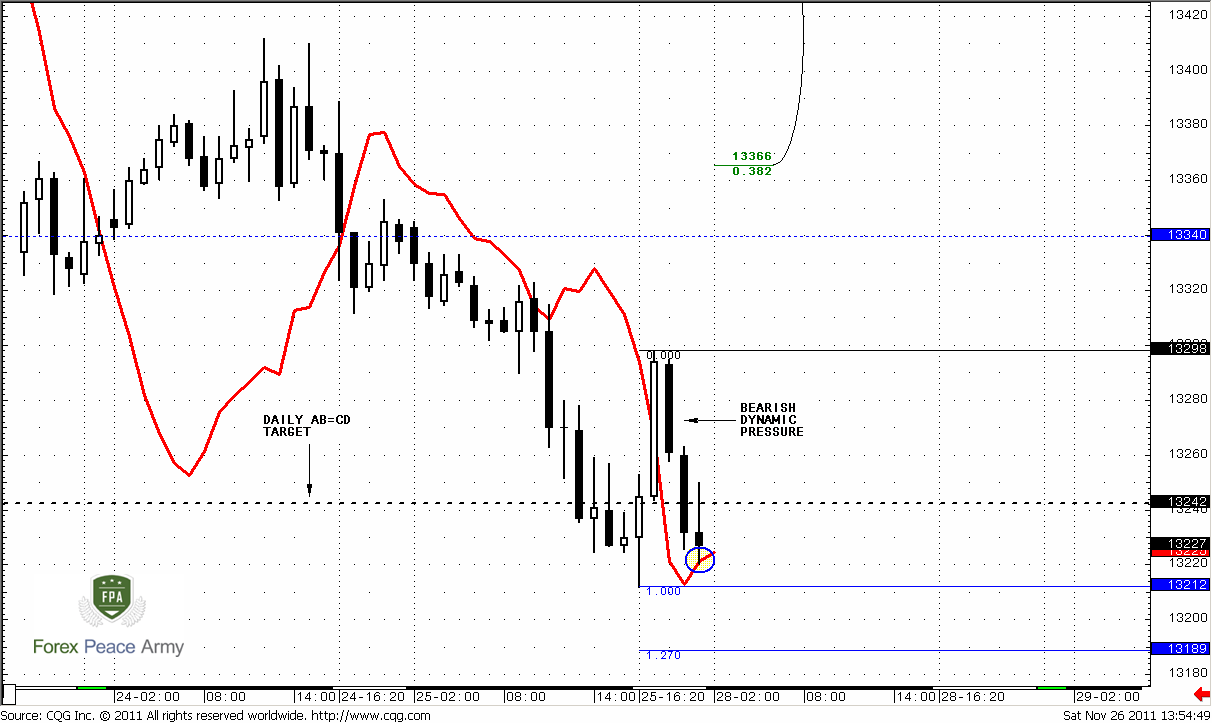
Daily
Daily trend is strongly bearish. Market is not at oversold and theoretically could continue move down, in fact without any barriers. Take a look that weekly AB-CD target stands very close to smaller daily AB-CD 1.618 that we’ve traded during previous couple of weeks. Currently market has hit 1.0 extension of this recent AB-CD at 1.3242, but there are no signs of retracement yet. Will it happen or not – it’s quite difficult to say, especially based on daily time frame. CD leg is strongly bearish, since market has shown just 0.382 retracement or even smaller. Right to 1.3242 target there are two consecutive solid bars down. This sign tells that there will not be any retracement or it will be shallow.
In the beginning of our research I would like to refresh quarterly chart of US Dollar Index. We will return to it from time to time, since it contains our long-term forecast, that we’ve discussed in details here:
https://www.forexpeacearmy.com/fore...pro-weekly-october-31-november-04-2011-a.html
Now we see that this forecast starts to work. In fact it has started to work right after discussion, but this is very long term chart, so to see some effect we need some time to pass. This discussion will be mostly useful for positional traders. We will try to make analogy with EUR/USD chart, since dollar index includes in calculation EUR as much as 56% and relation between Dollar index and EUR is significant (see research mentioned above).
So, here we see nothing more but Gartley “222” buy that coincides with two bullish stop grabbers. Red line is DiNapoli MACD Predictor indicator that shows trend. Currently quarterly trend on dollar index is bullish. Application of simple Fib extensions gives us three targets – 0.618 at 84.012, 1.0 – 91.006 and 1.618 – 102.322. Since this move has started from stop grabbers – they suggest take out of previous highs, that’s why 0.618 extension does not quite suitable for us. Most probable target is Agreement with 0.382 Fib resistance and 91.006 1.0 extension target of AB=CD pattern. Extended target is also an Agreement with 102.322 and 0.618 Fib resistance, but we can’t definitely say anything about it. Possible it could be reached, but we need to see how price action will develop, while target around 91.00 should be reached based on patterns that already have been formed. What level on EUR/USD is matched to 91.00 on dollar index?
Since market should take out previous highs on Index – it means that it should take previous lows at EUR/USD and the nearest targets that stand below it are – 1.1482 and 1.1657. We can call it as 1.15 area. Still, if we will apply the Fib extension in the same way as on quarterly dollar index, then we will get 1.0 extension target around 1.10. This lets us to make long-term forecast, that we will adjust from time to time based on price action on lower time frames. This forecast is 1.10-1.15 area. So, if you are positional trader and hold positions long-term – that is your nearest destination.
Now let’s focus directly on monthly chart. Trend is bearish, current bar down looks impressive – opens at the high and stands now at the low. Currently we have to be very careful, since we are approaching to monthly Agreement at 1.2905-1.3040 area. Market stands neither on oversold nor at overbought.
Weekly
Weekly trend is strongly bearish. We can see how bearish dynamic pressure works. Initially price action does not support trend shifting – next it accelerated down and should take out previous lows. Our major focus in medium-term perspective is most recent AB=CD pattern with target at 1.2830 and weekly oversold – very close to monthly Agreement.
Also I would like to show you a bit different picture – once we already had a look of it. This is not quite H&S pattern, because it looks too skewed and disharmonic. Still, it has something from H&S. It’s nearest target is 1.2458, I suppose:
Daily
Daily trend is strongly bearish. Market is not at oversold and theoretically could continue move down, in fact without any barriers. Take a look that weekly AB-CD target stands very close to smaller daily AB-CD 1.618 that we’ve traded during previous couple of weeks. Currently market has hit 1.0 extension of this recent AB-CD at 1.3242, but there are no signs of retracement yet. Will it happen or not – it’s quite difficult to say, especially based on daily time frame. CD leg is strongly bearish, since market has shown just 0.382 retracement or even smaller. Right to 1.3242 target there are two consecutive solid bars down. This sign tells that there will not be any retracement or it will be shallow.
Attachments
Last edited by a moderator:
 rubbing my hands ..