Sive Morten
Special Consultant to the FPA
- Messages
- 18,669
Fundamentals
This week market has shown mixed performance and if you surf on news you'll see all new, related to gold market this week are about coronavirus. It was few updates through the week and gold market was a ping-pong action trying to catch them. Somebody tells that virus situation becomes better - gold goes down. Next day they tell that situation becomes tougher - gold goes up. And that through the whole week. When we see behavior of this kind, we could say only one thing - market stands indecision and doesn't follow to longer-term fundamental background as speculators try to extract maximum from sensitivity to virus topic and shake the market. This makes difficult to take reasonable trades there and find at least some logical trading setup in this mess.
Finally, gold prices rose to the highest level in more than a week on Friday, on track for a weekly gain, as investors bet on the safe-haven metal to hedge against the economic impact of the coronavirus outbreak.
“The coronavirus scenario is still unclear and the on-off headlines on the situation are making the stock markets volatile, forcing investors to take refuge in safe-haven gold,” said George Gero, managing director at RBC Wealth Management. “Even with the virus gone, gold is expected to trade in the $1,550-$1,600 range as other uncertainties like lower interest rates across the major central banks, Middle East tensions and other political risks still exist.”
Chinese authorities on Thursday reported 121 new deaths and 5,000 new coronavirus cases in mainland China, and economists scaled back growth expectations for the world’s second-largest economy as they assessed the impact of the outbreak.
Global stock markets have had a volatile week as investors took and quit positions in riskier assets driven by the frequently changing headlines around China’s coronavirus outbreak.Wall Street opened slightly higher, with gains kept in check by concerns about the economic hit from the outbreak.
Further supporting gold’s rise, U.S. Treasury yields declined after soft retail sales data amid virus concerns.
U.S. consumer spending appears to have slowed further in January, which raises concerns about the economy’s ability to continue expanding at a moderate pace.
“We still target a decline in U.S. Treasury yields, in addition to dollar weakness from a trade-weighted angle. We believe this gives gold a good risk-reward even if we see no further bouts in equity market uncertainty,” UBS analysts said in a note.
A leap in coronavirus cases in Hubei gave markets pause - for all of 24 hours. Then attention shifted back to the global case-count and the rally resumed. But while investors are focused on containment, the world’s second-biggest economy is idling. President Xi Jinping may have urged officials to refrain from “more restrictive measures,” to limit the economic fallout but that’s happening anyway. Steel mills lack supplies for want of drivers. Empty restaurants are throwing out food, while out at sea, freighters are scrambling to re-route perishables, including several hundred containers of chilled chicken feet. Automaker GAC allows only half its employees to work each day at its Guangzhou headquarters, and it’s a similar story at many other firms.
Hope rests on the central bank, which has shaved 10 basis points off the interest rate on reverse repurchase agreements. A trillion yuan in reverse repos mature on Monday - a chance for the PBOC to keep money markets awash with cash. That money could become even cheaper should the benchmark lending rate be cut again on Feb. 20. So virus or no virus, Chinese shares which have almost recouped last Monday’s falls, could continue to cruise higher.
CFTC Data
Net long position on gold market stands near all time highs, although has stepped out a bit from the top. Holdings of the world’s largest gold-backed exchange-traded fund, SPDR Gold Trust, rose 0.67% to 922.23 tonnes on Tuesday, the highest in over three months.

Let's step out a bit from virus topic - sooner or later it will over and take a look at some fundamental factors that could appear on horizon in nearest time. For example, what could happen after US-China "Phase1" deal? At first glance, it seems that "Phase 2" should be as deadly for Chinese economy as Phase 1 and continue improving of US trade balance, imposing more tariffs. But, as Fathom consulting suggests - situation could be different when we talk about 5G and technology sector.
In the new article Sino-US trade – from deficits to technology Fathom talks about this situation. Here is just few extraction from it:
The question is: what happens moving forward? Tariffs have reduced the US trade deficit with China, and agreements as part of the ‘Phase 1’ trade deal may reduce this further. However, when it comes to advanced technology, there is little reason to think that tensions will ease completely anytime soon.
Part of the reason why increased Sino-US trade led to increased tensions was that the flows were not evenly balanced – far from it. Exports from China to the US increased much more rapidly than exports from the US to China. As a result, the US trade deficit with China steadily increased. Indeed, China accounted for 20% of the overall US trade deficit in 2000, rising to 48% by 2015. There is nothing intrinsically bad about having a large trade deficit. However, the benefits derived from imports, such as lower prices and a more varied selection of goods, tend to less noticeable, by people and politicians, than the benefits derived from exports. Most of the commitments agreed as part of the ‘Phase 1’ trade deal appear intended to unwind some of the trade imbalance.

The previous China trade shock hit relatively unsophisticated exports. However, plans under the ‘Made in China 2025’ programme point to a focus on advanced exports, such as aerospace and robotics, in which the US is the current world leader. Fathom Consulting’s ‘Made in China’ database, which is available on Datastream, tracks progress in these sectors. As the chart below shows, improvement has been slow. Nonetheless, authorities in Beijing appear committed to the plan and therefore likely to invest funds in the programme, risking a backlash abroad. Recent warnings from Washington DC about Huawei’s role in 5G networks may offer a taste of what is ahead. Having experienced a China trade shock already, the US appears to be on the defensive this time around.
So, the conclusion that we could make on current situation is not very fascinating. Gold market ignores fundamentals and mostly are vibrated by virus news headlines. This promises nothing good to trading process. Situation changes every day and gold has too small time to form/complete some pattern. Besides, patterns usually are based on solid background, when market is choosing the direction. While gold has no direction in short-term period. It means two things. First, we probably have to postpone our idea of deeper retracement by far. Just because gold stands tight on expectation any news that virus situation becomes worse. Second - we can't plan any trades on daily and higher time frames by far due the same reason. It seems that gold will stay in wide weekly range a bit longer than we've suggested initially.
Technical
Monthly
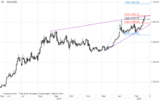
Monthly chart keeps bullish scenario while gold has a magnet here - major XOP around 1655. Trend stands bullish. While price still stands in January range, it gradually comes to the upper border.
As we've said last time - "as coronavirus panic comes on the first stage, we have to review our priorities and put normal factors on the second one. In current situation we have to acknowledge that indeed, reaching of 1650-1655 XOP is possible, at least when weekly overbought condition will let it to do. Total overbought on gold is not a barrier by far as panic driver is stronger. That's being said, now we have to postpone our idea of healthy retracement as overall background has changed."
Normal driving factors will work some time when situation will calm down a bit. As more extended downside target, if somehow it will happen - we could point YPP at 1445 area.

Weekly
Although we've skipped previous report, replaced it by GBP analysis - but overall picture has not changed. This week is inside one and a bit useless for the chart.
There are two major things stand here - huge doji pattern and failed downside breakout of its range. Indeed market moves higher, but this action is slow. Too large net long position on gold makes difficult upside acceleration. This probably could happen only if something outstanding will happen on virus situation.
As overbought level drifts higher and lower border already has been tested - it is logical to suggest the test of upper border and the 1611 top. Potentially gold could try to hit monthly 1655 target as it stands not too far from weekly overbought level. Trend stands bullish here, but market doesn't show any valuable patterns on this chart.

Daily
The only pattern that we could consider now stands here, on daily chart. This is "222" Sell that we've mentioned earlier. But this pattern has few weaknesses. First is - no additional resistance exists. As you can see major 5/8 Fib level already has been broken earlier. So, we have only upside AB-CD target, but no other additional resistance here.
Second - taking in consideration overall nervousness on the market due virus, we can't count on major reversal due this pattern. Hardly this is possible in current situation. It means that we could consider only 3/8 pullback.
And the last one. As price stands around MACDP line, and we do not have any additional resistance, maybe it makes sense to get additional bearish signal, in a company to "222" pattern. Existing of grabber and "222" at once should give us more confidence for position taking.

Intraday
Our battlefield stands on 4H chart. And it seems that next week we spend here. As gold has failed proceed lower and cancelled bearish scenario - now we have the only one direction - up. But how far?
Strong acceleration right to the triangle's border and existence of extended bullish MACD divergence suggest upside breakout attempt. OP target stands around 1590, but the tricky moment is OP very close to the previous top and invalidation point of "222" Sell. Since market has not resistance - it easily could turn shape to butterfly with 1605 target. As you understand - it will be tough decision to Sell at OP. Especially when targets stand at 1580 and 1575 level - not very impressive reward, right?
That's being said - chances exist to trade market. As on "222" pattern as later on potential Butterfly "Sell". But both setups demand additional control through 5-15 min charts. Try to get clear bearish reversal pattern on 5-min chart, if you intend to sell at OP. If OP will be ignored - selling at butterfly target is relatively safe. At least 30% pullback should happen.

Conclusion:
Major driving factors on gold still exist and sooner or later will make impact and trigger some relief action. But now they take a backseat as coronavirus panic shifts markets across the board and makes gold to climb higher. This makes us to review short-term scenario and agree that gold indeed could as re-test recent 1611 highs as try to hit monthly 1655 major target.
As a result, on short-term charts market almost has no direction and we have to consider intraday trading setups. To trade it will be rather difficult task.
This week market has shown mixed performance and if you surf on news you'll see all new, related to gold market this week are about coronavirus. It was few updates through the week and gold market was a ping-pong action trying to catch them. Somebody tells that virus situation becomes better - gold goes down. Next day they tell that situation becomes tougher - gold goes up. And that through the whole week. When we see behavior of this kind, we could say only one thing - market stands indecision and doesn't follow to longer-term fundamental background as speculators try to extract maximum from sensitivity to virus topic and shake the market. This makes difficult to take reasonable trades there and find at least some logical trading setup in this mess.
Finally, gold prices rose to the highest level in more than a week on Friday, on track for a weekly gain, as investors bet on the safe-haven metal to hedge against the economic impact of the coronavirus outbreak.
“The coronavirus scenario is still unclear and the on-off headlines on the situation are making the stock markets volatile, forcing investors to take refuge in safe-haven gold,” said George Gero, managing director at RBC Wealth Management. “Even with the virus gone, gold is expected to trade in the $1,550-$1,600 range as other uncertainties like lower interest rates across the major central banks, Middle East tensions and other political risks still exist.”
Chinese authorities on Thursday reported 121 new deaths and 5,000 new coronavirus cases in mainland China, and economists scaled back growth expectations for the world’s second-largest economy as they assessed the impact of the outbreak.
Global stock markets have had a volatile week as investors took and quit positions in riskier assets driven by the frequently changing headlines around China’s coronavirus outbreak.Wall Street opened slightly higher, with gains kept in check by concerns about the economic hit from the outbreak.
Further supporting gold’s rise, U.S. Treasury yields declined after soft retail sales data amid virus concerns.
U.S. consumer spending appears to have slowed further in January, which raises concerns about the economy’s ability to continue expanding at a moderate pace.
“We still target a decline in U.S. Treasury yields, in addition to dollar weakness from a trade-weighted angle. We believe this gives gold a good risk-reward even if we see no further bouts in equity market uncertainty,” UBS analysts said in a note.
A leap in coronavirus cases in Hubei gave markets pause - for all of 24 hours. Then attention shifted back to the global case-count and the rally resumed. But while investors are focused on containment, the world’s second-biggest economy is idling. President Xi Jinping may have urged officials to refrain from “more restrictive measures,” to limit the economic fallout but that’s happening anyway. Steel mills lack supplies for want of drivers. Empty restaurants are throwing out food, while out at sea, freighters are scrambling to re-route perishables, including several hundred containers of chilled chicken feet. Automaker GAC allows only half its employees to work each day at its Guangzhou headquarters, and it’s a similar story at many other firms.
Hope rests on the central bank, which has shaved 10 basis points off the interest rate on reverse repurchase agreements. A trillion yuan in reverse repos mature on Monday - a chance for the PBOC to keep money markets awash with cash. That money could become even cheaper should the benchmark lending rate be cut again on Feb. 20. So virus or no virus, Chinese shares which have almost recouped last Monday’s falls, could continue to cruise higher.
CFTC Data
Net long position on gold market stands near all time highs, although has stepped out a bit from the top. Holdings of the world’s largest gold-backed exchange-traded fund, SPDR Gold Trust, rose 0.67% to 922.23 tonnes on Tuesday, the highest in over three months.
Let's step out a bit from virus topic - sooner or later it will over and take a look at some fundamental factors that could appear on horizon in nearest time. For example, what could happen after US-China "Phase1" deal? At first glance, it seems that "Phase 2" should be as deadly for Chinese economy as Phase 1 and continue improving of US trade balance, imposing more tariffs. But, as Fathom consulting suggests - situation could be different when we talk about 5G and technology sector.
In the new article Sino-US trade – from deficits to technology Fathom talks about this situation. Here is just few extraction from it:
The question is: what happens moving forward? Tariffs have reduced the US trade deficit with China, and agreements as part of the ‘Phase 1’ trade deal may reduce this further. However, when it comes to advanced technology, there is little reason to think that tensions will ease completely anytime soon.
Part of the reason why increased Sino-US trade led to increased tensions was that the flows were not evenly balanced – far from it. Exports from China to the US increased much more rapidly than exports from the US to China. As a result, the US trade deficit with China steadily increased. Indeed, China accounted for 20% of the overall US trade deficit in 2000, rising to 48% by 2015. There is nothing intrinsically bad about having a large trade deficit. However, the benefits derived from imports, such as lower prices and a more varied selection of goods, tend to less noticeable, by people and politicians, than the benefits derived from exports. Most of the commitments agreed as part of the ‘Phase 1’ trade deal appear intended to unwind some of the trade imbalance.
The previous China trade shock hit relatively unsophisticated exports. However, plans under the ‘Made in China 2025’ programme point to a focus on advanced exports, such as aerospace and robotics, in which the US is the current world leader. Fathom Consulting’s ‘Made in China’ database, which is available on Datastream, tracks progress in these sectors. As the chart below shows, improvement has been slow. Nonetheless, authorities in Beijing appear committed to the plan and therefore likely to invest funds in the programme, risking a backlash abroad. Recent warnings from Washington DC about Huawei’s role in 5G networks may offer a taste of what is ahead. Having experienced a China trade shock already, the US appears to be on the defensive this time around.
So, the conclusion that we could make on current situation is not very fascinating. Gold market ignores fundamentals and mostly are vibrated by virus news headlines. This promises nothing good to trading process. Situation changes every day and gold has too small time to form/complete some pattern. Besides, patterns usually are based on solid background, when market is choosing the direction. While gold has no direction in short-term period. It means two things. First, we probably have to postpone our idea of deeper retracement by far. Just because gold stands tight on expectation any news that virus situation becomes worse. Second - we can't plan any trades on daily and higher time frames by far due the same reason. It seems that gold will stay in wide weekly range a bit longer than we've suggested initially.
Technical
Monthly
Monthly chart keeps bullish scenario while gold has a magnet here - major XOP around 1655. Trend stands bullish. While price still stands in January range, it gradually comes to the upper border.
As we've said last time - "as coronavirus panic comes on the first stage, we have to review our priorities and put normal factors on the second one. In current situation we have to acknowledge that indeed, reaching of 1650-1655 XOP is possible, at least when weekly overbought condition will let it to do. Total overbought on gold is not a barrier by far as panic driver is stronger. That's being said, now we have to postpone our idea of healthy retracement as overall background has changed."
Normal driving factors will work some time when situation will calm down a bit. As more extended downside target, if somehow it will happen - we could point YPP at 1445 area.
Weekly
Although we've skipped previous report, replaced it by GBP analysis - but overall picture has not changed. This week is inside one and a bit useless for the chart.
There are two major things stand here - huge doji pattern and failed downside breakout of its range. Indeed market moves higher, but this action is slow. Too large net long position on gold makes difficult upside acceleration. This probably could happen only if something outstanding will happen on virus situation.
As overbought level drifts higher and lower border already has been tested - it is logical to suggest the test of upper border and the 1611 top. Potentially gold could try to hit monthly 1655 target as it stands not too far from weekly overbought level. Trend stands bullish here, but market doesn't show any valuable patterns on this chart.
Daily
The only pattern that we could consider now stands here, on daily chart. This is "222" Sell that we've mentioned earlier. But this pattern has few weaknesses. First is - no additional resistance exists. As you can see major 5/8 Fib level already has been broken earlier. So, we have only upside AB-CD target, but no other additional resistance here.
Second - taking in consideration overall nervousness on the market due virus, we can't count on major reversal due this pattern. Hardly this is possible in current situation. It means that we could consider only 3/8 pullback.
And the last one. As price stands around MACDP line, and we do not have any additional resistance, maybe it makes sense to get additional bearish signal, in a company to "222" pattern. Existing of grabber and "222" at once should give us more confidence for position taking.
Intraday
Our battlefield stands on 4H chart. And it seems that next week we spend here. As gold has failed proceed lower and cancelled bearish scenario - now we have the only one direction - up. But how far?
Strong acceleration right to the triangle's border and existence of extended bullish MACD divergence suggest upside breakout attempt. OP target stands around 1590, but the tricky moment is OP very close to the previous top and invalidation point of "222" Sell. Since market has not resistance - it easily could turn shape to butterfly with 1605 target. As you understand - it will be tough decision to Sell at OP. Especially when targets stand at 1580 and 1575 level - not very impressive reward, right?
That's being said - chances exist to trade market. As on "222" pattern as later on potential Butterfly "Sell". But both setups demand additional control through 5-15 min charts. Try to get clear bearish reversal pattern on 5-min chart, if you intend to sell at OP. If OP will be ignored - selling at butterfly target is relatively safe. At least 30% pullback should happen.
Conclusion:
Major driving factors on gold still exist and sooner or later will make impact and trigger some relief action. But now they take a backseat as coronavirus panic shifts markets across the board and makes gold to climb higher. This makes us to review short-term scenario and agree that gold indeed could as re-test recent 1611 highs as try to hit monthly 1655 major target.
As a result, on short-term charts market almost has no direction and we have to consider intraday trading setups. To trade it will be rather difficult task.