acetraderfx
AceTrader.com Representative
- Messages
- 1,109
DAILY USD/CHF TECHNICAL OUTLOOK
Last Update At 26 Mar 2014 02:16GMT
Trend Daily Chart
Sideways
Daily Indicators
Turning up
21 HR EMA
0.8830
55 HR EMA
0.8827
Trend Hourly Chart
Sideways
Hourly Indicators
Neutral
13 HR RSI
53
14 HR DMI
+ve
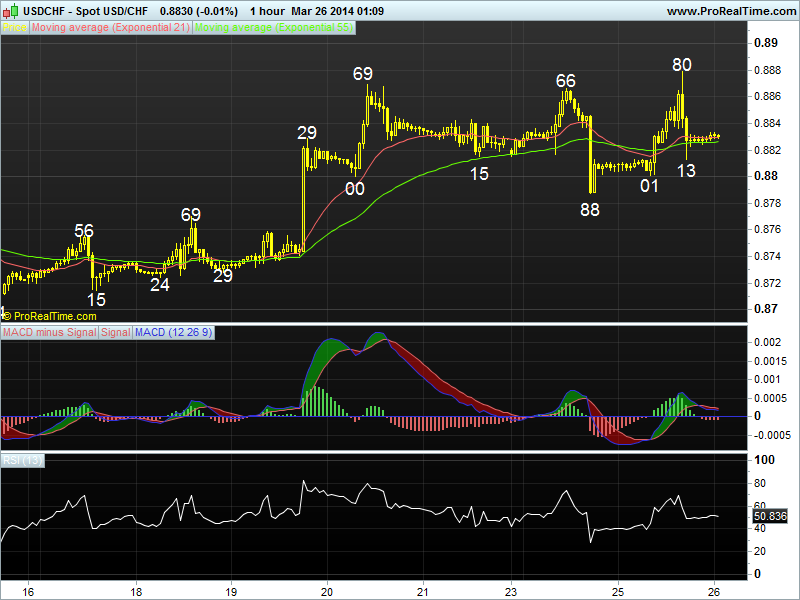
Daily Analysis
Consolidation with downside bias
Resistance
0.8930 - Feb 26 high
0.8895 - Mar 05 high
0.8880 - Y'day's high
Support
0.8788 - Mon's low
0.8769 - Last Tue's high, now sup
0.8729 - Last Wed's Aust. low
. USD/CHF - 0.8845... The greenback swung fm gains to losses in choppy trading
on Tuesday. Despite rising steadily in Europe n a brief break above last week's
high of 0.8869 to 0.8880 in NY due to weakness in eur/usd, intra-day rebound in
euro led to long liquidation in dlr n price retreated strongly to 0.8813.
. Despite dlr's aforesaid rise to a 2-week high of 0.8880, as this lvl was
accompanied by prominent 'bearish divergences' on the hourly oscillators, subse-
quent decline to 0.8813 suggests recent erratic upmove fm Mar's fresh 2-year
trough at 0.8698 has possibly made a temporary top there n 1-2 days of consolida
tion with downside bias is in store, breach of 0.8788 sup wud add credence to
this view, then further weakness to 0.8768 (61.8% r of 0.8698-0.8880) wud follow
, however, below 0.8733 (80.9% r) needed to signal correction is over n yield
re-test of 0.8698 later next week.
. In view of abv analysis, we're turning short on dlr on intra-day recovery
in anticipation of initial weakness twd 0.8788 with stop abv said Tue's high, as
break there wud risk marginal gain to 0.8890/95, however, loss of upward momen-
tum shud prevent strg gain today n daily res at 0.8930 shud remain intact.
Last Update At 26 Mar 2014 02:16GMT
Trend Daily Chart
Sideways
Daily Indicators
Turning up
21 HR EMA
0.8830
55 HR EMA
0.8827
Trend Hourly Chart
Sideways
Hourly Indicators
Neutral
13 HR RSI
53
14 HR DMI
+ve
Daily Analysis
Consolidation with downside bias
Resistance
0.8930 - Feb 26 high
0.8895 - Mar 05 high
0.8880 - Y'day's high
Support
0.8788 - Mon's low
0.8769 - Last Tue's high, now sup
0.8729 - Last Wed's Aust. low
. USD/CHF - 0.8845... The greenback swung fm gains to losses in choppy trading
on Tuesday. Despite rising steadily in Europe n a brief break above last week's
high of 0.8869 to 0.8880 in NY due to weakness in eur/usd, intra-day rebound in
euro led to long liquidation in dlr n price retreated strongly to 0.8813.
. Despite dlr's aforesaid rise to a 2-week high of 0.8880, as this lvl was
accompanied by prominent 'bearish divergences' on the hourly oscillators, subse-
quent decline to 0.8813 suggests recent erratic upmove fm Mar's fresh 2-year
trough at 0.8698 has possibly made a temporary top there n 1-2 days of consolida
tion with downside bias is in store, breach of 0.8788 sup wud add credence to
this view, then further weakness to 0.8768 (61.8% r of 0.8698-0.8880) wud follow
, however, below 0.8733 (80.9% r) needed to signal correction is over n yield
re-test of 0.8698 later next week.
. In view of abv analysis, we're turning short on dlr on intra-day recovery
in anticipation of initial weakness twd 0.8788 with stop abv said Tue's high, as
break there wud risk marginal gain to 0.8890/95, however, loss of upward momen-
tum shud prevent strg gain today n daily res at 0.8930 shud remain intact.
Last edited by a moderator: