Sive Morten
Special Consultant to the FPA
- Messages
- 18,695
Monthly
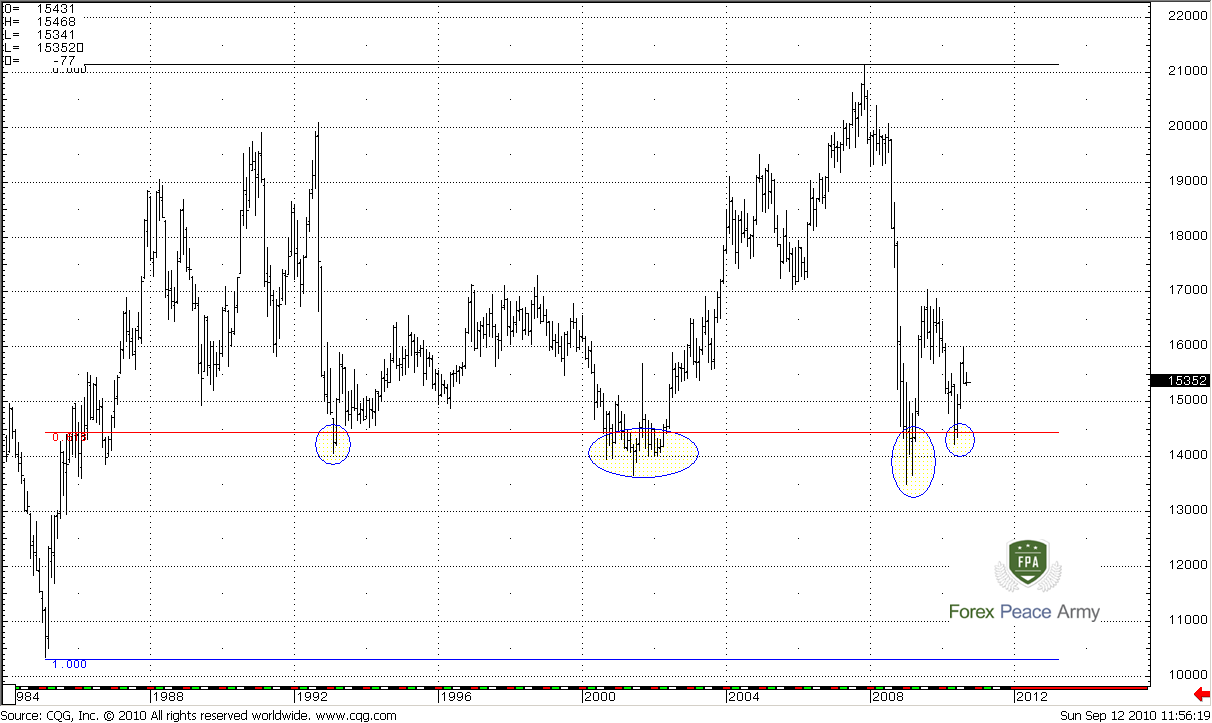
In the beginning of analysis let’s take a look at really big picture - compressed monthly chart. I just want to show you that since 1980’s 1.35-1.40 area gives market a support. This 0.618 support from all time low in 1985 at 1.0345. For the first look it seems, that market deeply penetrated this level during first two touches, but take into account, that previous high was around 2.0, so this level also was a bit lower… It gives us very important fact – market at strong all time support area which is major 0.618 level of Fib support.
Monthly#1
Now let’s shift to shorter picture. I have to indicator lines here – the red line is MACD Predictor, that shows trend and now monthly trend is bullish (price is above the red line). The blue line – Oscillator Predictor, it shows that in September level of Oversold is around 1.6623.
During the previous move down, market has reached deep 0.786 Fib support level, turned to the upside, reached 0.618 resistance and started a pull back. The next target, based on ABC-bottom pattern is 61.8% expansion at 1.6422 that coincides with 0.786 deep Fib. resistance level. Also, just above this area – monthly oversold. It makes this area a very strong resistance, and I expect, that market should bounce to the downside from there. If you’ll use your imagination (sense it like home task") ) you can see two patterns that potentially can appear there - Butterfly “Buy” (this is a downside butterfly) and/or triangle.
) you can see two patterns that potentially can appear there - Butterfly “Buy” (this is a downside butterfly) and/or triangle.
MACD Predictor shows that trend remains bullish till 1.4143 in September. Generally speaking, context of possible move to 1.6422 stays intact until market will not break below C- point.
Monthly#2
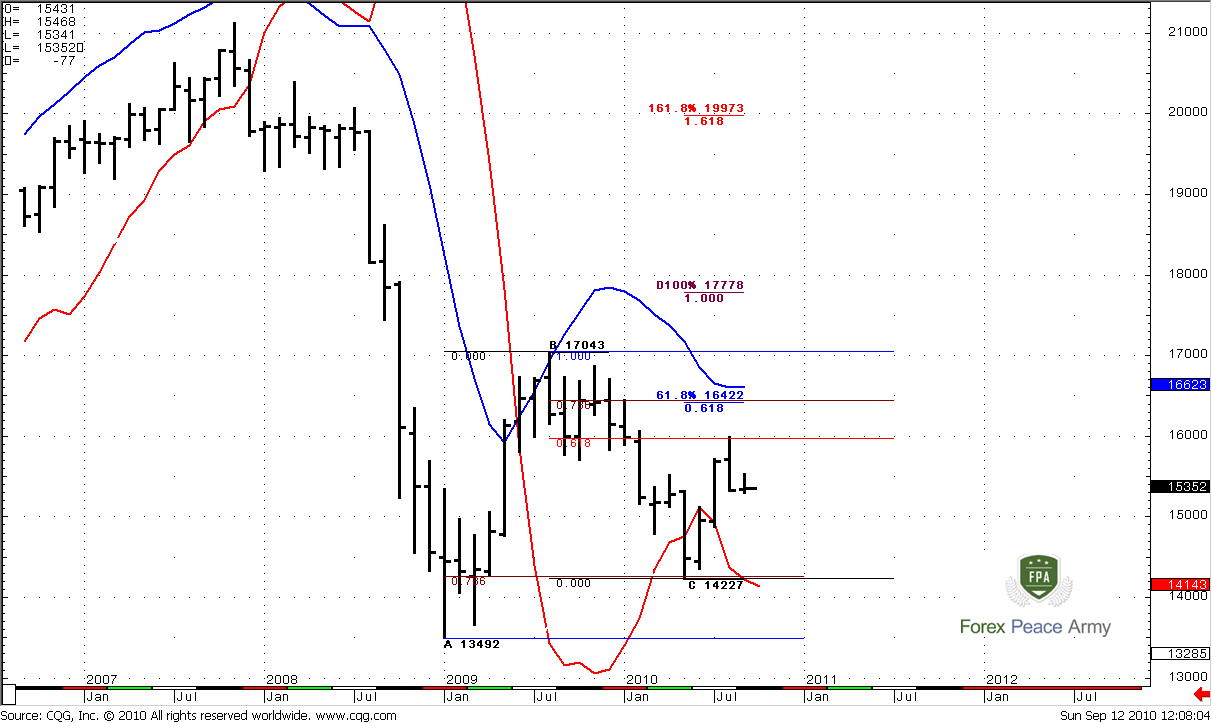
So, currently I think that move to 1.6422 on a monthly time frame is possible. This assumption will be canceled if market will move below 1.4230 area and trend turns bearish. Around 1.6422 price action can turn to Butterfly formation or triangle. But it’s a bit early to talk about.
Weekly
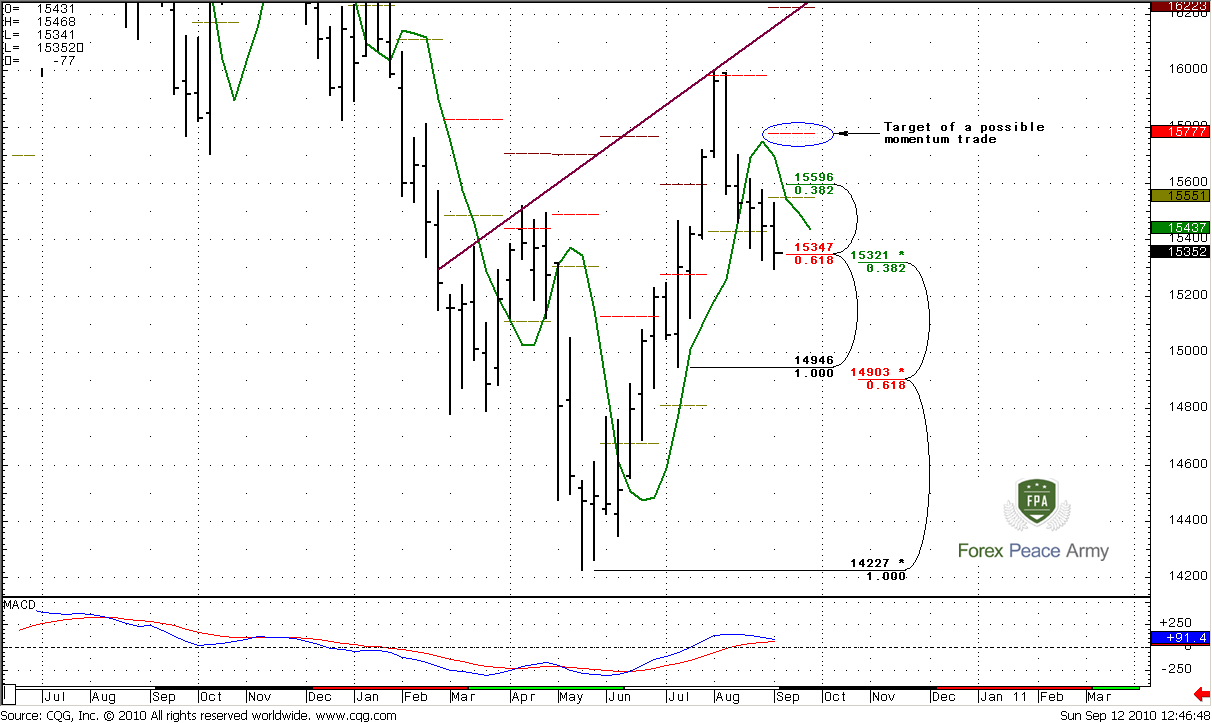
Weekly trend is still bullish, the green line on the chart – 3x3 Displaced Moving Average. Market has shown nice thrust up – 9 consecutive up bars, good separation from 3x3 DMA. Now market has reached strong Fib Confluence support 1.5321-1.5347 and shows 3 closes below 3x3 after penetration. All this stuff is a necessary context for momentum trade. The minimum target of this trade – 1.5750 area – 0.618 Fib resistance (not shown) and monthly pivot resistance 1. At the same time, I do not see any signs of starting up move. I suppose that the possible first sign is an upward breakout of a decreasing channel on daily time frame.
Daily
Daily trend is bearish. There are some important moments on the daily time frame, read it carefully, because it links with weekly possibility of up momentum move. All, that I will say about possible price action on daily has not canceled weekly context. It just adds some very important nuances. So, you need understand my logical chain and how I will link weekly and daily price action, because on the surface it may seem that I will talk both sides of the mouth, but this is not really so.
Ok, this is the first daily chart and red line, yes, MACD Predictor. Also there are 3 horizon lines on it. First two lines mark weekly Fib Confluence support area, and the third one – previous low at 1.5284. Look at two last trading days. You may see, that at the beginning of the day market has turned trend to bullish by moving above MACDP line, but at the end of the day market has not confirmed that and closed below it. It has happened twice. Also take in mind that this was after the reaching of strong weekly support and right after the attempt of upper break out of price channel. So, very probably that some people have taken these Buy signals and entered in the market on Long side. Now, those people have become wrong and trapped in their positions. Where they hide their stops? Right, under the lows – below 1.5284 area. And this is the next target of the market. I expect that before possible start of upward weekly momentum trade market will clear out stops below 1.5284. I suspect wash and rinse of these lows (if you do not know what is W&R – take a look on the my EURO FX weekly research. It has an example of that). Now, I hope you understand the chain of my conclusions that clearing of previous lows, i.e. move down does not cancel the upward weekly move. Ok?
Daily#1
Now, let’s take a look on enlarge fragment of the same daily chart to estimate of possible target of this down move. First of all, take a note, that this should be very short term move below the lows and fast return back. I like to see two parallel bars in opposite direction. Only with this kind of price action we can count on up move. This is a crucial moment for weekly context. If market will break lows and start fall like a stone – this is not my scenario, ok?
Look at this recent AB-CD pattern. It has a target at 1.5244 area. Also there is a weekly pivot support 1 at 1.5223. I think that 1.5240-1.5250 area is a target of possible stop clearing move. From this area market should show fast return in the body of the channel. If market will move above 1.54 weekly pivot point, and this move will be strong enough, then possibly we can possess ourselves for upward weekly move with 1.5750 target, even before the fact of upper break out of the channel.
Daily#2
That’s being said, personally, I will not even think about long position before previous lows will not be taken out by the price. After that, I would like to see fast return in the body of the channel and move above weekly pivot point. Only after that I will think about possibility to enter Long.
Obviously, that if market will break the lows and start to fall like a stone, we should not enter Long and should find another context for trading.
The technical portion of Sive's analysis owes a great deal to Joe DiNapoli's methods, and uses a number of Joe's proprietary indicators. Please note that Sive's analysis is his own view of the market and is not endorsed by Joe DiNapoli or any related companies.
In the beginning of analysis let’s take a look at really big picture - compressed monthly chart. I just want to show you that since 1980’s 1.35-1.40 area gives market a support. This 0.618 support from all time low in 1985 at 1.0345. For the first look it seems, that market deeply penetrated this level during first two touches, but take into account, that previous high was around 2.0, so this level also was a bit lower… It gives us very important fact – market at strong all time support area which is major 0.618 level of Fib support.
Monthly#1
Now let’s shift to shorter picture. I have to indicator lines here – the red line is MACD Predictor, that shows trend and now monthly trend is bullish (price is above the red line). The blue line – Oscillator Predictor, it shows that in September level of Oversold is around 1.6623.
During the previous move down, market has reached deep 0.786 Fib support level, turned to the upside, reached 0.618 resistance and started a pull back. The next target, based on ABC-bottom pattern is 61.8% expansion at 1.6422 that coincides with 0.786 deep Fib. resistance level. Also, just above this area – monthly oversold. It makes this area a very strong resistance, and I expect, that market should bounce to the downside from there. If you’ll use your imagination (sense it like home task
) you can see two patterns that potentially can appear there - Butterfly “Buy” (this is a downside butterfly) and/or triangle. MACD Predictor shows that trend remains bullish till 1.4143 in September. Generally speaking, context of possible move to 1.6422 stays intact until market will not break below C- point.
Monthly#2
So, currently I think that move to 1.6422 on a monthly time frame is possible. This assumption will be canceled if market will move below 1.4230 area and trend turns bearish. Around 1.6422 price action can turn to Butterfly formation or triangle. But it’s a bit early to talk about.
Weekly
Weekly trend is still bullish, the green line on the chart – 3x3 Displaced Moving Average. Market has shown nice thrust up – 9 consecutive up bars, good separation from 3x3 DMA. Now market has reached strong Fib Confluence support 1.5321-1.5347 and shows 3 closes below 3x3 after penetration. All this stuff is a necessary context for momentum trade. The minimum target of this trade – 1.5750 area – 0.618 Fib resistance (not shown) and monthly pivot resistance 1. At the same time, I do not see any signs of starting up move. I suppose that the possible first sign is an upward breakout of a decreasing channel on daily time frame.
Daily
Daily trend is bearish. There are some important moments on the daily time frame, read it carefully, because it links with weekly possibility of up momentum move. All, that I will say about possible price action on daily has not canceled weekly context. It just adds some very important nuances. So, you need understand my logical chain and how I will link weekly and daily price action, because on the surface it may seem that I will talk both sides of the mouth, but this is not really so.
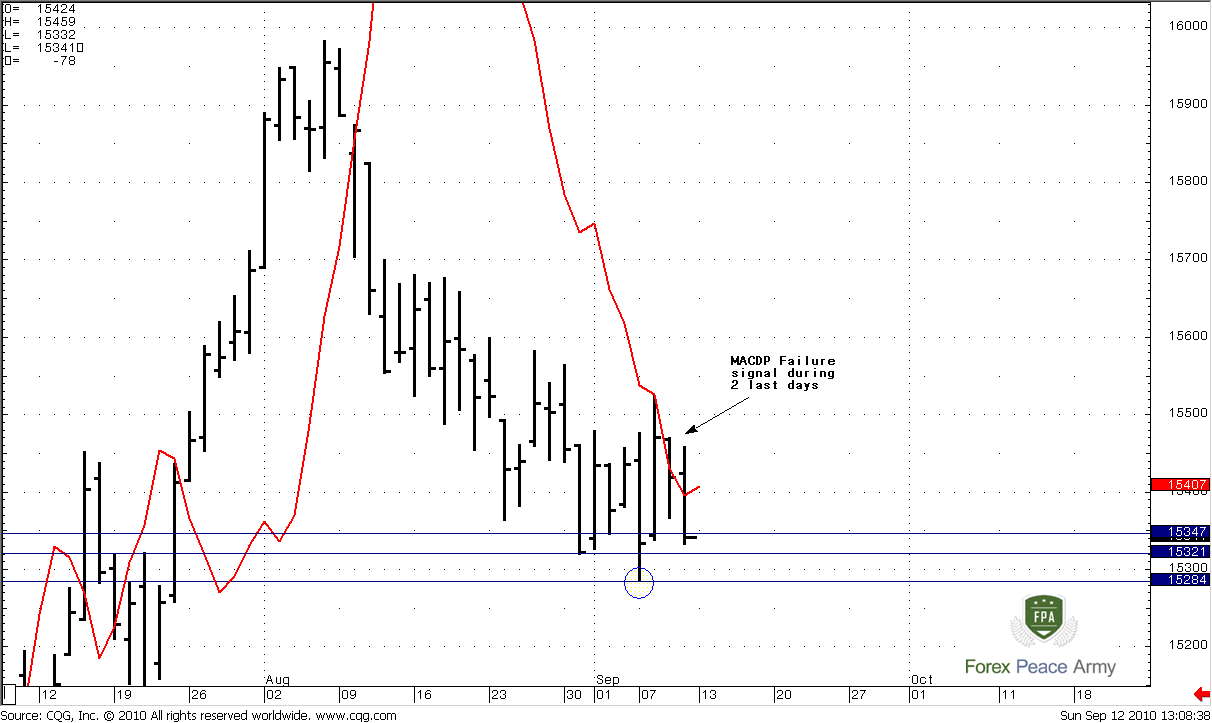
Ok, this is the first daily chart and red line, yes, MACD Predictor. Also there are 3 horizon lines on it. First two lines mark weekly Fib Confluence support area, and the third one – previous low at 1.5284. Look at two last trading days. You may see, that at the beginning of the day market has turned trend to bullish by moving above MACDP line, but at the end of the day market has not confirmed that and closed below it. It has happened twice. Also take in mind that this was after the reaching of strong weekly support and right after the attempt of upper break out of price channel. So, very probably that some people have taken these Buy signals and entered in the market on Long side. Now, those people have become wrong and trapped in their positions. Where they hide their stops? Right, under the lows – below 1.5284 area. And this is the next target of the market. I expect that before possible start of upward weekly momentum trade market will clear out stops below 1.5284. I suspect wash and rinse of these lows (if you do not know what is W&R – take a look on the my EURO FX weekly research. It has an example of that). Now, I hope you understand the chain of my conclusions that clearing of previous lows, i.e. move down does not cancel the upward weekly move. Ok?
Daily#1
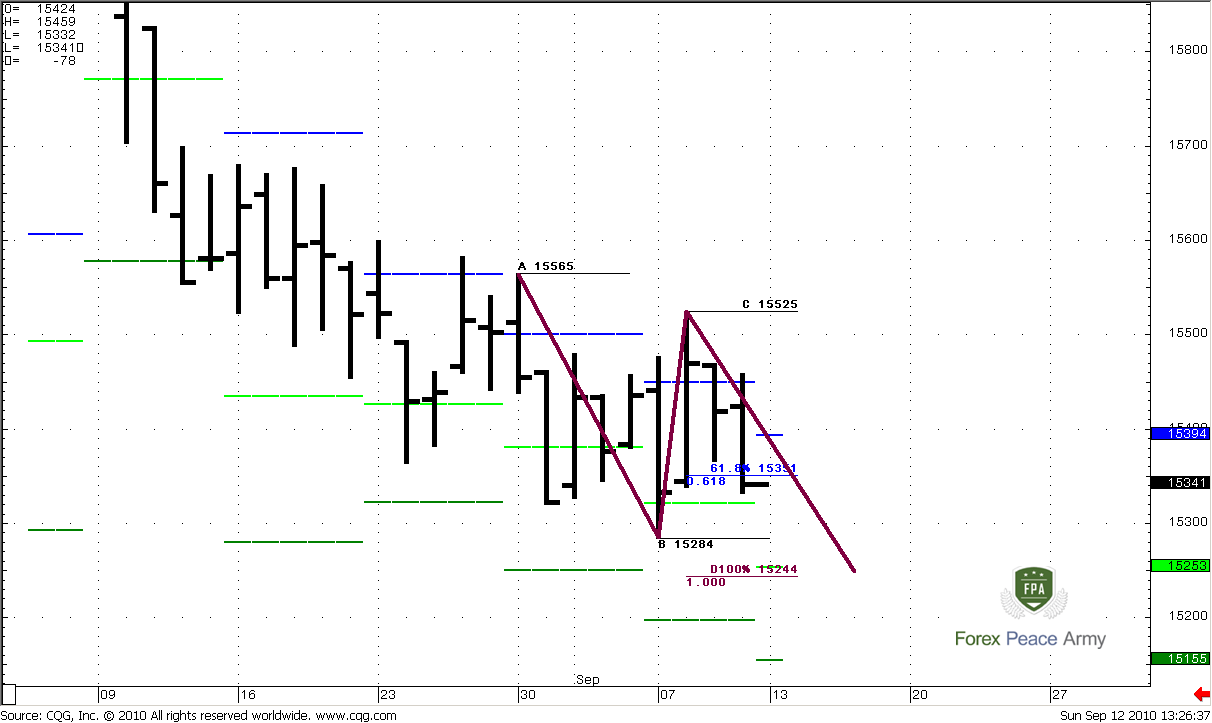
Now, let’s take a look on enlarge fragment of the same daily chart to estimate of possible target of this down move. First of all, take a note, that this should be very short term move below the lows and fast return back. I like to see two parallel bars in opposite direction. Only with this kind of price action we can count on up move. This is a crucial moment for weekly context. If market will break lows and start fall like a stone – this is not my scenario, ok?
Look at this recent AB-CD pattern. It has a target at 1.5244 area. Also there is a weekly pivot support 1 at 1.5223. I think that 1.5240-1.5250 area is a target of possible stop clearing move. From this area market should show fast return in the body of the channel. If market will move above 1.54 weekly pivot point, and this move will be strong enough, then possibly we can possess ourselves for upward weekly move with 1.5750 target, even before the fact of upper break out of the channel.
Daily#2
That’s being said, personally, I will not even think about long position before previous lows will not be taken out by the price. After that, I would like to see fast return in the body of the channel and move above weekly pivot point. Only after that I will think about possibility to enter Long.
Obviously, that if market will break the lows and start to fall like a stone, we should not enter Long and should find another context for trading.
The technical portion of Sive's analysis owes a great deal to Joe DiNapoli's methods, and uses a number of Joe's proprietary indicators. Please note that Sive's analysis is his own view of the market and is not endorsed by Joe DiNapoli or any related companies.