Cryptocurrencies Market Update ➡️ Solid ECN

BTC USD - monetary pressure on the token may continue​

The cryptocurrency sector remains under pressure due to the tightening of the US Federal Reserve's monetary policy and the industry's general problems associated with a significant decrease in the capitalization of market leaders. Investors reacted negatively to the June data of the US labor market, believing that they would remove the last concerns of US Federal Reserve officials and force them to increase the rate again by 75 percentage points, which will lead to additional strengthening of the dollar. In public speeches, representatives of the crypto-currency community are trying to calm each other, stating that the current "crypto winter" will play in favor of the market but this looks like an attempt to find at least something good in the current difficult situation for the sector.

The potential for a further decline in digital assets will remain.

btc.png


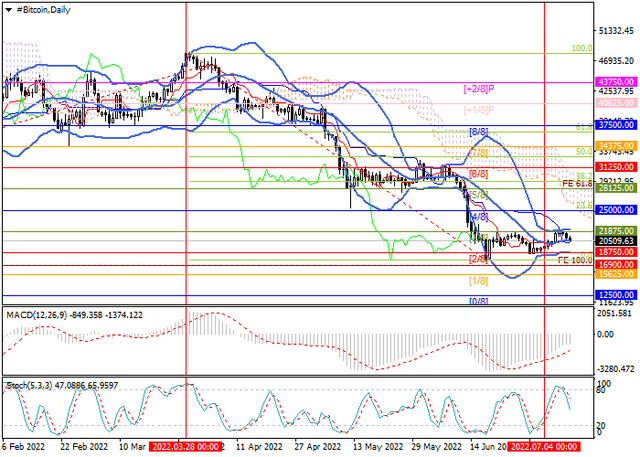
The trading instrument is testing the middle line of Bollinger Bands 20500 but the key "bearish" is 18750, the breakdown of which allows further decline to 15625 and 12500 and 10000.00. The breakout of 21875 (the upper line of Bollinger bands) allows growth to 25000(Fibonacci correction 23.6%), 28125.

Resistance levels: 21875, 25000, 28125, 31250 | Support levels: 18750, 15625, 12500, 10000​
 

ETHUSD - Murray analysis​

The ETHUSD pair is trading within a wide long-term descending channel, however, in the last three weeks the decline has slowed down, and the price has formed a sideways range of 1000 -1250. Currently, the quotes are close to its lower limit, the breakdown of which will allow the downward movement to continue to the levels of 750, 500 (the lower band of the descending channel). With a breakout of 1250, growth will be able to resume to the area of 1500, 1750.

eth.png


The long-term downward trend in the asset remains, however, to strengthen it, quotes need to break through the current side channel. This may take some more time, which is confirmed by technical indicators illustrating the uncertainty of the market: the Bollinger Bands are horizontal, the MACD histogram is stable in the negative zone, and the Stochastic is directed downwards, but close to the oversold zone, which can become a catalyst for a reversal.

Resistance levels: 1250, 1500, 1750 | Support levels: 1000, 750, 500​
 
XRPUSD - positive court news supports XRP

Today, the price is attempting to rise against the backdrop of positive judicial news for Ripple. Earlier, the court rejected the requirement of the US Securities and Exchange Commission (SEC) to recognize the comments of the former head of this regulator, William Hinman. During his tenure, Hinman stated that the SEC does not consider Bitcoin and Ethereum as securities, and therefore XRP, since it is not very different from ETH. If this can be proved to the court, then Ripple is likely to win the dispute with the American regulator. However, positive court news is unlikely to lead to a significant increase in the pair, since the cryptocurrency market is now dominated by negative monetary factors. The US Fed continues its cycle of raising rates and may increase them by another 75 percentage points this month, as it still fails to curb inflation. In the event that June data released today confirms an 8.8% increase in prices, the regulator’s actions may become even sharper, which will lead to a new outflow of investors from the digital asset market.

XRP.png

The price is close to 0.293, consolidation below which will give the prospect of further decline to the levels of 0.2441 and 0.1953. A breakout of 0.3650 can cause growth to 0.4395 (Fibo retracement 23.6%) and 0.4883. Technical indicators do not give a single signal: the Bollinger Bands are horizontal and are consolidating, as it happens before a serious price movement, the MACD histogram is stable in the negative zone, and the Stochastic is directed downwards, but approaching the oversold zone, which is fraught with a reversal.

Resistance levels: 0.3650, 0.4395, 0.4883 | Support levels: 0.2930, 0.2441, 0.1953​
 
ADAUSD - Technical analysis

The ADAUSD pair is moving within a long-term downtrend, and this week it was able to break below the level of 0.43, which it had unsuccessfully tested several times for a month and a half. In the future, the price decline may continue to 0.3906 and 0.3418. If the middle line of Bollinger bands is broken upwards, the quotes may rise to 0.4882 and 0.5371.

ada.png


Further negative dynamics seem more likely, as technical indicators confirm the continuation of the downward trend: Bollinger bands are directed downwards, the MACD histogram is increasing in the negative zone, and Stochastic has entered the oversold zone and is directed horizontally.

Resistance levels: 0.4600, 0.4882, 0.5371 | Support levels: 0.3906, 0.3418, 0.2929​
 
Back
Top