Cryptocurrencies Market Update ➡️ Solid ECN

ada-forum-1.png


Decline within the general market trend
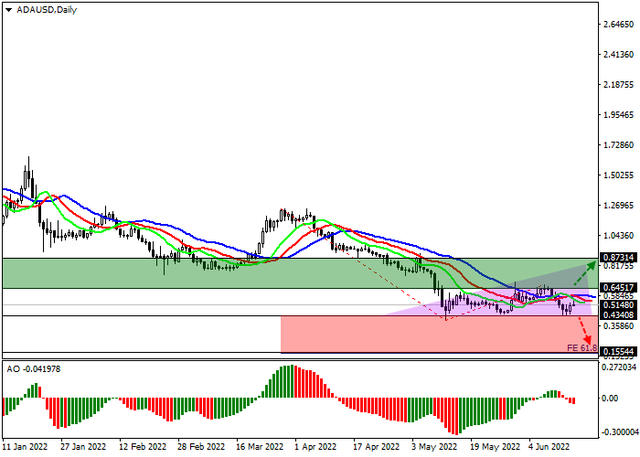
ADAUSD is actively declining as part of the general market dynamics, being at 0.6448.

On the global chart of the asset, the price is trading in a stable downtrend, turning into a full-fledged trend at the end of March after overcoming the Fibonacci 61.8% full retracement level at 1.2230. However, recently the quotes have been actively rising, having reached the level of an initial Fibonacci retracement of 23.6% at 0.6400, in case of fixing above which the local growth will continue until reaching the level of a complete Fibonacci retracement of 61.8% (0.9298).

ada.png


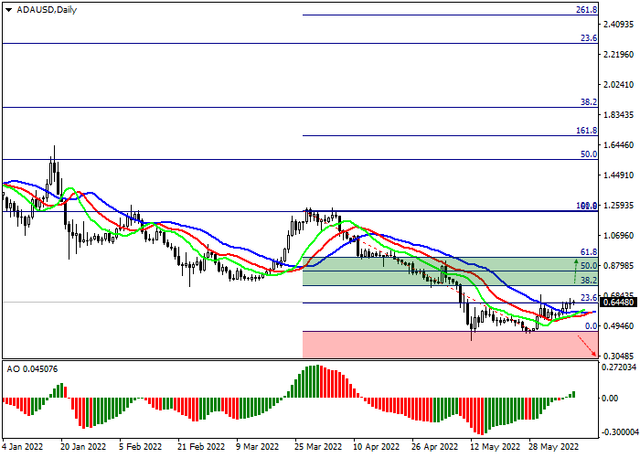
Technical indicators confirm a likely upside scenario, reversing towards growth: fast EMAs on the Alligator indicator have already crossed the signal line from below and began to expand the range of fluctuations, while the AO oscillator histogram has moved into the buy zone, having overcome the zero level, and continuing to form rising bars.

Resistance levels: 0.7480, 0.9298 | Support levels: 0.4546, 0.3​
 
ethusd-forum-1.png


ETH USD, H4
On the four-hour chart, the Bear flag price pattern formed, which has completely completed its formation, reaching 1079.74. At this support level, sellers met resistance caused by forming a "bullish" Engulfing pattern, which included a reversal model of the Hammer candlestick analysis. In this situation, it is obvious that the asset is strongly oversold, and the "bulls" will be able to win back part of the lost positions successfully. After the breakout of the resistance level of 1429.97, the upward dynamics will continue to the area of 1746.30–2153.01. If the support level of 1079.74 is held, the quotes may go down to 898.98–565.22.

ethusd-2.png


ETH USD, D1
On the daily chart, the Downwards triangle price pattern has completed its formation, and now there is the formation of a "bearish" Three black crows candlestick analysis pattern, which signals a continuation of the downtrend. At the support level of 1079.74, a Hammer reversal pattern is formed, indicating a possible reaching of the base price. After successfully forming this pattern, the scenario with an upward trend seems to be the most probable. Consolidating of the "bullish" positions above the resistance level of 1429.97 will allow the asset to head higher to the range of 1746.30–2153.01.

Resistance levels: 1429, 1746, 2153 | Support levels: 1079, 898, 565

ethusd-1.png
 
true-ecn-broker-1.png


XRP USD, the downtrend continues
Although the court hearings between Ripple and the US Securities and Exchange Commission (SEC) in the case of an unregistered sale of securities under the guise of XRP tokens for a total of 1.3B dollars are still ongoing, the company is actively developing and offers its partnership to large international brands. So, yesterday, the Brazilian platform for international transfers, Remessa Online, announced that it was able to significantly increase its cross-border payment traffic thanks to the cooperation with Ripple, which supplies enterprise blockchain solutions based on RippleNet technology.

Yesterday it became known that the popular wallet for storing coins, Xumm Wallet launched an update, thanks to which its users could make transactions from XRPL accounts, avoiding entering a login and password. The solution also allows users to issue a limited set of rights, which significantly increases the safety of user data.

In general, despite the general fundamental background, cryptocurrency quotes are declining, like the entire market, and there are still few prospects for growth, especially yesterday, the US Federal Reserve meeting, the decision of which may strengthen the position of the US dollar, which is the quoted currency in the pair.


Asset quotes are falling within the global downward channel, approaching the support line. Technical indicators maintain a stable sell signal: indicator Alligator’s EMA oscillation range is quite wide, and the histogram of the AO oscillator forms downward bars in the negative zone.

Resistance levels: 0.3712, 0.5022 | Support levels: 0.2785, 0.2

Visit solidecn.com
 
true-ecn-broker-1.png


ADA USD, trading within a local downtrend
On the global chart of the asset, the price is in a stable downtrend, continuing unsuccessful attempts to break the year’s low of 0.4340, which significantly increases the likelihood of a more significant rebound and upward correction. After the completion of this local growth, the downward dynamics may increase to the initial trend of 61.8% on the Fibonacci extension, around 0.1555.

At the four-hour time interval, trading is taking place within the Expanding formation pattern, within which the formation of the fourth wave has begun, which should become ascending, reaching the resistance line around 0.8731.

adausd.png


Technical indicators confirm the probable upward scenario, reversing upwards: fast EMAs on the Alligator indicator began to actively approach the signal line, narrowing the range of fluctuations, and the AO oscillator histogram is close to the transition level, although it forms bars with a downward trend.

Resistance levels: 0.6451, 0.8731 | Support levels: 0.4340, 0.1554

Read more market news
 
5.png


ADA USD - Murray analysis
The ADA USD pair continues to trade within the framework of a long-term downtrend. At the beginning of this week, the quotes attempted to grow, rising to the area of 0.5065, but then resumed the decline.

The key for the "bears" is the support zone 0.4310-0.3906 (Fibo retracement of 0.0%, Murray [4/8]), at the breakdown of which the cryptocurrency will fall to the area of 0.2929 (Murray [3/8]) and 0.1953 (Murray [2/8]). Meanwhile, the middle line of the Bollinger Bands (0.5257) is an important benchmark for the "bulls". Consolidation of the price above it will allow the quotes to continue the corrective growth to the levels of 0.6202 (Fibo retracement of 23.6%) and 0.7361 (Fibo retracement of 38.2%).

ada.png


Further downward dynamics of quotations seems preferable, which is confirmed by technical indicators: the Bollinger Bands and the Stochastic are reversing downwards, the MACD histogram is stable in the negative zone.

Resistance levels: 0.5257, 0.6202, 0.7361 | Support levels: 0.3906, 0.2929, 0.1953​
 
5.png


BTC USD - Murray analysis
The BTC USD pair continues to trade within the framework of a long-term downtrend, however, over the past week the price has consolidated around 21000, waiting for additional drivers of movement.

The key for the "bulls" is the resistance zone 21875-23000 (Murray [3/8], the middle line of the Bollinger Bands), with a breakout of which we can expect the price to return to 28125 (Murray [5/8], Fibo expansion 61.8%) and 31250 (Murray [6/8]). Otherwise, the decline in quotations will resume to the levels of 16900 (Fibo extension 100.00%), 12500 (Murray [0/8]), 10000.

btcusd.png


The further development of the current trend is confirmed by technical indicators: the Bollinger Bands are reversing downwards, the Stochastic has also approached the overbought zone, and the MACD histogram is decreasing in the negative zone, not excluding an upward correction, but its potential is seen to be limited.

Resistance levels: 21875, 23000, 28125, 31250 | Support levels: 16900, 12500, 10000​
 
5.png


XRP USD - Murrey analysis
An important support level of 0.2930 (Murrey [2/8], Fibonacci retracement 0.0%) is currently on the way of quotes, which the price has already unsuccessfully tested this month. Its breakdown will give the prospect of further decline to 0.1953 (Murrey [0/8]), 0.0977 (Murrey [–2/8]), and 0.0428 (61.8% Fibonacci extension). The key “bullish” level is 0.3906 (Murrey [4/8]). After the consolidation above it, recovery to 0.4883 (Murrey [6/8]), 0.5371 (Murrey [7/8], Fibonacci correction 23.6) may begin %), 0.5859 (Murrey [8/8]) is possible.

xrp.png


Technical indicators generally confirm the continuation of the downward trend: Bollinger bands and Stochastic are directed downwards, while the MACD histogram is stable in the negative zone.

Resistance levels: 0.3906, 0.4883, 0.5371, 0.5859 | Support levels: 0.2930, 0.1953, 0.0977, 0.0428.​
 
ETHUSD - the decline may continue
The strengthening of the entire cryptocurrency sector was provoked by the strengthening of BTC positions, and as a result, altcoins. Observers believe that large "whales" made the purchase of the first cryptocurrency on Monday, which ensured growth, but the overall pressure of macroeconomic factors on digital assets remains. The expected increase in interest rates by the US Fed by another 75 points only increases the risks of recession and forces investors to withdraw from assets alternative to the dollar. It is possible that ETH positions will be able to support the transition of the Ethereum network to the Proof-of-Stake (PoS) algorithm, which is scheduled for August, but negative monetary factors are seen to be stronger and will continue to put pressure on the cryptocurrency sector at least until the end of the rate hike cycle by the regulator.

Nevertheless, Ethereum developers continue to prepare for the merger of networks. Last week, they released the Glacier update, the purpose of which was to delay the activation of the so-called Difficulty Bomb – a mechanism that makes generating new blocks and mining more complicated.

eth.png


The price is in the area of the middle line of the Bollinger Bands (1126.5). The key for the "bulls" is the 1250 mark (Murray [4/8]), the breakout of which will give the prospect of further growth to the levels of 1562.5 (Fibo retracement 23.6%, Murray [5/8]) and 1875 (Fibo retracement 38.2%, Murray [6/8]). In case of a breakdown of the level of 937.50 (Murray [3/8]), the decline will resume to 625 (Murray [2/8]), 500. Technical indicators do not give a single signal: the Bollinger Bands are horizontal and are consolidating, as happens before a serious price movement, the MACD histogram is shrinking in the negative zone, the Stochastic is directed upwards.

Resistance levels: 1250, 1562.5, 1875 | Support levels: 937.5, 625, 500​
 
XRP USD - Murray analysis

Currently, the price has come close to the middle line of the Bollinger Bands in the area of 0.33, at the breakout of which the growth will be able to continue to the levels of 0.3906, 0.4395. The key for the "bears" remains the 0.293 mark, consolidation of the price below which will give the prospect of further decline to the level of 0.1953 (the lower limit of the descending channel.

xrp.png


The downward trend in the market remains, however, the upward reversal of the Stochastic does not exclude the continuation of corrective growth, but this is unlikely to lead to a reversal of the current trend.

Resistance levels: 0.3300, 0.3906, 0.4395 | Support levels: 0.2930, 0.2441, 0.1953​
 
BTCUSD Technical Analysis

Bitcoin closed slightly above $21,835 this morning. Stochastic and RSI are in overbought zone. Resistance is at $22,515, with a hold of this level the price is expected to decline to $20,000 - $18,629.

btcusd-tech.png


Trading idea
Sell targeting $20,000 - $18,600 | SL: $22,515​
 
Back
Top