Cryptocurrencies Market Update ➡️ Solid ECN

eth-1.png


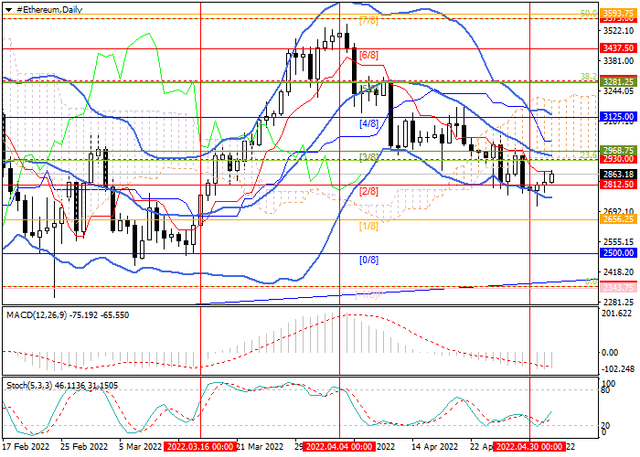
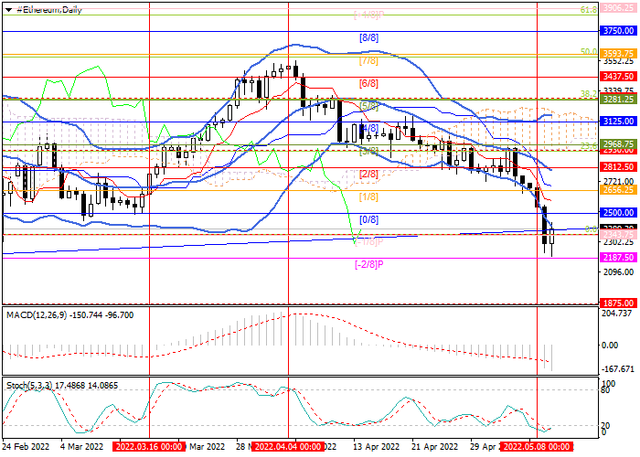
Since the beginning of this month, the ETHUSD pair has maintained a downward trend: earlier, the price dropped to the area of 2800, but then regained lost positions, returning to the 3000 mark.

The trading instrument is influenced by two main opposite factors. The expectation of a sharp increase in interest rates from the US Fed at a meeting in early May exerts pressure on the positions of ETH, as well as on the rest of the cryptocurrency sector. The consequence of this may be the strengthening of the US currency, but already there is an outflow of capital from the largest digital assets (BTC, ETH, ADA, SOL and others). So, over the past three weeks, ETH has lost about 59.3M dollars, or about a third of the total amount of funds withdrawn from the sector during this period.

eth-4.png


On the other hand, the rapid transition of the Ethereum network from the Proof-of-Work (PoW) algorithm to Proof-of-Stake (PoS) prevents the decline in quotations. Despite the fact that the merger of the Ethereum and Ethereum 2.0 networks was postponed for several months (previously it was assumed that it would happen in June), investors remain optimistic, believing that the new network will significantly speed up transaction processing and ETH will be able to catch up with digital gold in capitalization.

eth-3.png


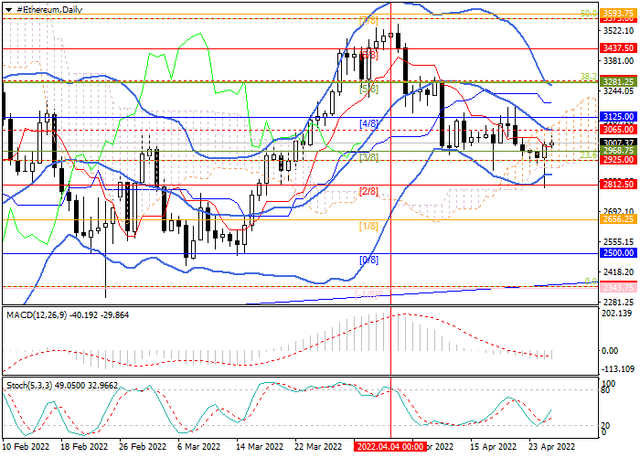
Currently, the key zone for the "bulls" is 3065-3125 (the middle line of the Bollinger Bands, Murray [4/8]), with the breakout of which upward dynamics will continue to 3281.25 (Fibo retracement of 38.2%, Murray [5/8]), 3437.5 (Murray [6/8]). Consolidation of the price below the level of 2925 (Fibo retracement of 23.6%) will give the prospect of a decline to the levels of 2812.50 (Murray [2/8]), 2656.25 (Murray [1/8]), 2500 (Murray [0/8]).

Technical indicators do not give a single signal: the Bollinger Bands are directed downwards, the MACD histogram is stable in the negative zone, but the Stochastic has reversed upwards.

Resistance levels: 3125, 3281.25, 3437.5 |Support levels: 2925, 2812.5 2656.25, 2500​
 
xrp-forum.png


XRPUSD continues to trade within a wide descending channel. At the end of March, quotes unsuccessfully tried to get out of it through the upper border and since then have continued a steady downward movement.

This week, the price of the token has tested the level of 0.6348 (Murray [1/8]), consolidating below which will give the prospect of further price decline to the levels of 0.5859 (Murray [0/8], Fibonacci retracement 0.0%) and 0.5371 (Murray [-1/8]). The key for the "bulls" seems to be the level of 0.6836 (Murray [2/8]), and if it is broken upwards, it will be possible to resume growth with a new attempt to test the upper border of the descending channel. The targets of the move will be 0.7324 (Murray [2/8], center line of Bollinger Bands) and 0.7812 (Murray [4/8], Fibonacci retracement 23.6%).

xrp.png


Bollinger Bands downward reversal and the increase in the MACD histogram in the negative zone signal a continuation of the downtrend; however, Stochastic is reversing upwards from the oversold zone, which does not exclude corrective growth.

Resistance levels: 0.6836, 0.7324, 0.7812 | Support levels: 0.6348, 0.5859, 0.5371​
 
btc-forum-1.png


Last week, BTCUSD was trading in the range of 40625 - 37500 (Murray [2/8]-[0/8]) under pressure from the upcoming US Federal Reserve meeting, which will announce a reduction in the balance of the regulator and an increase in the interest rate to 0.50%, which should strengthen the position of the US currency. The prospects for the growth of the US dollar against alternative assets are forcing investors to abandon cryptocurrencies, which confirms the outflow of capital from BTC, ETH, and other market leaders.

Meanwhile, the publication of weak data on the US Gross Domestic Product in the current quarter (a decrease of 1.4% was recorded) led to a short-term upward correction in BTCUSD, as it created the possibility of a slowdown in rate growth to 25 percentage points. It is worth noting that the market's enthusiasm was quickly exhausted, since most experts agreed that the current contraction of the US economy is not a sign of an impending recession, but is the result of temporary factors, so the country's financial authorities will probably not back down from their intention to tighten the monetary policy parameters more aggressively.

btc-chart.png


The instrument has now resumed its decline approaching 37500 (Murray [0/8]), which has been repeatedly tested earlier. Consolidation of the price below it will give the prospect of further downward movement to the level of 35300 (Murray [3/8], the lower limit of the ascending channel). The key point for the "bulls" seems to be at 39900.00 (the center line of Bollinger Bands), if it is broken out, BTCUSD will strengthen to the area of 42187.5 (Murray [3/8], Fibonacci retracement of 23.6%) and 437500 (Murray [4/8]).

Technical indicators indicate the continued downtrend: Bollinger Bands and Stochastic are reversing downwards, and the MACD histogram is increasing in the negative zone.

Resistance levels: 39900, 42187.5, 43750 | Support levels: 37500, 35300​
 
eth-forum-1.png


ETHUSD has continued its steady decline since April and hit seven-week lows around 2717 last week.

Starting from the weekend, the quotes of the digital asset are attempting an upward correction; however, a serious strengthening of the rate is possible only after the price overcomes the area of 2930 - 2968.27 (Fibonacci retracement 23.6%; Murray [3/8], the center line of Bollinger Bands). In this case, the targets will be at 3125 (Murray [4/8]), 3281.25 (Murray [5/8], Fibonacci retracement 38.2%). The key level for the "bears" is at 2812.50 (Murray [2/8]), and its repeated breakdown will allow the quotes to continue their downward movement to the area of 2656.25 (Murray [1/8]) and 2500 (Murray [0/8]).

ethusd.png


Technical indicators don't provide a clear signal:
Bollinger Bands are directed downwards, and the MACD histogram is growing in the negative zone, which confirms the continued downtrend; however, Stochastic is directed upwards, which does not exclude the development of corrective growth.

Resistance levels: 2968.27, 3125, 3281.25 | Support levels: 2812.5, 2656.25, 2500​
 
xrp-forum-1.png


The XRPUSD pair is trading within a wide descending channel. At the beginning of last month, the instrument reversed from its upper limit and declined to the area of 0.6000, where it is at the moment.

The market is waiting for the results of today's meeting of the US Fed, at which the interest rate may be raised from 0.50% to 1.00%, and a decision has been made to reduce the regulator's balance sheet. Any hint of a slowdown in the pace of monetary policy tightening due to the threat of a possible recession may be perceived positively by investors and push the quotes of the digital asset up. In these circumstances, the news concerning the trial of the U.S. Securities and Exchange Commission (SEC) against Ripple recedes into the background, however, it is worth noting the recent comments of the head of the company Brad Garlinghouse, who in an interview with Fox Business channel expressed the hope that the court will make a positive decision on the case by the end of this year. Nevertheless, most experts are inclined to believe that this will happen no earlier than the beginning of 2023, since the regulator is delaying the process in every possible way.

We also note the publication of the Ripple report for Q1 2022, according to which the growth in popularity of the On-Demand Liquidity (ODL) service based on XRP led to an increase in the volume of transactions to 15B dollars. Given the likely tightening of US monetary policy, these data are unlikely to be able to provide significant support for XRP.

xrp.png


Technically, the price is close to the key level for the "bears" 0.5859 (Murray [0/8]), which acts as a fairly strong support, since it has been repeatedly but unsuccessfully tested by bidders in January. If the price consolidates below it, the decline will continue to the levels of 0.5371 (Murray [-1/8]) and 0.4883 (Murray [-2/8]), otherwise the quotes will be able to resume the upward dynamics and return to the levels of 0.6836 (Murray [2/8], the middle line of the Bollinger Bands), 0.7324 (Murray [3/8], the upper boundary of the descending channel).

The downward trend persists, which is signaled by a downward reversal of the Bollinger Bands and an increase in the MACD histogram in the negative zone, but the Stochastic is directed upwards, which does not exclude a corrective growth.

Resistance levels: 0.6348, 0.6836, 0.732 | Support levels: 0.5859, 0.5371, 0.4883​
 
btc-forum-2.png


The BTCUSD pair continues to trade within a downtrend, under pressure from the May meeting of the US Federal Reserve on monetary policy.

Last week, the price of "digital gold" attempted to rise to 40000 after the head of the US regulator, Jerome Powell, denied the possibility of accelerating the pace of raising interest rates to 75 basis percentage points, which caused investors to hope for a reduction in the risks of a recession in the national economy and returned interest in risky assets in the short term. However, the decline continued, and by now, the quotes have reached their lows of this January, around 33030.

The fall in the stock market, with which digital assets are actively correlated, also harms the cryptocurrency sector. Several experts believe that investors still perceive BTC and altcoins as risky assets that should be disposed of during instability.

btc.png


Currently, the price of the BTCUSD pair has fallen below 34375 (Murrey [3/8]) and may continue to decline towards 31250 (Murrey [2/8]). The key "bullish" level is 38350 (the middle line of Bollinger bands), a breakdown of which may lead to the resumption of growth of the trading instrument to 40625 (Murrey [5/8]), 43750 (Murrey [6/8]), however, such an option price movement seems less likely, as technical indicators reflect the continuation of the downward trend: the Bollinger and Stochastic bands are directed downwards, the MACD histogram is increasing in the negative zone.

Resistance levels: 37500, 38350, 40625, 43750 | Support levels: 31250, 28125​
 
ethusd-forum-1.png


The ETHUSD pair has been declining since the beginning of last month, and this week has reached 2200 near the January lows.

Currently, the quotes of the digital asset are testing the support zone 2343.75–2300 (Murrey [–1/8], the lower limit of the long-term rising channel), below which they have repeatedly tried to break through earlier. If successful, the decline could continue to 1875 (Murrey [3/8] for W1). Downward reversal of Bollinger Bands and an increase in the MACD histogram in the negative zone signal a continuation of the downtrend. However, Stochastic reversal upwards in the oversold zone does not exclude corrective growth to 2656.25 (Murrey [1/8]) and 2812.5 (Murrey [2/8], average Bollinger bands line) but is unlikely to lead to a reversal of the current trend.

Resistance levels: 2500, 2656.25, 2812.5 | Support levels: 2343.75, 2187.5, 1875

eth.png
 
xrp-forum-1.png


The XRPUSD pair is falling along with the rest of the cryptocurrency market within a wide downward channel, reaching its lowest level since last March, around 0.4682 yesterday.

The pressure on the sector is still associated with the tightening of the monetary policy of the US Federal Reserve, which strengthens the position of the US currency compared to alternative assets. Also, experts note that due to the arrival of many institutional investors in digital assets, their correlation with the stock market has increased, and the fall of the latter over the past month and a half has harmed cryptocurrencies. As for XRP itself, the legal proceedings between Ripple and the US Securities and Exchange Commission (SEC) are putting additional pressure on the token. The process continues to drag out, and most experts expect it will be completed only next year, although the chances of a faster resolution of the situation remain. In this regard, the survey conducted by Finder among the leading experts in the cryptocurrency market is interesting. According to analysts, if Ripple wins in court by the end of the year, the token will be able to reach 2.55 dollars, and otherwise, it will restore part of the lost positions but will not rise above 0.68 dollars.

xrp.png


The price is testing 0.4883 (Murrey [5/8]). If it consolidates below it, the quotes may fall to 0.3906 (Murrey [4/8]). The key "bullish" level is 0.6130 (the middle line of Bollinger bands). Its breakout allows growth to 0.6836 (Murrey [7/8], the upper limit of the downward channel) or 0.7812 (Murrey [8/8], Fibonacci correction 23.6%). The downward reversal of Bollinger bands and the increase in the MACD histogram in the negative zone indicate the continuation of the downward trend, but the exit of Stochastic from the oversold zone does not exclude corrective growth.

Resistance levels: 0.6130, 0.6836, 0.7812 | Support levels: 0.4883, 0.3906​
 
Back
Top