B&B Trade
Sive,
I think we haven't talked about the weekly B&B trade lately. Could you please comment :
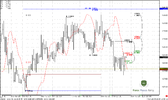
1) After the strong weekly thrust down, we wait for the first confluence level K to be reached. (Chart 1: 1.31 - 1.3130 level)
2) Even better, we utilise Minesweeper A and wait for K support to manifest at maximum (that was after the NFP & FOMC)
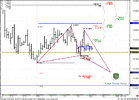
3) Then we calculate the fib levels of the down move. We should enter at 0.382 retracement with stop at 0.618. According to my calculation this level is around 1.30. But acccording to minesweeper B we also have an entry level yesterday (Chart 2 : Around first confluence at 1.2920)
The charts are follow.
Sive,
I think we haven't talked about the weekly B&B trade lately. Could you please comment :
1) After the strong weekly thrust down, we wait for the first confluence level K to be reached. (Chart 1: 1.31 - 1.3130 level)
2) Even better, we utilise Minesweeper A and wait for K support to manifest at maximum (that was after the NFP & FOMC)
3) Then we calculate the fib levels of the down move. We should enter at 0.382 retracement with stop at 0.618. According to my calculation this level is around 1.30. But acccording to minesweeper B we also have an entry level yesterday (Chart 2 : Around first confluence at 1.2920)
The charts are follow.
Attachments
Last edited: