Sive Morten
Special Consultant to the FPA
- Messages
- 18,680
Monthly
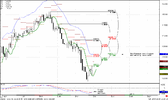
The market has pulled back gradually from oversold. The trend is bearish, next nearest target is Agreement at 1.1391-1.1482. A Bullish “Stretch” pattern still in place. At the same time, I think that this is just a pullback from the strong down thrust and we will see another leg down. The target of retracement could be different. When the market extremely oversold, like during AB down move, usually it shows deep retracements - 0.618 or even 0.782. But currently, the market is not so oversold, so, 0.382 retracement is more probable – it’s around 1.30-1.31 area. It’s not a bad move.
Weekly
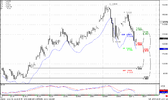
First of all, the weekly trend turns bullish. The green line on the chart is a 3x3 SMA, blue line – Oscillator Predictor upper bound that shows us overbought level. The next strong resistance that I prefer for opening short positions is 1.30-1.3123 Confluence resistance and weekly overbought.
We have an excellent thrust down; market has penetrated 3x3 SMA and almost reached Fib resistance at 1.2617. At the same time the weekly chart does not show us a definite level to enter short. Taking into consideration monthly oversold, retracement can be deeper, even to 1.31 area before B&B will start to work. So, the particular level for entering short we should search on a lower time frames.
Daily
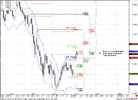
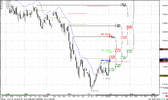
As we’ve discussed on previous week, 1.2600 was a target and it was almost reached. A couple days ago the market made a nice thrust and reached COP target, daily Confluence resistance and daily overbought area. So, I do not want to buy right here, at the same time I think that we can enter long on a pullback. Next target – 1.2760-1.28 area – very strong resistance, that includes OP, Confluence resistance, monthly pivot resistance 2 and weekly pivot resistance. If we will pass 1.2630 Confluence resistance, of course. Let’s look at the area, when we can enter long.
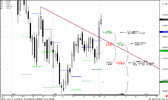
This is also a daily chart#2 but with supports now. Two areas, that I like to enter long. First one is 1.2440 – combination of Fib support and weekly Pivot point. Second – 1.2333 Confluence support area and neck line. If the market intends to move higher it should not break this area. So, drop your time frame and watch for ABC’s that end at these levels, and forming any Buy signals there. Just one warning – if weekly B&B really starts, then the target of this pattern – 1.2158 area.
2-Hour
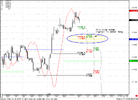
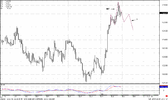
Let’s look at the 2-hour chart, although it’s not as typical as 1-hour. First of all, the trend is bearish, may be something already starts forming – RRT at the top, that possibly can shift to H&S. This is just an assumption, but we should not forget that we are at daily confluence resistance, overbought and reached COP. So, some retracement is reasonable and logical.
The market has pulled back gradually from oversold. The trend is bearish, next nearest target is Agreement at 1.1391-1.1482. A Bullish “Stretch” pattern still in place. At the same time, I think that this is just a pullback from the strong down thrust and we will see another leg down. The target of retracement could be different. When the market extremely oversold, like during AB down move, usually it shows deep retracements - 0.618 or even 0.782. But currently, the market is not so oversold, so, 0.382 retracement is more probable – it’s around 1.30-1.31 area. It’s not a bad move.
Weekly
First of all, the weekly trend turns bullish. The green line on the chart is a 3x3 SMA, blue line – Oscillator Predictor upper bound that shows us overbought level. The next strong resistance that I prefer for opening short positions is 1.30-1.3123 Confluence resistance and weekly overbought.
We have an excellent thrust down; market has penetrated 3x3 SMA and almost reached Fib resistance at 1.2617. At the same time the weekly chart does not show us a definite level to enter short. Taking into consideration monthly oversold, retracement can be deeper, even to 1.31 area before B&B will start to work. So, the particular level for entering short we should search on a lower time frames.
Daily
As we’ve discussed on previous week, 1.2600 was a target and it was almost reached. A couple days ago the market made a nice thrust and reached COP target, daily Confluence resistance and daily overbought area. So, I do not want to buy right here, at the same time I think that we can enter long on a pullback. Next target – 1.2760-1.28 area – very strong resistance, that includes OP, Confluence resistance, monthly pivot resistance 2 and weekly pivot resistance. If we will pass 1.2630 Confluence resistance, of course. Let’s look at the area, when we can enter long.
This is also a daily chart#2 but with supports now. Two areas, that I like to enter long. First one is 1.2440 – combination of Fib support and weekly Pivot point. Second – 1.2333 Confluence support area and neck line. If the market intends to move higher it should not break this area. So, drop your time frame and watch for ABC’s that end at these levels, and forming any Buy signals there. Just one warning – if weekly B&B really starts, then the target of this pattern – 1.2158 area.
2-Hour
Let’s look at the 2-hour chart, although it’s not as typical as 1-hour. First of all, the trend is bearish, may be something already starts forming – RRT at the top, that possibly can shift to H&S. This is just an assumption, but we should not forget that we are at daily confluence resistance, overbought and reached COP. So, some retracement is reasonable and logical.
Attachments
Last edited:
")