European Forex Professional Weekly 2010-03-10

Second, the current formation looks like Diamond reversal pattern, although not perfect. In general this pattern is rarely enough, and is very tricky.
As you see, signs are very contradictory and this is typical for such kind of price behavior. Trying to put parts of the puzzle together – weekly and daily, we can make an assumption that we can see an upper fake break of a diamond formation and reaching of 1.3800-1.3820 level for very short time. Then prices can show fast return and we can see daily and weekly bearish Wash & Rinse. But for this scenario we need that low bound of the diamond holds. Market shouldn’t break 1.3550 level and close below it.
If market will close below of a diamond border, then, the probability for down move increases significantly.

Looks like your scenario is intact.
 
Sive,

Could you please tell me why you are not choosing the following ABC (in red) in your monthly graph? I was thinking about this for a long time but couldn't find an explanation?
 

Attachments

  • 100310-1.png
    100310-1.png
    38.1 KB · Views: 14
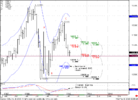
1) Market reached daily confluence level Tuesday, retraced back to OP on Friday (probably a W&R of OP level) and then closed below daily confluence level.
2) Daily, weekly Dema are bearish.
3) No oversold.
Well, Sentinel. Your Confluence area is OK, but your Objective points calculation is not quite valid (From my point of view). First daily trend is bearish and you should calculate targets down. If you want to calculate retracement targets, you should decrease time-frame, to 1-hour for example to find uptrend and then calculate targets. Remember simple rule - Thrust (AB)-retracement (BC) - expansion. But in your daily OP calculation all things are vise versa. The thrust is your correction.
Second, Your "C" point is below A. This is can be applied but not during thrust move of the market. Usually in consolidation or in situation like Double Repo top/bottom. Do you understand the difference?
4) In long term, the context is in favor of Gold decline, since EUR zone is in trouble and USD is improving. China which is an important investor in gold; tightening economic policy measures. All negative, the only risk is inflation, which may create an appetite for gold investment but I think we are much more far from this scenario yet..
It is too sophisticated theme - fundamental Gold analysis. There are too many contradictory factors, and this is realy long-term. For your possition its not very important to my mind. But news can influence.
5) Analysts seems to turn in favor of Gold bearish. (From %73 (19 of 26) to %36 (7 of 19) in one week)
March 5 (Bloomberg)- Nineteen of 26 traders, investors and analysts surveyed by Bloomberg, or 73 percent, said bullion would rise next week. Six forecast lower prices and one was neutral.
March 12 (Bloomberg) - Nine of 19 traders, investors and analysts surveyed by Bloomberg, or 47 percent, said bullion would fall next week. Seven forecast higher prices and three were neutral.
Well, It's just analysis. You do not know their positions. I can tell you, that one really very Big Guy out of Gold, although he gives recomendations every day. The one very important thing had happened - Gold did not confirm bearish expectations month ago (remember our expectations) Retracement was very deep. This fact has pressed on a big guys, and they are entering but very carefull. I'm still aside.
And for me iterest rate futures have much more attractive perspectives right now then gold.

So, what in result?
First - don't mess different analysis time-frames. Use analysis that in a row with your postion.
Second, I also think that Gold can go lower. I already have posted analysis here.
 
Last edited:
Sive,

Could you please tell me why you are not choosing the following ABC (in red) in your monthly graph? I was thinking about this for a long time but couldn't find an explanation?

Remember - thrust-retracement-expansion. Move to A point is retracement, but according to your mark - this is expansion.
And C point is much higher then A. This is not correct. you need to understand direction to calculate possible targets. But in your ABC's I cant identificate direction - because BC (that should be retracement) is greater that AB thrust.

I can give you simple advise. First - use 3x3 MA. Use C point if it's frome the other side of 3x3 then A and B.
Second, C point, as a rule, should be between A and B and in most cases C point is one of retracement numbers (,382 or, 618) from one of the Fib Nodes.

C point can be higher/lower then A in situation when market changing direction - like DRPO top or bottom. Or it can be some consolidation. But C shouldn't be too different from A in these cases.

Hope it helps
Sive.
If you do not uderstand something again, please don't hesitate to ask.
 
Last edited:
Remember - thrust-retracement-expansion. Move to A point is retracement, but according to your mark - this is expansion.
And C point is much higher then A. This is not correct. you need to understand direction to calculate possible targets. But in your ABC's I cant identificate direction - because BC (that should be retracement) is greater that AB thrust.

I can give you simple advise. First - use 3x3 MA. Use C point if it's frome the other side of 3x3 then A and B.
Second, C point, as a rule, should be between A and B and in most cases C point is one of retracement numbers (,382 or, 618) from one of the Fib Nodes.

C point can be higher/lower then A in situation when market changing direction - like DRPO top or bottom. Or it can be some consolidation. But C shouldn't be too different from A in these cases.

Hope it helps
Sive.
If you do not uderstand something again, please don't hesitate to ask.

Many thanks for that clear and detailed explanation. It seems that I have been doing incorrect DPO calculations for such a long time. I got it this time.
 
Last edited:
So, what in result?
First - don't mess different analysis time-frames. Use analysis that in a row with your postion.
Second, I also think that Gold can go lower. I already have posted analysis here.

You did not mentioned anything about latest hike in EURUSD. I understand that we still have to wait for Monday for a conclusion about this move.
 
You did not mentioned anything about latest hike in EURUSD. I understand that we still have to wait for Monday for a conclusion about this move.
I don't see any strong meaningful events for that. Only explanations are - good Factory orders (3 times higher than expected) in Germany, and statement of EU's authorities that Greece crisis is over. Plus pure technical factors for retracement. That should be enough to go a bit upper.

So, may be something can change in near term - we'll live - we'll see. But for now my thoughts are that way.

What to expect... First - FOMC rate decision at 16 of March and NFP of cause. As I said in research, there are rumors that they will be around +300K.
So, I expect that one of these events will trigger down move again. My target is 1.3820 - is near OP and daily Overbought. For now I don't want to guess what will be after that. If I'll see something on daily or weekly, I'll open mid-term position probably. Until that I'll be focus on intraday deals (like during current week).
 
Hi, Sive
Nice analysis as usual.Eur 1.3800 area looks quite strong. After a W&R and also rejected by the K area, Eur is on the way to the neckline of a Head & Shoulder, which might lead to a pattern failure. Let's see how it will pan out.
 

Attachments

  • ScreenHunter_03 Mar. 18 10.24 Administrator.jpg
    ScreenHunter_03 Mar. 18 10.24 Administrator.jpg
    61.9 KB · Views: 15
Last edited:
Hi, Sive
Nice analysis as usual.Eur 1.3800 area looks quite strong. After a W&R and also rejected by the K area, Eur is on the way to the neckline of a Head & Shoulder, which might lead to a pattern failure. Let's see how it will pan out.

It is great to have more analysis here. Welcome zhuangcn.
 
Hi, Sive
Nice analysis as usual.Eur 1.3800 area looks quite strong. After a W&R and also rejected by the K area, Eur is on the way to the neckline of a Head & Shoulder, which might lead to a pattern failure. Let's see how it will pan out.

Hi Zhuangcn,
Nice analysis, let's see, will it be an "Ooops!" of H&S (although for me this H&S is a bluring a bit, but I'm not an expert with classical patterns, just know them and recognize from time to time).

BTW, my CGQ's data does not show additional reaction point (on EUR/USD futures), that has been used by you to construct Confluence. Interesting...

Sive.

P.S.
It looks like you have something like MACDP for MT4 and DiNapoli retracement facility for MT4. Can you share with them with Sentinel, because he has asked about them.
And with me, but just with retracements. If it is possible of cause.
Thanx
 
Last edited:
Back
Top