• Please try to select the correct prefix when making a new thread in this folder.

    Discuss is for general discussions of a financial company or issues related to companies.

    Info is for things like "Has anyone heard of Company X?" or "Is Company X legit or not?"

    Compare is for things like "Which of these 2 (or more) companies is best?"

    Searching is for things like "Help me pick a broker" or "What's the best VPS out there for trading?"

    Problem is for reporting an issue with a company. Please don't just scream "CompanyX is a scam!" It is much more useful to say "I can't withdraw my money from Company X" or "Company Y is not honoring their refund guarantee" in the subject line.
    Keep Problem discussions civil and lay out the facts of your case. Your goal should be to get your problem resolved or reported to the regulators, not to see how many insults you can put into the thread.

    More info coming soon.

Discuss Forex-MegaDroid.com

General discussions of a financial company
that sounds

interesting. I will have that in mind perhaps I will try that one sooner or later....

What I can say about MDs behaviour when default settings used he made most weeks just one trade, some weeks no trade at all and some weeks 2 trades.
But when I changed settings as Ken described MD is damn doin good because this week he had 4 trades.

always good trading
 
Last edited:
heya Dirk

are u live on FXDD with 0.4 risk, NFA ON, Aggresive ON, and RecoveryMode OFF?

it's always weird why sometimes different ppl using the same broker and same settings still get varying trades. the only other thing i can think of is the quality of internet connection at different locations around the world.
 
Guys, increasing the lot size, or using my settings, isnt what increases the number of trades. Megadroid chooses its trades using a series of filters and indicators. When everything lines up right it takes the trade. Thats all there is to it.
Run the comparision tests if you want. Open two charts of the EURUSD and place Megadroid on each one, and look for the differences in its trading. Try changing the lot sizes and see if it affects anything. I dont think it does.

Sometimes it just makes a lot of trades in one week, and sometimes it makes none.

If you watch it you will see that when the market gets too flat it doesnt trade. It needs a certain amount of range to make its trades. Also if the market is too volitile, with big moves or trending action during its trading period it wont take as many trades. It has a good set of filters that really limit it trading.
 
12bfree

ya, I use those settings but risk level 0.3...

Ken, I guess you´re right with that because MD mostly have an 100pips S/L where he internally stated how much lot size to use for a trade and using account balance. So you must be right because nothin will change this, only market behaviour..... right thing

always good trading guys and a nice weekend
 
tipuwang, let´s help you a bit. At side 30 of this thread Ken Long describes the settings. And they are very very very good. I love them - but Michael, I won´t test them for a loser.

Ya, MD does it again. Nice 11pips this night ;-) at FXDD.

I hope that the big players leave the Euro alive that MD can continue his excellent work!

Ya Michael, this divergence .pdf is very interesting. I had it around for a few month and remembered when charts went choppy. Nice indication too.
And thanks for telling me about the free VPS at FXCM. I knew that. So because you have an account at FXDD and FXCM, is MD trading at FXCM same as with FXDD? Please tell me.

So let the pips rock.

always good trading

(Update 15:12pm....... 'NEVER had that much pips........ jiiieeeeeeehhaaaaaaahhhh)

Dirk,could you share the Divergence file?
 
Hi, could any1 share the MD setting by Ken?

Tip, do you even own Megadroid? Why dont you just read the thread and do a little research on your own. Theres not much you can change on Megadroid, and my setting is really nothing special. I just turned off Recovery Mode and turned on the NFA filter and doubled my position size. Thats it. The reason being, if it can handle a doubled position size occaisionaly, from the Recovery Mode or Aggressive Mode, it should be able to handle it any time. The odds of a winning or losing trade dont change just because it has taken a loss recently, so no Recovery Mode, and the NFA filter just limits the trading to one trade at a time which allows you to double the position size all the time. The secret of success is not constantly asking people to give you things. Its thinking for yourself.
 
Perfect Money Management?

Hi folks, Don Steinitz sent over something interesting and I would like to share this with anyone who's interested and not in his mailing list. Makes a good read for the weekend.

We often hear about the importance of diversifying, but perhaps it's easier said than done. How much money do we put in each currency pair? When do we buy or sell those pairs? These are all questions that can be answered by defining a money management system. Here we look at the Kelly Criterion, one of the many techniques that can be used to manage your money effectively.

The History
John Kelly, who worked for AT&T's Bell Laboratory, originally developed the Kelly Criterion to assist AT&T with its long distance telephone signal noise issues. Soon after the method was published as "A New Interpretation Of Information Rate" (1956), however, the gambling community got wind of it and realized its potential as an optimal betting system in horse racing. It enabled gamblers to maximize the size of their bankroll over the long term. Now the system is used by many as a general money management system in not only gambling but also investing.

The Basics
There are two basic components to the Kelly Criterion:
• Win probability - The probability that any given trade you make will return a positive amount.
• Win/loss ratio - The total positive trade amounts divided by the total negative trade amounts.

These two factors are then put into Kelly's equation:
Kelly % = W – [(1 – W) / R]

Where:
W = Winning probability
R = Win/loss ratio

The output is the Kelly percentage, which we examine below.

Putting It to Use
Kelly's system can be put to use by following these simple steps:

Access your last 50-60 trades. You can do this by simply asking your broker, or by checking your recent tax returns (if you claimed all your trades). If you are a more advanced trader with a developed trading system, then you can simply back test the system and take those results. The Kelly Criterion assumes, however, that you trade the same way you traded in the past.
Calculate "W", the winning probability. To do this, divide the number of trades that returned a positive amount by your total number of trades (positive and negative). This number is better as it gets closer to one. Any number above 0.50 is good.

Calculate "R," the win/loss ratio. Do this by dividing the average gain of the positive trades by the average loss of the negative trades. You should have a number greater than 1 if your average gains are greater than your average losses. A result less than one is managable as long as the number of losing trades remains small.

Input these numbers into Kelly's equation: K% = W – [(1 – W) / R].
Record the Kelly % that the equation returns.

Interpreting the Results
The percentage (a number less than one) that the equation produces represents the size of the positions you should be taking. For example, if the Kelly percentage is 0.05, then you should take a 5% position in each of the equities in your portfolio. This system, in essence, lets you know how much you should diversify.

The system does require some common sense, however. One rule to keep in mind, regardless of what the Kelly percentage may tell you, is to never commit more than 10-20% of your capital to one currency pair. Allocating any more than this is carries far more risk than most people should be taking.

Is It Effective?
This system is based on pure mathematics. However, some people may question whether this math originally developed for telephones is actually effective in the Forex market or gambling arenas.

By showing the simulated growth of a given account based on pure mathematics, an equity chart can demonstrate the effectiveness of this system. In other words, the two variables must be entered correctly, and it must be assumed that the investor is able to maintain such performance. Here is an example:

((please refer to attachment))

Here we see the activity in 50 simulated trading accounts by means of an equity curve. The average amount won is the same as the average amount lost; however, the people are able to win 60% of the time. The Kelly Criterion then tells them to allocate 19% of their capital to each equity (giving them about five equities). The result is a positive return in the long run for all traders (notice some short-term downside, however). The highest return was 140% (started at 100, went to 240) over 453 bars. Bars represent the time between trades or trading system outputs.

Why Isn't Everyone Making Money?
No money management system is perfect. This system will help you to diversify your portfolio efficiently, but there are many things it can't do. It can't pick winning forex pairs for you, make sure you continue to trade consistently or predict sudden market changes (although it can lighten the blow).

Also, there is always a certain amount of "luck" or randomness in the markets, which can alter your returns. Consider again the chart we looked at above. See how the best person received a 140% return, the worst got less than 40%. Both traders used the same system, but randomness and volatility can cause temporary swings in account value.

Conclusion
Money management cannot ensure that you always make spectacular returns, but it can help you limit your losses and maximize your gains through efficient diversification. The Kelly Criterion is one of many models that can be used to help you diversify.
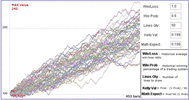
Well, in my calculation according to Kelly Criterion, I should be taking a position size of 79% for Megadroid. :err:
 

Attachments

  • equity chart.gif
    equity chart.gif
    49.8 KB · Views: 12
tipuwang

as Ken said before do a little bit of work on your own.... I told you to look at site 39 of this thread...... then read ALL postings and you will find out how you can get the divergence .pdf.....

12bfree..... damn, your posting is far too much for my school english..... anyway, the manual system and MD with advanced settings now is enough.
What I recognized within Thursday and Friday it´s so important always havin a close look to upcomin news too..... because indicator doesn´t work at those times not really..... so it´s a great benefit within FPA that Felix is givin us support for this and in future I WILL study them closely.....

always good trading and a nice weekend guys
 
Back
Top