Sive Morten
Special Consultant to the FPA
- Messages
- 18,664
So, as holidays stands - we will take a look at another currency that we usually leave without attention - JPY.
Fundamentals
(Reuters) - Japan’s consumer prices were expected to rise fractionally for an 11-th straight month in November, a Reuters poll found on Friday, highlighting the reticence of consumer inflation despite the solid economy.
The nationwide core consumer price index (CPI), which includes oil products but excludes volatile fresh food prices, likely rose 0.8 percent in November from a year ago, unchanged from October’s reading, the poll of 19 economists found.
The rate of increase in utility costs slowed down, but the cost of oil products such as gasoline supported core consumer prices, analysts said.
Core consumer prices in Tokyo, available a month before the nationwide data, were projected to be up 0.7 percent in December from a year earlier versus a 0.6 percent annual increase in November.
“The contribution from energy prices to core CPI will likely stay steady in this fiscal year but it will peak in fiscal 2018,” Yoshimasa Maruyama, chief market economist at SMBC Nikko Securities, said in the survey.
The Bank of Japan kept monetary policy steady on Thursday and Governor Haruhiko Kuroda stressed the need to “patiently” maintain ultra-loose policy, with inflation still distant from the BOJ’s 2 percent target despite a strengthening economy.
The poll also found industrial output was likely to have grown 0.5 percent in November from the previous month, up for a second straight month.
Factory output is forecast to remain solid given buoyant business sentiment and robust external demand, analysts said.
“We expect factory output will continue to recover thanks to gains in exports on the global economic recovery, upbeat corporate profits and the improving jobs market,” said Akihiro Morishige, senior economist at Mitsubishi Research Institute in the survey.
The poll saw the jobless rate steady at a 23-year low of 2.8 percent in November and the jobs-to-applicants ratio at 1.56, which would be the highest level since January 1974.
Household spending is forecast to have risen an annual 0.5 percent in November and retail sales were seen likely to grow 1.2 percent on the year.
The internal affairs ministry will release the jobs market and household spending data on Dec. 26, while the trade ministry will publish the retail sales figures on Dec. 28.
COT Report
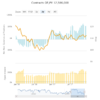
Speculators pared back net short U.S. dollar bets, pushing them to their lowest level since mid-November, according to calculations by Reuters and Commodity Futures Trading Commission data released on Friday.
The value of the net short dollar positions, derived from net positions of International Monetary Market speculators in the yen, euro, British pound, Swiss franc and Canadian and Australian dollars, was $2.18 billion in the week ended Dec. 19. That was lower than the previous week’s net short position of $7.81 billion
In general, since autumn JPY stands extremely oversold, and keeps net short positions around 115-120K contracts. It makes difficult for currency to drop more and limits upside USD/JPY potential. In last three weeks we see some short-covering. It stands gradual and it is difficult to say what the reason for that - either recent BoJ statement and data or just end of the year.

Technicals
Monthly
So, today we will take a look at yen, because it shows interesting technical picture. Personally I do not remember whether I've seen something of that sort anywhere.
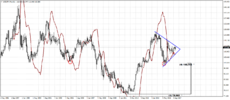
On monthly chart picture stands moderately bullish. Major upside swing from 75 to 125 level has become a bullish reversal swing as well. For few pips but it is greater than previous swing down. After that logical deep retracement to 100 level has followed.
Upward rally after first touch of 50% Fib support area was furious, then also retracement has followed. All these stuff is forming wide pennant or triangle pattern, which potentially has chances to become upside continuation pattern.
But now we're mostly interested in action that stands inside the triangle. Here market has formed bullish grabber, which suggests action above 119. And in general we could recognize a shape of big reverse H&S pattern. The bottom of right shoulder has been passed already and price was able to hold there. It means that in long-term perspective we could get an action somewhere to 150 area.
Finally, triangle also could shift to big upside butterfly pattern. But all these moments have a relation to far-going future. Now we mostly care just about inner grabber and 119 target here.

Weekly
Here, on weekly, we're going further as a lot of other bullish signs stand here. First is - take a look at difference of price action. Market has shown fast rally up from 100 to 118, but gradual and choppy back to 108. It means that downside action was a retracement and it takes the shape of wedge pattern that has been broken up already.
This agrees with monthly picture and supports idea of big H&S pattern there.
Inside the wedge we also have some patterns - multiple AB-CD's, "222" Sell etc. We even have traded some of them. Combination of rally and wedge consolidation takes the shape of large "222" Buy...
Price also behaves well around pivots - action down was held by MPS1 and now market is coiling around MPP, stands slightly above it.
Finally right now, we have multiple bullish grabbers that suggest action above 115 area - right to MPR1:

Daily
We've talked about daily chart just on Friday. So, here is also picture mostly stands bullish. And again, guys - we have bullish grabber with even closer target - 113.80. Major AB-CD pattern has COP target slightly above the top which agrees with grabber's idea...
As weekly chart shows this AB-CD pattern could get continuation to OP target which stands slightly higher than 114.50 tops, and particular this action is suggested by weekly grabbers.

Intraday
Here is trading plan that we've discussed in video is working. As market has completed some inner targets - AB-CD XOP and formed "222" Sell pattern, some retracement should happen and now it is started.
Still, as major targets still stand ahead and not completed yet - retracement should not be too deep. By current pace it seems that 113.10 area will be the point where market could re-establish upside action again.

Conclusion:
So, we've extended view on JPY and here is indeed stands unique combination of bullish grabbers, starting from monthly and down to daily chart, which provides a combination of upside targets.
Here is still some contradiction exists with other dollar-related currencies, as there we also expect upside action. But, may be not the USD will become a reason for action on JPY, or action could happen in different time or different pace.
The technical portion of Sive's analysis owes a great deal to Joe DiNapoli's methods, and uses a number of Joe's proprietary indicators. Please note that Sive's analysis is his own view of the market and is not endorsed by Joe DiNapoli or any related companies.
Fundamentals
(Reuters) - Japan’s consumer prices were expected to rise fractionally for an 11-th straight month in November, a Reuters poll found on Friday, highlighting the reticence of consumer inflation despite the solid economy.
The nationwide core consumer price index (CPI), which includes oil products but excludes volatile fresh food prices, likely rose 0.8 percent in November from a year ago, unchanged from October’s reading, the poll of 19 economists found.
The rate of increase in utility costs slowed down, but the cost of oil products such as gasoline supported core consumer prices, analysts said.
Core consumer prices in Tokyo, available a month before the nationwide data, were projected to be up 0.7 percent in December from a year earlier versus a 0.6 percent annual increase in November.
“The contribution from energy prices to core CPI will likely stay steady in this fiscal year but it will peak in fiscal 2018,” Yoshimasa Maruyama, chief market economist at SMBC Nikko Securities, said in the survey.
The Bank of Japan kept monetary policy steady on Thursday and Governor Haruhiko Kuroda stressed the need to “patiently” maintain ultra-loose policy, with inflation still distant from the BOJ’s 2 percent target despite a strengthening economy.
The poll also found industrial output was likely to have grown 0.5 percent in November from the previous month, up for a second straight month.
Factory output is forecast to remain solid given buoyant business sentiment and robust external demand, analysts said.
“We expect factory output will continue to recover thanks to gains in exports on the global economic recovery, upbeat corporate profits and the improving jobs market,” said Akihiro Morishige, senior economist at Mitsubishi Research Institute in the survey.
The poll saw the jobless rate steady at a 23-year low of 2.8 percent in November and the jobs-to-applicants ratio at 1.56, which would be the highest level since January 1974.
Household spending is forecast to have risen an annual 0.5 percent in November and retail sales were seen likely to grow 1.2 percent on the year.
The internal affairs ministry will release the jobs market and household spending data on Dec. 26, while the trade ministry will publish the retail sales figures on Dec. 28.
COT Report
Speculators pared back net short U.S. dollar bets, pushing them to their lowest level since mid-November, according to calculations by Reuters and Commodity Futures Trading Commission data released on Friday.
The value of the net short dollar positions, derived from net positions of International Monetary Market speculators in the yen, euro, British pound, Swiss franc and Canadian and Australian dollars, was $2.18 billion in the week ended Dec. 19. That was lower than the previous week’s net short position of $7.81 billion
In general, since autumn JPY stands extremely oversold, and keeps net short positions around 115-120K contracts. It makes difficult for currency to drop more and limits upside USD/JPY potential. In last three weeks we see some short-covering. It stands gradual and it is difficult to say what the reason for that - either recent BoJ statement and data or just end of the year.
Technicals
Monthly
So, today we will take a look at yen, because it shows interesting technical picture. Personally I do not remember whether I've seen something of that sort anywhere.
On monthly chart picture stands moderately bullish. Major upside swing from 75 to 125 level has become a bullish reversal swing as well. For few pips but it is greater than previous swing down. After that logical deep retracement to 100 level has followed.
Upward rally after first touch of 50% Fib support area was furious, then also retracement has followed. All these stuff is forming wide pennant or triangle pattern, which potentially has chances to become upside continuation pattern.
But now we're mostly interested in action that stands inside the triangle. Here market has formed bullish grabber, which suggests action above 119. And in general we could recognize a shape of big reverse H&S pattern. The bottom of right shoulder has been passed already and price was able to hold there. It means that in long-term perspective we could get an action somewhere to 150 area.
Finally, triangle also could shift to big upside butterfly pattern. But all these moments have a relation to far-going future. Now we mostly care just about inner grabber and 119 target here.
Weekly
Here, on weekly, we're going further as a lot of other bullish signs stand here. First is - take a look at difference of price action. Market has shown fast rally up from 100 to 118, but gradual and choppy back to 108. It means that downside action was a retracement and it takes the shape of wedge pattern that has been broken up already.
This agrees with monthly picture and supports idea of big H&S pattern there.
Inside the wedge we also have some patterns - multiple AB-CD's, "222" Sell etc. We even have traded some of them. Combination of rally and wedge consolidation takes the shape of large "222" Buy...
Price also behaves well around pivots - action down was held by MPS1 and now market is coiling around MPP, stands slightly above it.
Finally right now, we have multiple bullish grabbers that suggest action above 115 area - right to MPR1:
Daily
We've talked about daily chart just on Friday. So, here is also picture mostly stands bullish. And again, guys - we have bullish grabber with even closer target - 113.80. Major AB-CD pattern has COP target slightly above the top which agrees with grabber's idea...
As weekly chart shows this AB-CD pattern could get continuation to OP target which stands slightly higher than 114.50 tops, and particular this action is suggested by weekly grabbers.
Intraday
Here is trading plan that we've discussed in video is working. As market has completed some inner targets - AB-CD XOP and formed "222" Sell pattern, some retracement should happen and now it is started.
Still, as major targets still stand ahead and not completed yet - retracement should not be too deep. By current pace it seems that 113.10 area will be the point where market could re-establish upside action again.
Conclusion:
So, we've extended view on JPY and here is indeed stands unique combination of bullish grabbers, starting from monthly and down to daily chart, which provides a combination of upside targets.
Here is still some contradiction exists with other dollar-related currencies, as there we also expect upside action. But, may be not the USD will become a reason for action on JPY, or action could happen in different time or different pace.
The technical portion of Sive's analysis owes a great deal to Joe DiNapoli's methods, and uses a number of Joe's proprietary indicators. Please note that Sive's analysis is his own view of the market and is not endorsed by Joe DiNapoli or any related companies.