Sive Morten
Special Consultant to the FPA
- Messages
- 18,690
Greeting guys,
today I thought that may be it makes sense to take a look at aussie dollar instead of gold. It's long time passed since we've talked about it last time. We continue gold discussion in our daily videos.
Fundamentals
(Reuters) - Gold prices fell on Friday after the U.S. Senate approved a budget blueprint that paves the way for tax cuts, causing stocks, the dollar and bond yields to rise. The Republican-controlled Senate voted by 51-to-49 late on Thursday for the measure, clearing a hurdle for tax cuts that would add up to $1.5 trillion to the federal deficit over the next decade.
Investors betting on faster economic growth as a result bought riskier assets while bond holders reduced their positions on worries that inflation and federal borrowing could rise.
U.S. Treasury yields rose further Friday afternoon, reversing a modest pullback after a White House official said Federal Reserve Chair Janet Yellen was in the White House for lunch with U.S. President Donald Trump's economic adviser Gary Cohn. Trump could announce his choice for the next chair of the
U.S. central bank as early as next week after he interviewed five candidates including Yellen. A report on Thursday suggested Trump was leaning towards Fed Governor Jerome Powell, perceived as a less hawkish candidate.
Higher bond yields increase pressure on bullion because gold does not offer a yield, while a stronger dollar makes it more expensive for holders of other currencies. Investors may also see tax cuts as a cause for higher U.S. interest rates, said INTL FCStone analyst Edward Meir. Higher rates would push up bond yields and the dollar.
Spot gold was down 0.77 percent at $1,279.44 an ounce by 2:41 p.m. EDT (1841 GMT), down about 1.9 percent on the week. U.S. gold futures for December delivery settled down $9.50, or 0.7 percent, at $1,280.50 per ounce, 1.8 percent lower on the week.
The net long position of money managers in Comex gold has fallen from a peak in early September but is still elevated.
"Right now, you could see a lot of open interest being abandoned if we don't have another big move (in gold) next week," said George Gero, managing director of RBC Wealth Management in New York.
The European Central Bank is expected to say on Oct. 26 it will start trimming its monthly asset purchases to 40 billion euros from 60 billion euros in January, a Reuters poll showed.
COT Report
Aussie dollar holds rather high net long position. It stands not at ultimate high, but close enough and makes pressure on AUD dynamic. Last four weeks we see clear action, that is typical for retracement. Net long position was dropping simultaneously with decreasing of open interest - some longs were closed, and probably by short-term traders.
At the same time, the pace of this decreasing is slow which also tells about retracement nature of recent action.

Thus, right now we could suggest that sentiment mostly is still bullish here, but market has taken pause in upward action.
In our last report, dedicated to AUD we've prepared wide fundamental analysis of situation in economy and RBA view on AUD rate. As a result we've come to conlcusion that -
" the only driving factor for AUD could be inner ones, as commodity export and it's prices. If overall commodities bullish trend will continue - then AUD will keep chances to proceed to higher levels, but in short-term perspective, within 1-2 months its upside potential looks limited and stands around 0.8150-0.82 area. At the same time, hardly we will get strong sell-off as well, as situation around AUD mostly looks positive by far."
And now indeed, it seems that market keeps this scenario.
Technical
Monthly
On monthly chart we have one important change compares to what we saw in September. Price has not quite reached major target here, but formed bearish reversal candle, that was also a kind of W&R. Take a look that price has shown spike up and closed almost below August lows. This type of action calls as "reversal candle". And usually it leads at least to more extended retracement down.
Among other patterns we still have the same AB-CD pattern stands in focus. Trend is bullish here. Right now market has limited upside potential. As we can see, 0.81-0.82 is very strong resistance that includes YPR1, major 3/8 Fib resistance, AB-CD target @ 0.8165.
It means that there are big chances that in 0.8150-0.8250 area we need to keep an eye on bearish reversal pattern on daily time frame. Still, market should try to show some upside continuation as major monthly target has not been reached yet.
The only thing that hesitates me is our reversal candle. Usually markets form it out of target, when it has been met. In our case it has not been reached for ~40 pips. This is very small distance for monthly time frame. But, as you understand it could lead us to opposite analysis, depending how we will treat this target either as been hit, or not been hit yet...
So, as a result, monthly analysis doesn't give us a lot of clarity. Although major target has not been hit yet, reversal candle in September assumes slightly greater retracement down before upside reversal will happen again, if it will happen of course. Now we're mostly are interested with this retracement and its final point.

Weekly
On weekly chart trend stands bearish, but there are two moments that suggest deeper upside retracement. (It is difficult to suggest it, because now we have different setups on EUR, AUD, NZD and GBP - although all of them stand in relation to USD.)
First moment is bearish reversal swing itself. As market has reached strong support area of former top, MPS1 and 3/8 Fib level - aussie has turned to upside bounce. Usually after reversal swings opposite retracement is deep.
Second - bullish engulfing pattern that has been formed recently. So, it seems that some kind of AB=CD pattern should happen on lower time frame:

Daily
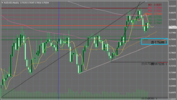
Daily chart brings nothing special, except may be K-support area in addition to weekly single Fib level. That's why I use it to draw approximate action that should happen in nearest future based on technical picture that we have.
Take a look that daily AUD also has formed small reversal swing but it stands upward. It means that we should get minor bearish AB=CD pattern that mostly has been completed already.
Next step should be up as final "CD" leg of AB=CD retracement.
And finally third step is final leg of downside AB-CD retracement that is suggested by monthly candle.

Now let's see what to expect on coming week and what patterns we will watch for. Why, we suggest particular this kind of action...
Intraday
Indeed, most interesting stuff we could find on intraday charts. Here is why we expect higher AB=CD retracement - just because we have reverse H&S pattern on 4-hour chart. If it will start right at the moment as we've drawn - it's target will be around 5/8 Fib level @ 0.7975 and this is potential area where we should watch chances to sell:

This upward action, in turn, could start from perfect "222" Buy on hourly chart:

Theoretically downside action should stop around 0.78, but CD leg is rather fast and it also takes the shape of butterfly. That's why it could happen that price will dive a bit lower, to 1.618 extension. It doesn't change the major idea, just minor technical detail.
So as you can see all patterns on different time frames stand in fascinating harmony to each other. But, besides of positive moments that stands due, it also has one negative feature if some pattern will fail - it will lead to chain reaction of consecutive failings, so just keep your eyes open and control key levels.
Conclusion:
AUD has positive sentiment but in perspectives of 1-2 months it has limited upside potential, mostly because of absence of driving factors. USD weakness probably will take a pause, RBA policy right now mostly stands flat and only driving factors for AUD that we see are Trade Balance, Export volume and Import/Export prices. But within 1-2 months we will not get big update on this stats. That's why currently we see upside ceil around 0.8150-0.8250 area.
In shorter-term perspective, we mostly intend to trade inside monthly reversal candle as a lot of clear patterns have been formed there.
The technical portion of Sive's analysis owes a great deal to Joe DiNapoli's methods, and uses a number of Joe's proprietary indicators. Please note that Sive's analysis is his own view of the market and is not endorsed by Joe DiNapoli or any related companies.
today I thought that may be it makes sense to take a look at aussie dollar instead of gold. It's long time passed since we've talked about it last time. We continue gold discussion in our daily videos.
Fundamentals
(Reuters) - Gold prices fell on Friday after the U.S. Senate approved a budget blueprint that paves the way for tax cuts, causing stocks, the dollar and bond yields to rise. The Republican-controlled Senate voted by 51-to-49 late on Thursday for the measure, clearing a hurdle for tax cuts that would add up to $1.5 trillion to the federal deficit over the next decade.
Investors betting on faster economic growth as a result bought riskier assets while bond holders reduced their positions on worries that inflation and federal borrowing could rise.
U.S. Treasury yields rose further Friday afternoon, reversing a modest pullback after a White House official said Federal Reserve Chair Janet Yellen was in the White House for lunch with U.S. President Donald Trump's economic adviser Gary Cohn. Trump could announce his choice for the next chair of the
U.S. central bank as early as next week after he interviewed five candidates including Yellen. A report on Thursday suggested Trump was leaning towards Fed Governor Jerome Powell, perceived as a less hawkish candidate.
Higher bond yields increase pressure on bullion because gold does not offer a yield, while a stronger dollar makes it more expensive for holders of other currencies. Investors may also see tax cuts as a cause for higher U.S. interest rates, said INTL FCStone analyst Edward Meir. Higher rates would push up bond yields and the dollar.
Spot gold was down 0.77 percent at $1,279.44 an ounce by 2:41 p.m. EDT (1841 GMT), down about 1.9 percent on the week. U.S. gold futures for December delivery settled down $9.50, or 0.7 percent, at $1,280.50 per ounce, 1.8 percent lower on the week.
The net long position of money managers in Comex gold has fallen from a peak in early September but is still elevated.
"Right now, you could see a lot of open interest being abandoned if we don't have another big move (in gold) next week," said George Gero, managing director of RBC Wealth Management in New York.
The European Central Bank is expected to say on Oct. 26 it will start trimming its monthly asset purchases to 40 billion euros from 60 billion euros in January, a Reuters poll showed.
COT Report
Aussie dollar holds rather high net long position. It stands not at ultimate high, but close enough and makes pressure on AUD dynamic. Last four weeks we see clear action, that is typical for retracement. Net long position was dropping simultaneously with decreasing of open interest - some longs were closed, and probably by short-term traders.
At the same time, the pace of this decreasing is slow which also tells about retracement nature of recent action.
Thus, right now we could suggest that sentiment mostly is still bullish here, but market has taken pause in upward action.
In our last report, dedicated to AUD we've prepared wide fundamental analysis of situation in economy and RBA view on AUD rate. As a result we've come to conlcusion that -
" the only driving factor for AUD could be inner ones, as commodity export and it's prices. If overall commodities bullish trend will continue - then AUD will keep chances to proceed to higher levels, but in short-term perspective, within 1-2 months its upside potential looks limited and stands around 0.8150-0.82 area. At the same time, hardly we will get strong sell-off as well, as situation around AUD mostly looks positive by far."
And now indeed, it seems that market keeps this scenario.
Technical
Monthly
On monthly chart we have one important change compares to what we saw in September. Price has not quite reached major target here, but formed bearish reversal candle, that was also a kind of W&R. Take a look that price has shown spike up and closed almost below August lows. This type of action calls as "reversal candle". And usually it leads at least to more extended retracement down.
Among other patterns we still have the same AB-CD pattern stands in focus. Trend is bullish here. Right now market has limited upside potential. As we can see, 0.81-0.82 is very strong resistance that includes YPR1, major 3/8 Fib resistance, AB-CD target @ 0.8165.
It means that there are big chances that in 0.8150-0.8250 area we need to keep an eye on bearish reversal pattern on daily time frame. Still, market should try to show some upside continuation as major monthly target has not been reached yet.
The only thing that hesitates me is our reversal candle. Usually markets form it out of target, when it has been met. In our case it has not been reached for ~40 pips. This is very small distance for monthly time frame. But, as you understand it could lead us to opposite analysis, depending how we will treat this target either as been hit, or not been hit yet...
So, as a result, monthly analysis doesn't give us a lot of clarity. Although major target has not been hit yet, reversal candle in September assumes slightly greater retracement down before upside reversal will happen again, if it will happen of course. Now we're mostly are interested with this retracement and its final point.
Weekly
On weekly chart trend stands bearish, but there are two moments that suggest deeper upside retracement. (It is difficult to suggest it, because now we have different setups on EUR, AUD, NZD and GBP - although all of them stand in relation to USD.)
First moment is bearish reversal swing itself. As market has reached strong support area of former top, MPS1 and 3/8 Fib level - aussie has turned to upside bounce. Usually after reversal swings opposite retracement is deep.
Second - bullish engulfing pattern that has been formed recently. So, it seems that some kind of AB=CD pattern should happen on lower time frame:
Daily
Daily chart brings nothing special, except may be K-support area in addition to weekly single Fib level. That's why I use it to draw approximate action that should happen in nearest future based on technical picture that we have.
Take a look that daily AUD also has formed small reversal swing but it stands upward. It means that we should get minor bearish AB=CD pattern that mostly has been completed already.
Next step should be up as final "CD" leg of AB=CD retracement.
And finally third step is final leg of downside AB-CD retracement that is suggested by monthly candle.
Now let's see what to expect on coming week and what patterns we will watch for. Why, we suggest particular this kind of action...
Intraday
Indeed, most interesting stuff we could find on intraday charts. Here is why we expect higher AB=CD retracement - just because we have reverse H&S pattern on 4-hour chart. If it will start right at the moment as we've drawn - it's target will be around 5/8 Fib level @ 0.7975 and this is potential area where we should watch chances to sell:
This upward action, in turn, could start from perfect "222" Buy on hourly chart:
Theoretically downside action should stop around 0.78, but CD leg is rather fast and it also takes the shape of butterfly. That's why it could happen that price will dive a bit lower, to 1.618 extension. It doesn't change the major idea, just minor technical detail.
So as you can see all patterns on different time frames stand in fascinating harmony to each other. But, besides of positive moments that stands due, it also has one negative feature if some pattern will fail - it will lead to chain reaction of consecutive failings, so just keep your eyes open and control key levels.
Conclusion:
AUD has positive sentiment but in perspectives of 1-2 months it has limited upside potential, mostly because of absence of driving factors. USD weakness probably will take a pause, RBA policy right now mostly stands flat and only driving factors for AUD that we see are Trade Balance, Export volume and Import/Export prices. But within 1-2 months we will not get big update on this stats. That's why currently we see upside ceil around 0.8150-0.8250 area.
In shorter-term perspective, we mostly intend to trade inside monthly reversal candle as a lot of clear patterns have been formed there.
The technical portion of Sive's analysis owes a great deal to Joe DiNapoli's methods, and uses a number of Joe's proprietary indicators. Please note that Sive's analysis is his own view of the market and is not endorsed by Joe DiNapoli or any related companies.
") so great to be able to rely on you reports. Thank you for your hard work week after week, brilliant.
so great to be able to rely on you reports. Thank you for your hard work week after week, brilliant.