Sive Morten
Special Consultant to the FPA
- Messages
- 18,669
Fundamentals
As we've promised - today we take a look at GBP. Things that we've discussed 3-4 weeks ago now are gradually coming to reality. We talked about upside pullback due growing political concern, early voting and overextended bearish positions - this pullback is done. We said that BoE has to adjust its policy as it doesn't correspond to reality - and now BoE representatives make statements that policy will be adjusted. But all these moments stand in environment of our bearish long-term view on GBP. They are just details of this big trend.
This week brings us a lot of new inputs for our analysis. Week has started with caution market reaction and pound fell half a percent on Wednesday as investors braced for more British political uncertainty in the coming months after the United Kingdom’s Supreme Court ruled that Prime Minister Boris Johnson had unlawfully suspended parliament a few weeks before Britain was scheduled to leave the European Union.
The Supreme Court’s decision called Johnson’s suspension of parliament unlawful and said lawmakers should return to sitting.
While the ruling reduced the likelihood of Britain leaving the European Union without a deal by Oct. 31, it also opened the doors to various options including a new election, a delay in Brexit, or even a second referendum.
“Predicting the ultimate outcome of Brexit remains difficult,” said Mark Haefele, chief investment officer at UBS Global Wealth Management.
“As a result, the longer-term risk-return outlook for UK equities looks uncertain and we still advise being nimble on sterling.”
“The main risk now is that we are in a never-ending limbo,” said Kit Juckes, an FX strategist at Societe Generale in London.
Later, on Friday, pound has dropped more showing its worst weekly performance since early August after a Bank of England policymaker said the central bank may well need to cut interest rates in the likely scenario that high levels of Brexit uncertainty persist.
The dovish comments from BoE policymaker Michael Saunders cap a tough week for the pound, in which concerns about a deepening political standoff in a reconvened parliament over Brexit have undone much of the currency’s recent recovery.
While lawmakers have passed legislation that forces Prime Minister Boris Johnson’s government to seek a Brexit delay and avoid a no-deal exit from the European Union on Oct. 31, Johnson continues to vow that Britain will leave next month.
“It’s in contrast to the last MPC (monetary policy committee) minutes, which still guide the market to a rate hike in the case of an orderly Brexit,” said Kallum Pickering, an economist at Berenberg.
Pickering said Saunders was a “known hawk” so his dovish tilt was important, especially if the view that a rate cut could be necessary even if no-deal Brexit was averted became more widely shared by other policymakers.
On the other hand, Pickering noted that the UK domestic economy was “holding up well” and inflation pressures were still to the upside.
Viraj Patel, a strategist at Arkera, said Saunders was “typically nimble in his views”, hadn’t spoken for some time and noted that external MPC members often have “very different views to internal BoE”.
CFTC data shows no big changes. As we've suggested, net short position stepped out a bit from the bottom but still stands around it. All time lows stand around 102K contracts, now position is around 80K contracts. Decreasing of net short position was slow and gradual, that reflects retracement type of action, while major bearish positions are still on the market:

Source: cftc.gov
Charting by Investing.com
Since it is a lot of rumors and rush around Brexit deadline, we take a look at Fathom opinion on ongoing processes, what they think about it.
In their new article "Brexit woes continue as UK economic sentiment hits ten-year low", they discover all nuances of current situation.
Fathom’s Economic Sentiment Indicators (ESIs) distil the information contained within numerous surveys into composite measures of underlying sentiment. The UK ESI dropped to -0.2% in August, the lowest since the crisis, and continues the downward trend in sentiment that began last year. The drop was driven by expectations, with the forward-looking components of the ESI performing the worst. Only two of our thirteen components showed improvements from July.
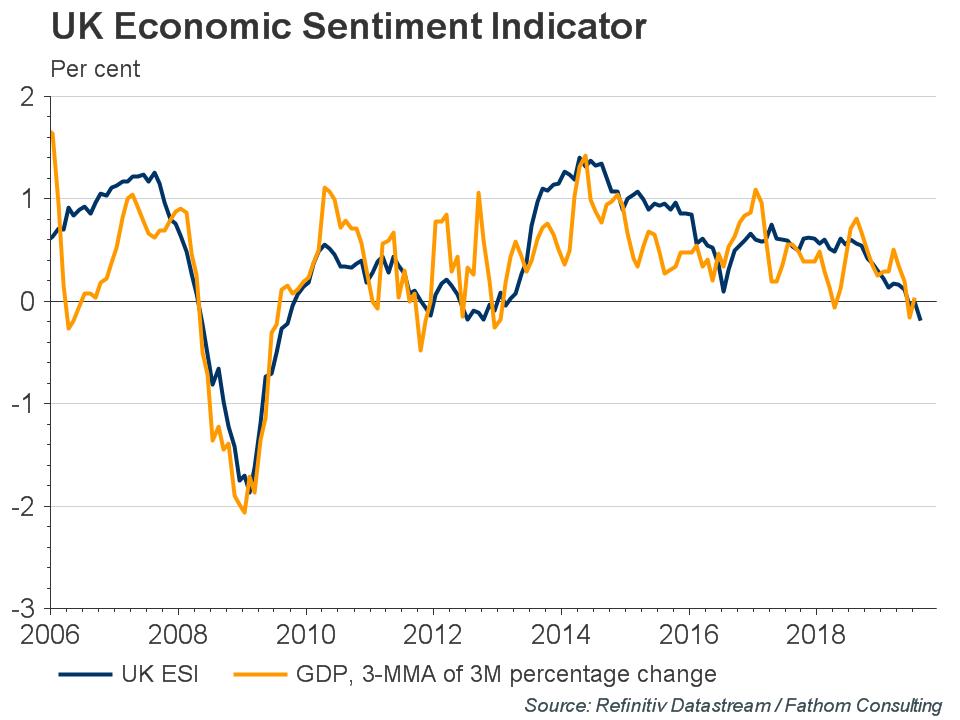
Before being shut down earlier this month, the British parliament passed a bill intended to prevent a ‘no-deal’ Brexit on 31 October. Despite the recent rhetoric, the possibility of Boris Johnson obtaining a deal with the European Union looks as distant as ever. We anticipate a further extension of at least three months and an election before the end of the year. The uncertainty plaguing both business and household expectations looks set to stay.
This has been clearly reflected in currency markets over the last few months. In early September sterling briefly traded below $1.20, its lowest in three years. Excluding the ‘flash crash’ of October 2016, which was probably to do with an algorithmic mishap as opposed to economic fundamentals, it was the lowest since 1985. Brexit even brought about the most unusual of currency movements — sterling appreciated as the government lost its majority and looked likely to collapse.
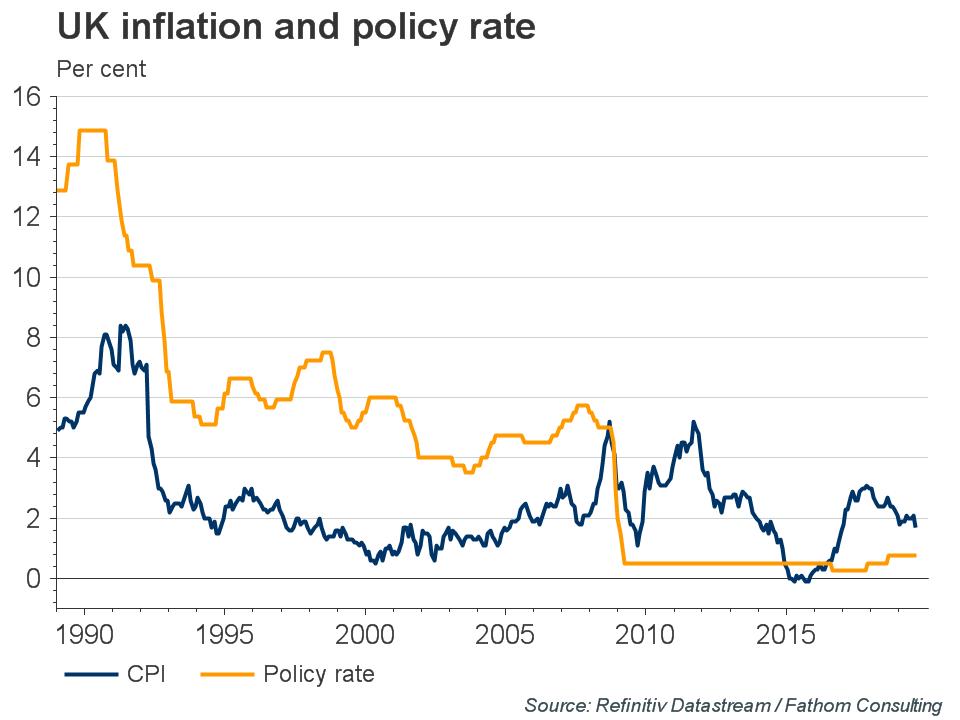
The Bank of England will be closely watching how Brexit feeds through to inflation and the overall health of the economy. There are forces that could move inflation either way. Higher prices for UK consumers — through a weaker pound and higher tariffs on imports from the EU — could warrant an increase in the policy rate. Fathom’s own estimates predict that an orderly ‘no-deal’ Brexit would knock 2% off the level of GDP, which would warrant a rate cut. Therefore, the Bank maintains that interest rates could also go either way. The overwhelming sense though, is that the UK economy would need a boost. On Thursday the Bank said that “uncertainty was in danger of becoming entrenched”, and that interest rate cuts were now more likely.
That's being said guys, it seems that it is time to consider re-establishing of long-term bearish position. Brexit will be either postponed or "hard", elections will start at the end of the year. Three months postponing is too short time to move forward in Brexit negotiations, especially when your government stands in unclear position. It is also the question what government will be formed. BoE changes rhetoric and prepares for the rate cut. All this stuff confirms our long-term bearish view. Technical retracement that we've got in last 2-3 weeks mostly is done.
Technicals
Monthly
Here we see the result of our trading plan. Upside bounce has happened and cable re-tested broken YPS1 and previous lows. At the same time monthly chart still shows no signs that could make us doubt on bearish long-term setup by far. Market has free space between 1.20 lows and our 1.1335 butterfly target. Breaking YPS1 confirms existence of long-term bear trend as well.
In longer-term perspective market stands with our all time AB-CD pattern. COP target and following retracement are done. Now CD leg continues and in long-term perspective, we have OP target at 0.95 level.

Weekly
When we just planned our retracement we considered two possible target levels - 1.25 and 1.28 K-area. First level has been hit and it seems that hardly we will get continuation to 1.28, taking in consideration current fundamental background and fast approach of 31st of October.
By this upward action GBP has completed minimal target of the butterfly showing 3/8 upside reaction on its 1.27 level.
As a result we've got nice "Evening star" pattern on weekly chart which suggests downside continuation.
Nearest target here is 1.18 area, which is weekly oversold and butterfly 1.618 extension.

Daily
Trend stands bearish here. GBP perfectly has completed "2X" target of our Double Bottom pattern and turned down again. Now it shows good pace, we see thrusting type action, which could be first signs of major trend continuation.
Now market stands at support of 3/8 Fib level, former neckline and near OS level. This should be good for us as we could get upside bounce for short entry:

Intraday
Drop has started by perfect H&S pattern, which has not reached yet the final target of XOP around 1.2230 area. It means that pullback will start a bit later, when XOP will be hit. Preliminary targets for position taking stand around first two levels. Now they are 1.2358 and 1.2390 K-resistance.
Since we watch for retracement back in weekly Evening star body - it should not be too high. As usual we will keep an eye on possible bearish patterns, such as "222".

Conclusion:
Analysis of fundamental factors this week confirms existing of bearish sentiment and we keep our long-term bearish view on GBP. In longer term perspective we expect that GBP will trade lower due Brexit culmination and more adopted BoE policy which now stands out of reality a bit. Technically, we have two targets - 1.13 and 0.95.
In shorter-term perspective, it seems that our bounce is completed, at least hot political situation in UK and coming adjustments of BoE policy support downside reversal on cable. Thus, on coming week we intend to consider new bearish positions.
The technical portion of Sive's analysis owes a great deal to Joe DiNapoli's methods, and uses a number of Joe's proprietary indicators. Please note that Sive's analysis is his own view of the market and is not endorsed by Joe DiNapoli or any related companies.
As we've promised - today we take a look at GBP. Things that we've discussed 3-4 weeks ago now are gradually coming to reality. We talked about upside pullback due growing political concern, early voting and overextended bearish positions - this pullback is done. We said that BoE has to adjust its policy as it doesn't correspond to reality - and now BoE representatives make statements that policy will be adjusted. But all these moments stand in environment of our bearish long-term view on GBP. They are just details of this big trend.
This week brings us a lot of new inputs for our analysis. Week has started with caution market reaction and pound fell half a percent on Wednesday as investors braced for more British political uncertainty in the coming months after the United Kingdom’s Supreme Court ruled that Prime Minister Boris Johnson had unlawfully suspended parliament a few weeks before Britain was scheduled to leave the European Union.
The Supreme Court’s decision called Johnson’s suspension of parliament unlawful and said lawmakers should return to sitting.
While the ruling reduced the likelihood of Britain leaving the European Union without a deal by Oct. 31, it also opened the doors to various options including a new election, a delay in Brexit, or even a second referendum.
“Predicting the ultimate outcome of Brexit remains difficult,” said Mark Haefele, chief investment officer at UBS Global Wealth Management.
“As a result, the longer-term risk-return outlook for UK equities looks uncertain and we still advise being nimble on sterling.”
“The main risk now is that we are in a never-ending limbo,” said Kit Juckes, an FX strategist at Societe Generale in London.
Later, on Friday, pound has dropped more showing its worst weekly performance since early August after a Bank of England policymaker said the central bank may well need to cut interest rates in the likely scenario that high levels of Brexit uncertainty persist.
The dovish comments from BoE policymaker Michael Saunders cap a tough week for the pound, in which concerns about a deepening political standoff in a reconvened parliament over Brexit have undone much of the currency’s recent recovery.
While lawmakers have passed legislation that forces Prime Minister Boris Johnson’s government to seek a Brexit delay and avoid a no-deal exit from the European Union on Oct. 31, Johnson continues to vow that Britain will leave next month.
“It’s in contrast to the last MPC (monetary policy committee) minutes, which still guide the market to a rate hike in the case of an orderly Brexit,” said Kallum Pickering, an economist at Berenberg.
Pickering said Saunders was a “known hawk” so his dovish tilt was important, especially if the view that a rate cut could be necessary even if no-deal Brexit was averted became more widely shared by other policymakers.
On the other hand, Pickering noted that the UK domestic economy was “holding up well” and inflation pressures were still to the upside.
Viraj Patel, a strategist at Arkera, said Saunders was “typically nimble in his views”, hadn’t spoken for some time and noted that external MPC members often have “very different views to internal BoE”.
CFTC data shows no big changes. As we've suggested, net short position stepped out a bit from the bottom but still stands around it. All time lows stand around 102K contracts, now position is around 80K contracts. Decreasing of net short position was slow and gradual, that reflects retracement type of action, while major bearish positions are still on the market:
Source: cftc.gov
Charting by Investing.com
Since it is a lot of rumors and rush around Brexit deadline, we take a look at Fathom opinion on ongoing processes, what they think about it.
In their new article "Brexit woes continue as UK economic sentiment hits ten-year low", they discover all nuances of current situation.
Fathom’s Economic Sentiment Indicators (ESIs) distil the information contained within numerous surveys into composite measures of underlying sentiment. The UK ESI dropped to -0.2% in August, the lowest since the crisis, and continues the downward trend in sentiment that began last year. The drop was driven by expectations, with the forward-looking components of the ESI performing the worst. Only two of our thirteen components showed improvements from July.
Before being shut down earlier this month, the British parliament passed a bill intended to prevent a ‘no-deal’ Brexit on 31 October. Despite the recent rhetoric, the possibility of Boris Johnson obtaining a deal with the European Union looks as distant as ever. We anticipate a further extension of at least three months and an election before the end of the year. The uncertainty plaguing both business and household expectations looks set to stay.
This has been clearly reflected in currency markets over the last few months. In early September sterling briefly traded below $1.20, its lowest in three years. Excluding the ‘flash crash’ of October 2016, which was probably to do with an algorithmic mishap as opposed to economic fundamentals, it was the lowest since 1985. Brexit even brought about the most unusual of currency movements — sterling appreciated as the government lost its majority and looked likely to collapse.
The Bank of England will be closely watching how Brexit feeds through to inflation and the overall health of the economy. There are forces that could move inflation either way. Higher prices for UK consumers — through a weaker pound and higher tariffs on imports from the EU — could warrant an increase in the policy rate. Fathom’s own estimates predict that an orderly ‘no-deal’ Brexit would knock 2% off the level of GDP, which would warrant a rate cut. Therefore, the Bank maintains that interest rates could also go either way. The overwhelming sense though, is that the UK economy would need a boost. On Thursday the Bank said that “uncertainty was in danger of becoming entrenched”, and that interest rate cuts were now more likely.
That's being said guys, it seems that it is time to consider re-establishing of long-term bearish position. Brexit will be either postponed or "hard", elections will start at the end of the year. Three months postponing is too short time to move forward in Brexit negotiations, especially when your government stands in unclear position. It is also the question what government will be formed. BoE changes rhetoric and prepares for the rate cut. All this stuff confirms our long-term bearish view. Technical retracement that we've got in last 2-3 weeks mostly is done.
Technicals
Monthly
Here we see the result of our trading plan. Upside bounce has happened and cable re-tested broken YPS1 and previous lows. At the same time monthly chart still shows no signs that could make us doubt on bearish long-term setup by far. Market has free space between 1.20 lows and our 1.1335 butterfly target. Breaking YPS1 confirms existence of long-term bear trend as well.
In longer-term perspective market stands with our all time AB-CD pattern. COP target and following retracement are done. Now CD leg continues and in long-term perspective, we have OP target at 0.95 level.
Weekly
When we just planned our retracement we considered two possible target levels - 1.25 and 1.28 K-area. First level has been hit and it seems that hardly we will get continuation to 1.28, taking in consideration current fundamental background and fast approach of 31st of October.
By this upward action GBP has completed minimal target of the butterfly showing 3/8 upside reaction on its 1.27 level.
As a result we've got nice "Evening star" pattern on weekly chart which suggests downside continuation.
Nearest target here is 1.18 area, which is weekly oversold and butterfly 1.618 extension.
Daily
Trend stands bearish here. GBP perfectly has completed "2X" target of our Double Bottom pattern and turned down again. Now it shows good pace, we see thrusting type action, which could be first signs of major trend continuation.
Now market stands at support of 3/8 Fib level, former neckline and near OS level. This should be good for us as we could get upside bounce for short entry:
Intraday
Drop has started by perfect H&S pattern, which has not reached yet the final target of XOP around 1.2230 area. It means that pullback will start a bit later, when XOP will be hit. Preliminary targets for position taking stand around first two levels. Now they are 1.2358 and 1.2390 K-resistance.
Since we watch for retracement back in weekly Evening star body - it should not be too high. As usual we will keep an eye on possible bearish patterns, such as "222".
Conclusion:
Analysis of fundamental factors this week confirms existing of bearish sentiment and we keep our long-term bearish view on GBP. In longer term perspective we expect that GBP will trade lower due Brexit culmination and more adopted BoE policy which now stands out of reality a bit. Technically, we have two targets - 1.13 and 0.95.
In shorter-term perspective, it seems that our bounce is completed, at least hot political situation in UK and coming adjustments of BoE policy support downside reversal on cable. Thus, on coming week we intend to consider new bearish positions.
The technical portion of Sive's analysis owes a great deal to Joe DiNapoli's methods, and uses a number of Joe's proprietary indicators. Please note that Sive's analysis is his own view of the market and is not endorsed by Joe DiNapoli or any related companies.