Sive Morten
Special Consultant to the FPA
- Messages
- 18,664
Fundamentals
So, this week mostly was full of political events:
Thus, events are running with unbelievable speed. But, actually the party is started a week before, when Mr. Xi has come to Moscow. Immediately US Dollar starts feeling bad. We do not know, whether ongoing processes have started earlier and only now have become public, or they are just running too fast and have an effect with almost no time lag. Well, or, the previously hidden actions of large countries now become public and begin to actively form a new reality. Well, for more fun — credit default swaps on one-year Treasury securities jumped sharply:
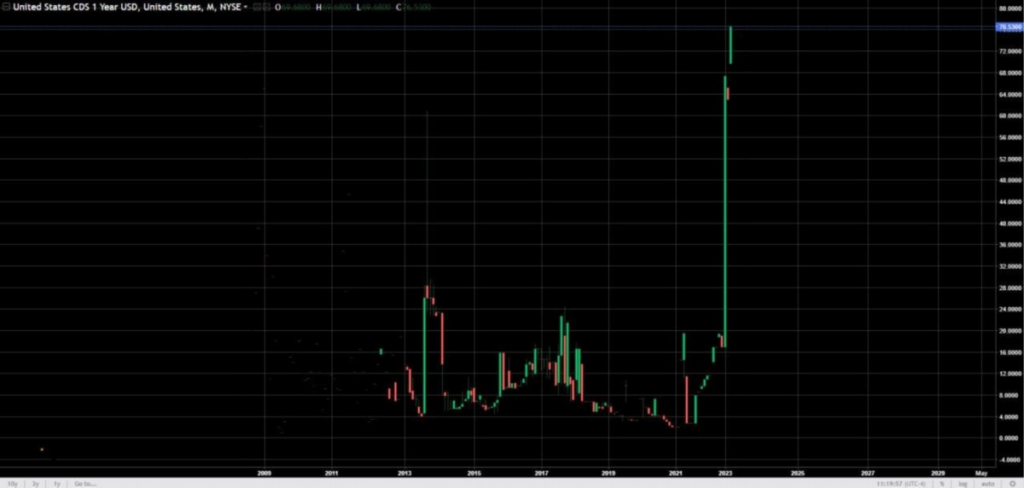
The dollar weight as reserve currency has dropped from 72% in 1999 to ~59% now. Second - US default spreads jump to a new highs. It is a nonsense, but open market has its own rules. Besides, It indicates some sentiment.
But - all this stuff is foreign affairs mostly. What we're going to do with our own issues - inflation and FED/ECB policy. At first glance it is difficult to say something definite, as nobody knows. But, if we go step by step - reasonable and definite conclusions could be made.
MARKET OVERVIEW
Let's first consider what markets expect... and what they use as a background
The dollar rose against the euro on Friday but was on track for its fifth straight weekly loss against the common currency, after slower U.S. consumer spending growth boosted hopes the Federal Reserve would be less aggressive in hiking interest rates. U.S. consumer spending rose moderately in February after surging the prior month, and while inflation showed signs of cooling it remained elevated, which could prompt the Fed to raise interest rates once more this year.
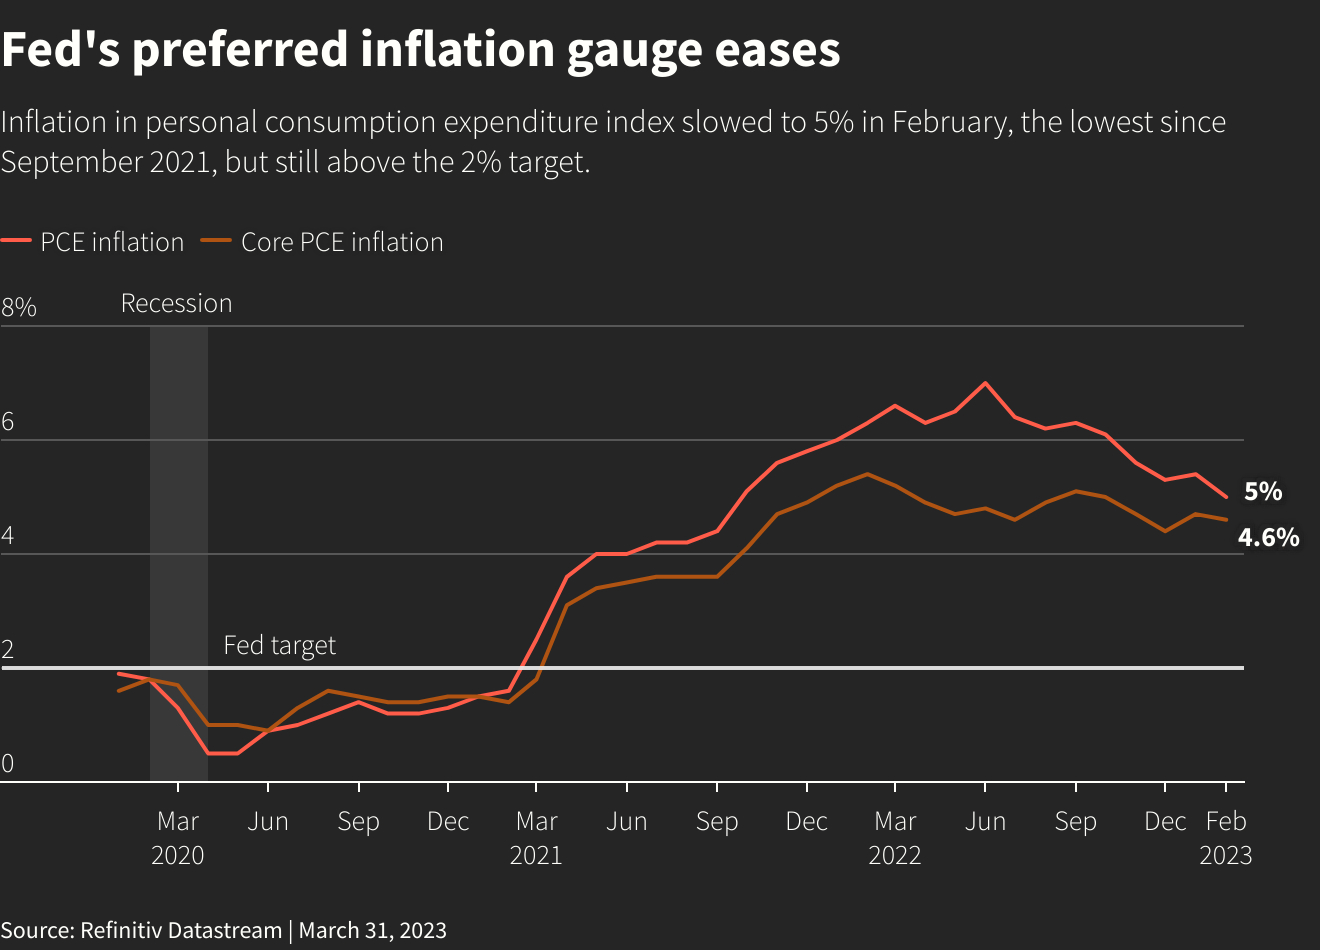
Earlier in the session, data showed euro zone inflation dropped by the most on record in March, but core price pressures, which exclude food and energy, accelerated, maintaining pressure on the European Central Bank to keep raising rates.
Consumer prices in the euro zone rose by 6.9% in March after an 8.5% increase in February, implying the biggest drop since Eurostat started collecting data in 1991. But the fall was almost exclusively due to lower energy prices compared to March last year. A measure that excludes energy and food prices, known by economists as core inflation and seen as a better gauge of the underlying trend, meanwhile accelerated to a new all-time high of 7.5% from 7.4% in February.
Analysts polled by Reuters had expected headline inflation in the 20 countries that share the euro to come in at 7.1% and core inflation at 7.5%.

However, data on Friday from the euro zone's two biggest economies pointed to a softening in consumers' ability to spend - ultimately the main driver of price growth. French consumer spending unexpectedly fell in February, as did German retail sales, while a European Commission survey published a day earlier showed households want to save more. German import prices also registered their smallest increase in two years in February as energy prices eased.
Money-market prices show investors expect a 25-basis-point rate hike by the ECB at its next meeting on May 6, followed by another one or possibly two of the same size over the summer. Strengthening the case for more tightening, euro zone unemployment remained stubbornly low at 6.6%.
The Fed is seen as about as likely to raise its benchmark overnight interest rate in May as not. But even if it does, it is expected to reverse course quickly and end the year with rates lower than it began, according to futures contracts tied to the U.S. central bank's policy rate.
U.S. Federal Reserve Governor Christopher Waller on Friday said recent data is consistent with the notion that the U.S. central bank may be able to drive down inflation without serious harm to the labor market.
A gauge of global stocks was on course for its biggest weekly percentage gain in 4-1/2 months on Friday, with the two-year U.S. Treasury yield set for its first quarterly decline in the past nine, as U.S. inflation data fueled hopes the Federal Reserve may be reaching the end of its rate hiking cycle. U.S. consumer spending rose moderately in February, and while inflation cooled, it remained elevated enough to possibly allow the Federal Reserve to raise interest rates one more time this year.
Expectations for a 25 basis point rate hike at its May meeting dipped to about 50%, with no hike seen to be just as likely. The dollar pared some gains against the euro in the wake of the U.S inflation data, as investors see the Fed pausing its rate hiking cycle before the European Central Bank.
So, conclusion is obvious - market expects Fed capitulation in a way of rate freeze or even cut after May change for 25 b.p., because it looks like inflation is slowing. ECB in turn, is expected to keep rising rates at least two, but maybe free times more by 25 points, leading rate up to 4.75%, which is very close to current Fed rate.
BUT WHAT FED AND ECB THEMSELVES TELL ABOUT THE RATE?
Three Federal Reserve officials kept the door open on Thursday to more rate rises aimed at lowering high levels of inflation, with two noting banking sector problems could generate enough headwinds on the economy to help cool price pressures faster than expected.
Speaking separately, Minneapolis Fed leader Neel Kashkari, who does have a vote on the FOMC, also said the institution has "more work to do," but he did not characterize what action he'd like to see take place.
Richmond Federal Reserve bank president Thomas Barkin said Thursday that he had not come to a view yet on what rate increase might be appropriate at the Fed's May 1-2 session, and is "comfortable" with meeting-by-meeting decisions on whether or not to move by a quarter of a basis point.
Inflation in the euro zone dropped by the most on record in March but "core" price growth accelerated (see chart above), which is likely to strengthen the case for more interest rate hikes by the European Central Bank. After a record streak of rate rises, the ECB has refrained from committing to more, saying this will depend on whether the current turmoil in the banking sector subsides and on data including underlying inflation, which excludes volatile prices such as food and energy.
European Central Bank interest rates will likely have to rise further to contain inflation, policymakers said on Wednesday, but at least one outspoken conservative floated the idea of a slowdown in the pace of increases. ECB chief economist Philip Lane, who makes the formal policy proposals to his 25 colleagues, said that his baseline is for the turmoil to dissipate and then rates would need to rise several times.
Concerning banking crisis Lane argued that euro zone banks were well capitalised so there is no direct read-across from U.S. and Swiss banking tensions to the 20 nation currency bloc but the ECB was ready in any case to provide liquidity. Lane added that a recession is not necessary to bring inflation down and a soft landing of the economy was possible.
Slovak central bank chief Peter Kazimir, a proponent of rapid rate increases, meanwhile made the case for slower rises following three straight 50-basis point hikes.
LET'S GO WITH ANALYSIS
Based on information above we see that sequence is as follows - "inflation is slowing down, consumption is slowing, i.e. whole economy is slowing with means that central banks also do not need to rise rates aggressively". Fed is almost done, while ECB somewhere near the finish as well. So, to confirm or not we should make some reasonable decision concerning inflation. And here there are two moments should help us. First is - money supply indicator, which we have to treat correctly, second - banks ability to support and fund production and manufacturing sector.
First - let's take a look on money supply, cash and deposits (M1) and accounts (M2(US)/M3 (EU)):

Investors moved $508 billion into cash in the first three months of this year, the largest quarterly inflow since market turmoil early in the COVID-19 pandemic, according to BofA Global Research, as the failure of several banks sent markets spinning. Flows into cash of $60.1 billion in the week to Wednesday were down from $142.9 billion the previous week, but the quarterly dash for cash was the biggest since the first quarter of 2020, BofA said on Friday, citing data from EPFR.
Investors dumped bank stocks, with a net $600 million outflow from financial equity funds in the week. Gold funds attracted a net $500 million, and bond funds a net $2.3 billion.
At first glance - what's the problem? Money base is dropping which should make holding effect on inflation. Someone should say, "Hooray! Inflation will start to decline!", but this is not the case. During the structural crisis, the growth of inflation is largely in the nature of rising costs (the maintenance of a distorted structure of the economy is becoming more expensive). It is based on constant expenses' value of all economic sectors that were tuned for larger demand level. When monetary base is dropping, production is slowing more as economy start feeling funding starvation. While constant expenses remains and prices rise even higher. This growth is not monetary by nature, you cannot eliminate it by reducing the money supply.
Moreover, since a decrease in the money supply reduces the investment process, cost inflation is growing, as mentioned above, an increase in the rate causes an increase in the structural component of inflation. So, most likely, such a slow growth of the money supply (much lower even than official inflation) means an increase in the degradation processes in the economy. Recall dropping Commodity PPI indicator from our previous reports.
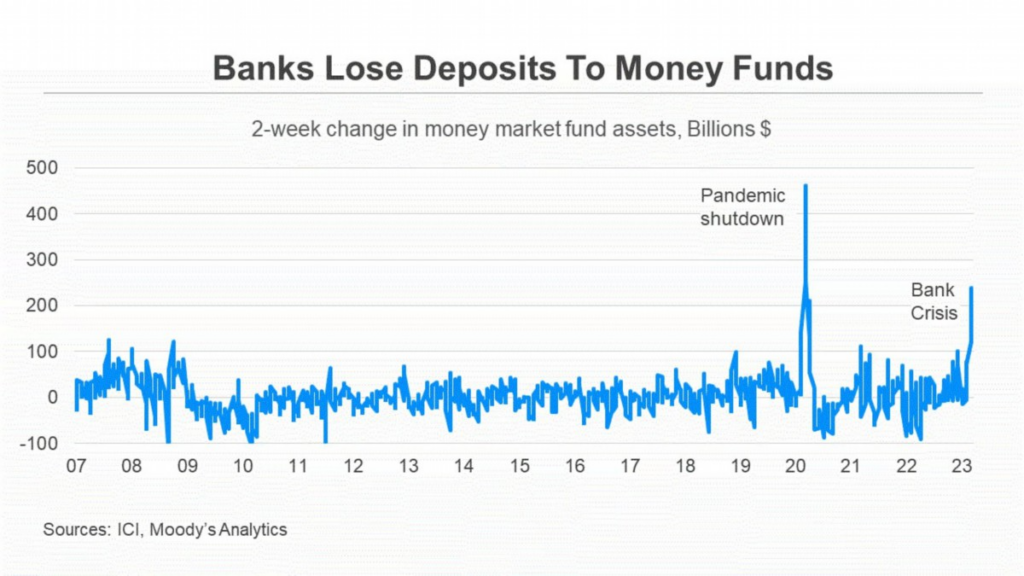
Actually, recent EU Core CPI indicator above just confirms this. Besides, for banks, earning opportunities are falling — which was demonstrated by the US financial elite in the recently organized crisis. In general, on the background of the inflation fight, the economy is starting to fall, which we see in numbers, but the problem is banks that have received significant amounts of money over the past three weeks will not help here. Since they do not want to make investments (the risks are too great), and speculation will not help the economy, only inflation will jump, already the monetary component. Moreover, citizens, as we have already noted, withdraw deposits and invest money in speculative instruments:
And in such a situation, banks are forced to reconsider their ability to invest "for a long time" relying on the deposits of citizens: the risks here begin to grow seriously. Accordingly, the US economy is starting to sink … Where? Take a look at production, unemployment and consumption as in US, EU and other countries:

The last update from Fed confirms our view. Take a look:
US Treasury has on the Fed's account only $163 billion, so they can last until June if there are no more bankruptcies. The FDIC is devastated, so all subsequent bankruptcies are solely at the expense of the printing and/or taxpayers through government spending, which inevitable push deficit higher. Thus, they are on the edge. The debt limit will be raised in June, and they will have to borrow actively soon, but difficulties may arise there.
Same story in EU. The fact that Core CPI is growing is normal. It is always about half a year late: the increase in food and fuel is transferred to other goods and services. By summer, the regular CPI will start to overtake again.
So, this week mostly was full of political events:
- D. Trump arrest rumors;
- China and Brazil have abandoned dollar trading between their countries and have reached an agreement to trade their own currencies;
- Saudi Arabia is considering accepting Chinese yuan for oil sales;
- China and France have completed the first LNG trade using yuan;
- Russia has announced that it is considering using the Chinese yuan as a reserve currency;
- Saudi Arabia is cooperating with China in the construction of an oil refinery worth 83.7 billion Chinese yuan ($12.2 billion);
- China and Brazil have agreed to use the Chinese yuan in cross-border transactions
- Mexico starts talking about BRICs joining, S. Arabia intends to join Shanghai Cooperation Organisation etc...
Thus, events are running with unbelievable speed. But, actually the party is started a week before, when Mr. Xi has come to Moscow. Immediately US Dollar starts feeling bad. We do not know, whether ongoing processes have started earlier and only now have become public, or they are just running too fast and have an effect with almost no time lag. Well, or, the previously hidden actions of large countries now become public and begin to actively form a new reality. Well, for more fun — credit default swaps on one-year Treasury securities jumped sharply:
The dollar weight as reserve currency has dropped from 72% in 1999 to ~59% now. Second - US default spreads jump to a new highs. It is a nonsense, but open market has its own rules. Besides, It indicates some sentiment.
But - all this stuff is foreign affairs mostly. What we're going to do with our own issues - inflation and FED/ECB policy. At first glance it is difficult to say something definite, as nobody knows. But, if we go step by step - reasonable and definite conclusions could be made.
MARKET OVERVIEW
Let's first consider what markets expect... and what they use as a background
The dollar rose against the euro on Friday but was on track for its fifth straight weekly loss against the common currency, after slower U.S. consumer spending growth boosted hopes the Federal Reserve would be less aggressive in hiking interest rates. U.S. consumer spending rose moderately in February after surging the prior month, and while inflation showed signs of cooling it remained elevated, which could prompt the Fed to raise interest rates once more this year.
Earlier in the session, data showed euro zone inflation dropped by the most on record in March, but core price pressures, which exclude food and energy, accelerated, maintaining pressure on the European Central Bank to keep raising rates.
"The pressure on the ECB to continue raising interest rates remains high," Commerzbank economist Christoph Weil said.
Consumer prices in the euro zone rose by 6.9% in March after an 8.5% increase in February, implying the biggest drop since Eurostat started collecting data in 1991. But the fall was almost exclusively due to lower energy prices compared to March last year. A measure that excludes energy and food prices, known by economists as core inflation and seen as a better gauge of the underlying trend, meanwhile accelerated to a new all-time high of 7.5% from 7.4% in February.
Analysts polled by Reuters had expected headline inflation in the 20 countries that share the euro to come in at 7.1% and core inflation at 7.5%.
However, data on Friday from the euro zone's two biggest economies pointed to a softening in consumers' ability to spend - ultimately the main driver of price growth. French consumer spending unexpectedly fell in February, as did German retail sales, while a European Commission survey published a day earlier showed households want to save more. German import prices also registered their smallest increase in two years in February as energy prices eased.
"That is, all else equal, disinflationary and it argues that the ECB doesn’t have to do much more," Dirk Schumacher, an economist at Natixis, said.
Money-market prices show investors expect a 25-basis-point rate hike by the ECB at its next meeting on May 6, followed by another one or possibly two of the same size over the summer. Strengthening the case for more tightening, euro zone unemployment remained stubbornly low at 6.6%.
"Slower (U.S.) consumer spending and cooler inflation is consistent with the view that the Fed is almost down," said Joe Manimbo, senior market analyst at Convera in Washington. (In Europe) core inflation accelerated to new record highs. That's consistent with the ECB raising rates more than the Fed as we go through the balance of the year."
The Fed is seen as about as likely to raise its benchmark overnight interest rate in May as not. But even if it does, it is expected to reverse course quickly and end the year with rates lower than it began, according to futures contracts tied to the U.S. central bank's policy rate.
"My gut feeling(!!!) is that the Fed will go for another 25 basis points in May, and that will be it ... but the ECB I can see hiking aggressively still into the summer," Stuart Cole, head macro economist at Equiti Capital, said."You can potentially see that being positive for EUR/USD from the interest rate perspective," he said.
U.S. Federal Reserve Governor Christopher Waller on Friday said recent data is consistent with the notion that the U.S. central bank may be able to drive down inflation without serious harm to the labor market.
If people really have begun to believe that prices are going to just keep on rising, then defeating high inflation could require dramatic actions by the Fed to puncture those expectations, Waller said in remarks prepared for an academic conference at the San Francisco Fed. Dramatic Fed rate hikes could slow the economy suddenly and lead to large job losses.But if what's driving higher prices is a sudden rise in the frequency at which businesses reset their prices -- a theory for which Waller said there is some evidence -- then "inflation can be brought down quickly with relatively little pain in terms of higher unemployment," he said. Recent data are consistent with this story."
A gauge of global stocks was on course for its biggest weekly percentage gain in 4-1/2 months on Friday, with the two-year U.S. Treasury yield set for its first quarterly decline in the past nine, as U.S. inflation data fueled hopes the Federal Reserve may be reaching the end of its rate hiking cycle. U.S. consumer spending rose moderately in February, and while inflation cooled, it remained elevated enough to possibly allow the Federal Reserve to raise interest rates one more time this year.
Expectations for a 25 basis point rate hike at its May meeting dipped to about 50%, with no hike seen to be just as likely. The dollar pared some gains against the euro in the wake of the U.S inflation data, as investors see the Fed pausing its rate hiking cycle before the European Central Bank.
"Fed fund futures are basically pricing in a coin flip of a 25 (basis point) hike in May, but calling that the end of it, if they even go there, so anytime the data doesn’t give the Fed a reason to re-engage hawkishly, the market is going to like it," said Ross Mayfield, investment strategist at Baird in Louisville, Kentucky. It’s not like it was a soft print but it was below consensus on pretty much every metric and the core data is creeping closer to where the Fed wants it."
"This sediment of inflation will not be flushed out for two or three years, and will require further moderate interest rate increases by central banks, regardless of the current banking stress," Ulrich Kater, an economist at German bank Deka, said.
So, conclusion is obvious - market expects Fed capitulation in a way of rate freeze or even cut after May change for 25 b.p., because it looks like inflation is slowing. ECB in turn, is expected to keep rising rates at least two, but maybe free times more by 25 points, leading rate up to 4.75%, which is very close to current Fed rate.
BUT WHAT FED AND ECB THEMSELVES TELL ABOUT THE RATE?
Three Federal Reserve officials kept the door open on Thursday to more rate rises aimed at lowering high levels of inflation, with two noting banking sector problems could generate enough headwinds on the economy to help cool price pressures faster than expected.
"Inflation remains too high, and recent indicators reinforce my view that there is more work to do to bring inflation down to the 2% target associated with price stability," Federal Reserve Bank of Boston leader Susan Collins said in remarks to a gathering of the National Association for Business Economics.
Speaking separately, Minneapolis Fed leader Neel Kashkari, who does have a vote on the FOMC, also said the institution has "more work to do," but he did not characterize what action he'd like to see take place.
The one area that is particularly concerning right now is that the services economy, outside of housing, has not shown any sign of slowing down," he said. "Wage growth is still growing faster than what is consistent with our 2% inflation target; that tells me we still have more work to do to bring the services side of the economy back into balance... we know we have to get inflation down, and we will."
"Banking panics and banking stresses tend to take longer than you think" to resolve, he said. "It's probably going to take us a while to understand, are there more losses out there?" And while the U.S. banking system is sound and the vast majority of banks have positioned themselves for higher rates, he said, "what's unclear right now is how much the banking stresses of the past few weeks is leading to a sustained credit crunch, which would then slow down the U.S. economy."
Richmond Federal Reserve bank president Thomas Barkin said Thursday that he had not come to a view yet on what rate increase might be appropriate at the Fed's May 1-2 session, and is "comfortable" with meeting-by-meeting decisions on whether or not to move by a quarter of a basis point.
Now to ECB:Inflation, meanwhile, "is still very high. The job market is still really tight," he said in comments to the Virginia Council of CEOs. "There is a lot of uncertainty about what if anything this bank situation does to consumer confidence, business confidence, business investment, consumer spending, availability of credit....There are a lot of questions about what is going to happen to demand and inflation," Barkin said. "It is pretty hard to know here on the 30th of March."
Inflation in the euro zone dropped by the most on record in March but "core" price growth accelerated (see chart above), which is likely to strengthen the case for more interest rate hikes by the European Central Bank. After a record streak of rate rises, the ECB has refrained from committing to more, saying this will depend on whether the current turmoil in the banking sector subsides and on data including underlying inflation, which excludes volatile prices such as food and energy.
European Central Bank interest rates will likely have to rise further to contain inflation, policymakers said on Wednesday, but at least one outspoken conservative floated the idea of a slowdown in the pace of increases. ECB chief economist Philip Lane, who makes the formal policy proposals to his 25 colleagues, said that his baseline is for the turmoil to dissipate and then rates would need to rise several times.
"Under our baseline scenario, in order to make sure inflation comes down to 2%, more hikes will be needed," German newspaper Die Zeit quoted Lane as saying. "If the financial stress we see is non-zero, but turns out to be still fairly limited, interest rates will still need to go up."
Concerning banking crisis Lane argued that euro zone banks were well capitalised so there is no direct read-across from U.S. and Swiss banking tensions to the 20 nation currency bloc but the ECB was ready in any case to provide liquidity. Lane added that a recession is not necessary to bring inflation down and a soft landing of the economy was possible.
Slovak central bank chief Peter Kazimir, a proponent of rapid rate increases, meanwhile made the case for slower rises following three straight 50-basis point hikes.
"I personally think that if we do not significantly veer from the baseline scenario, we should not let up, that means we should continue raising interest rates, maybe at a slower pace, but we should continue," Kazimir told a news conference.
LET'S GO WITH ANALYSIS
Based on information above we see that sequence is as follows - "inflation is slowing down, consumption is slowing, i.e. whole economy is slowing with means that central banks also do not need to rise rates aggressively". Fed is almost done, while ECB somewhere near the finish as well. So, to confirm or not we should make some reasonable decision concerning inflation. And here there are two moments should help us. First is - money supply indicator, which we have to treat correctly, second - banks ability to support and fund production and manufacturing sector.
First - let's take a look on money supply, cash and deposits (M1) and accounts (M2(US)/M3 (EU)):
Investors moved $508 billion into cash in the first three months of this year, the largest quarterly inflow since market turmoil early in the COVID-19 pandemic, according to BofA Global Research, as the failure of several banks sent markets spinning. Flows into cash of $60.1 billion in the week to Wednesday were down from $142.9 billion the previous week, but the quarterly dash for cash was the biggest since the first quarter of 2020, BofA said on Friday, citing data from EPFR.
Investors dumped bank stocks, with a net $600 million outflow from financial equity funds in the week. Gold funds attracted a net $500 million, and bond funds a net $2.3 billion.
"Panic, flush, unwind, then Fed blinked and off we rally into April," BofA said in the report.
At first glance - what's the problem? Money base is dropping which should make holding effect on inflation. Someone should say, "Hooray! Inflation will start to decline!", but this is not the case. During the structural crisis, the growth of inflation is largely in the nature of rising costs (the maintenance of a distorted structure of the economy is becoming more expensive). It is based on constant expenses' value of all economic sectors that were tuned for larger demand level. When monetary base is dropping, production is slowing more as economy start feeling funding starvation. While constant expenses remains and prices rise even higher. This growth is not monetary by nature, you cannot eliminate it by reducing the money supply.
Moreover, since a decrease in the money supply reduces the investment process, cost inflation is growing, as mentioned above, an increase in the rate causes an increase in the structural component of inflation. So, most likely, such a slow growth of the money supply (much lower even than official inflation) means an increase in the degradation processes in the economy. Recall dropping Commodity PPI indicator from our previous reports.
Actually, recent EU Core CPI indicator above just confirms this. Besides, for banks, earning opportunities are falling — which was demonstrated by the US financial elite in the recently organized crisis. In general, on the background of the inflation fight, the economy is starting to fall, which we see in numbers, but the problem is banks that have received significant amounts of money over the past three weeks will not help here. Since they do not want to make investments (the risks are too great), and speculation will not help the economy, only inflation will jump, already the monetary component. Moreover, citizens, as we have already noted, withdraw deposits and invest money in speculative instruments:
And in such a situation, banks are forced to reconsider their ability to invest "for a long time" relying on the deposits of citizens: the risks here begin to grow seriously. Accordingly, the US economy is starting to sink … Where? Take a look at production, unemployment and consumption as in US, EU and other countries:
The last update from Fed confirms our view. Take a look:
- The outflow of deposits was even greater than reported. In just 2 weeks before March 22, $300 billion was withdrawn + about $70 billion in the previous week, according to inflows to money market funds. Consumer loans rose by only $4 billion.
- Commercial and industrial lending fell by nearly $30 billion (production and manufacturing under-funding!). The $71 billion decline in total lending was the largest since June 2021.
- Corporate insiders sell shares while markets continue to rally:
- Stagflation stands at full capacity. PCE: real personal consumption in February (after a rebound) returned to the negative zone again. In March, there is a slowdown in consumer lending. Demand declined for both goods and services.
US Treasury has on the Fed's account only $163 billion, so they can last until June if there are no more bankruptcies. The FDIC is devastated, so all subsequent bankruptcies are solely at the expense of the printing and/or taxpayers through government spending, which inevitable push deficit higher. Thus, they are on the edge. The debt limit will be raised in June, and they will have to borrow actively soon, but difficulties may arise there.
Same story in EU. The fact that Core CPI is growing is normal. It is always about half a year late: the increase in food and fuel is transferred to other goods and services. By summer, the regular CPI will start to overtake again.
") , or some basket, including CHF, AUD, maybe some others that have good national fundamentals.
, or some basket, including CHF, AUD, maybe some others that have good national fundamentals.