Sive Morten
Special Consultant to the FPA
- Messages
- 18,695
Fundamentals
Reuters reports euro slumped for a fifth straight session against the U.S. dollar on Friday to a 3-1/2 week low as falling European interest rates drove investors into greenbacks and the yen.
"You can look at euro/yen, clearly breaking lower. The big picture globally is negative yields in the euro zone and long yields trading at incredibly low yields, substantially lower than Japanese yields," said Jens Nordvig, global head of currency strategy at Nomura in New York.
"That is triggering this persistent (fixed-income) asset allocation shift out of euro zone," he said.
At its low, the euro was off 1.28 percent to 127.22 yen, its weakest point in four weeks before recouping ground to trade at 127.43 yen, down 0.86 percent. For the week the euro fell 2.35 percent against the yen.
Nordvig notes how euro zone yields have flipped versus those of Japan. Whereas a year ago German 30-year yields were 75 basis points above equivalent Japanese yields, now they are exactly the opposite.
European Central Bank measures to loosen monetary policy via a program of bond buying contrasts against the U.S. Federal Reserve's trajectory for tightening policy after ending its own massive stimulus plan which is credited with helping boost economic growth
One spot of weakness for the dollar, marring its general push higher, is against the yen. It lost 0.33 percent to 120.18 yen.
Sterling hit a near five-year low of $1.4585 before easing back to $1.4637, still off 0.51 percent on the day and 1.89 percent for the week.
Markets are focused on Britain's May 7 elections which are set to generate a potentially destabilizing period of negotiations to form a government.
The cost of hedging against volatile moves in the pound around the vote has risen steadily since the start of the year and finally begun to show up in spot rates of sterling as well.
"A $1.40 level for sterling/dollar is certainly not out of reach if the election aftermath turns ugly," said Standard Bank currency strategist Steve Barrow in London.
Today guys, we will talk on CAD. Our view on EUR and GBP does not need any update, since we’ve discussed major points of our plan on previous week. But on CAD we see very interesting action.
CFTC data shows that after solid drop of Open Interest couple of weeks ago due massive closing of short positions, numbers are little change. Major reasons for running out from shorts were probably Yemen turmoil and Saudi Arabia price increase for Asian countries. At the same time CFTC data shows that Shorts are still almost 3 times greater than longs and longs were not increased on those news where shorts were closed. It means that investors do not want to hold aggressive bearish position any more, but they do not see perspective of CAD strengthening yet either.
As you will see later on technical part of research – this institutional investors’ position could become decisive for short-term perspective.
Open interest:
 Shorts:
 Longs:

We know that CAD is “oil” currency and has strong correlation with Crude Oil. Thus, as on CAD as on Crude Oil recently was formed the same pattern – DRPO. Now we need understand the perspective of this pattern. At the same time we can trade as DRPO as DRPO “Failure” and existence of direct pattern already creates context for trading despite what direction will happen finally.
Technicals
Monthly
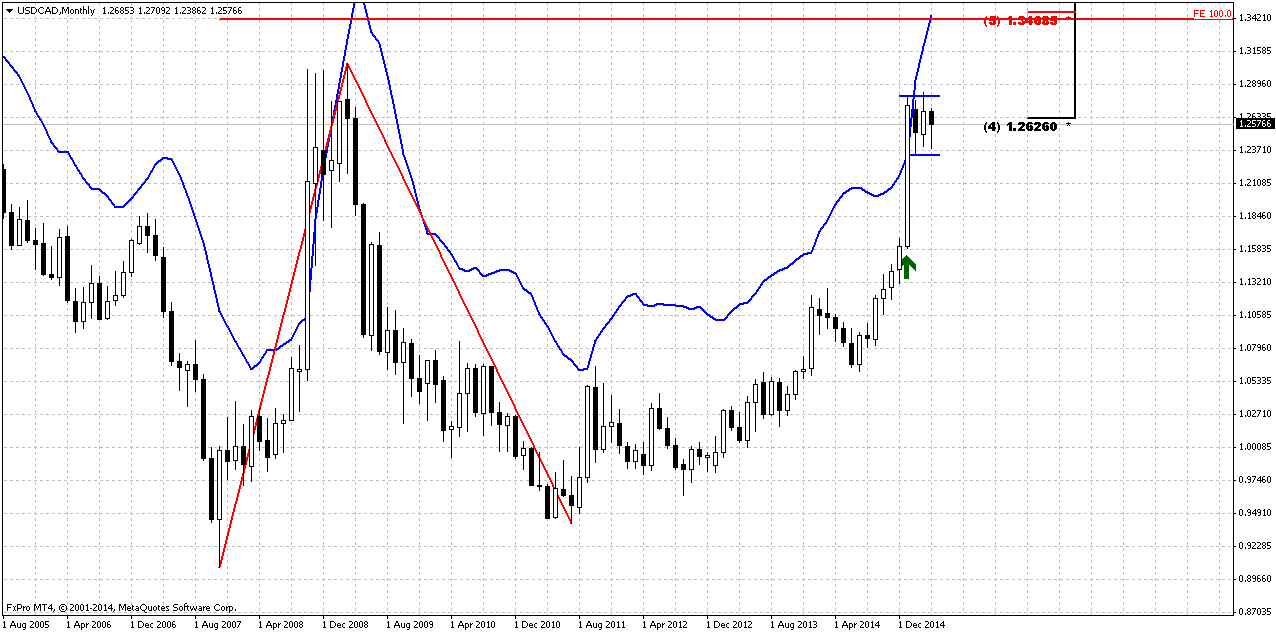
Trend is bullish here. We do not have any yearly pivots here because CAD has passed through all of them, even YPR2 at 1.23 area. Still, monthly chart shows very tricky combination. We have big AB-CD pattern in progress that already has passed above 0.618 target and has major destination point at 1.3420 that creates Agreement with major Fib resistance.
The question is, whether market will continue higher or turn down right from here, since bearish positions on CAD were contracted significantly?
As market right now stands at 50% Fib level and has reached monthly overbought – this creates Stretch pattern and CAD almost whole month stands in tight range. All these moments lead us to conclusion that upward action probably should continue. Here are our arguments:
- Market has not reached major AB=CD target and odds suggest that market never shows reliable bearish reversal until this target will not be hit;
- We see acceleration candle that increase chances on upside continuation. It seems that market has stopped mostly due overbought and Fib resistance;
- Market stands very tight right under resistance and forms the shape of bullish flag.
All these moments point on doubts of possible downward reversal, especially taking into consideration CFTC data.
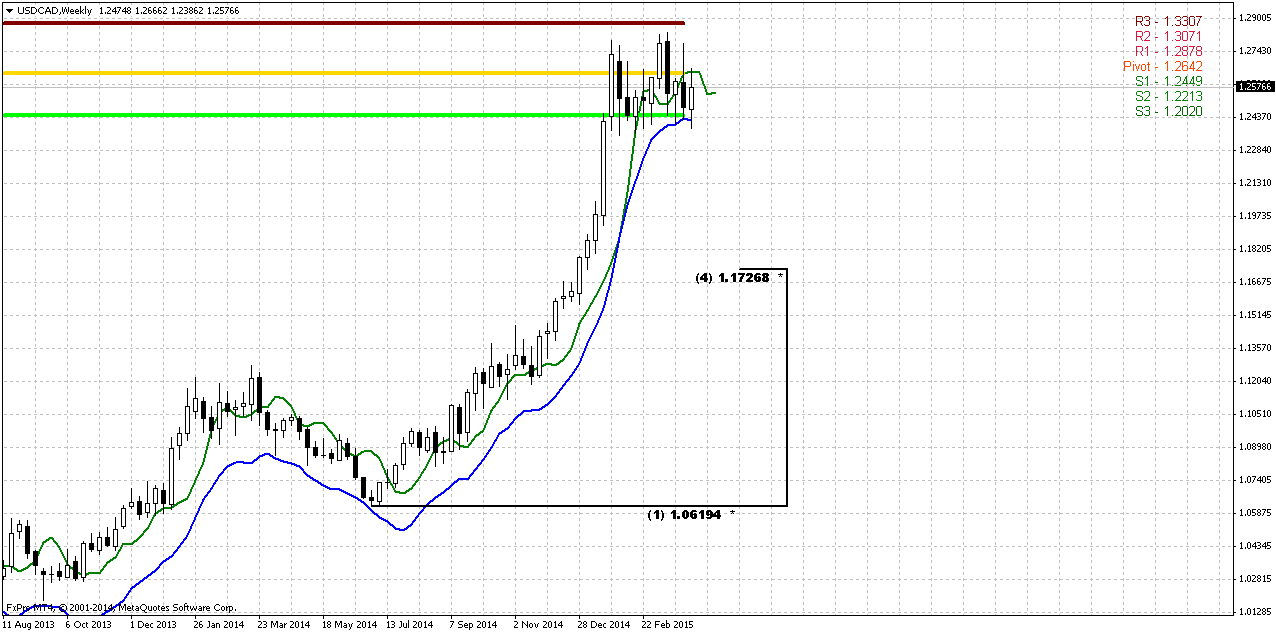
Weekly
Here guys, we come to major chart. Right at 50% Fib resistance and monthly overbought CAD has formed perfect DRPO “Sell”. The shape of the pattern is really nice. Second top of DRPO is slightly higher than the first one, i.e. W&R of the first top, consolidation between tops is small, thrust is perfect and market has not shown 3/8 retracement, so steam is still in the pot. Market confirmed DRPO on two weeks ago and recent week shows retracement up, but it was held by 3x3 DMA. Currently we see flawless construction. Also you can see that market just can’t move lower since it stands at weekly oversold and MPS1.
If this DRPO will work – its potential target stands at 50% support of whole trust @ 1.1730 area. Could it work? Theoretically yes, since we still have bearish Stretch at monthly chart and retracement mostly was held by weekly oversold. Could it fail? Also yes, because monthly signs mostly points on upward continuation. So, how we could trade it? Here guys could be different approach. Weekly chart has rather big scale and not everybody could trade it directly. Imagine whole process of trading direct DRPO first and DRPO Failure second. Although result will be positive, the temporal loss that trader could get will be significant. It means that you can either significantly reduce trading volume, to 0.1 or even 0.05 lot to make acceptable possible losses. Or, trade some daily or intraday setups in the direction of DRPO pattern that let to place tighter stops.
Following first way – actually we have to take short position with stop somewhere around 1.28-1.2830 and wait. If DRPO will shift to “Failure” – reverse position with target @ monthly AB=CD 1.34
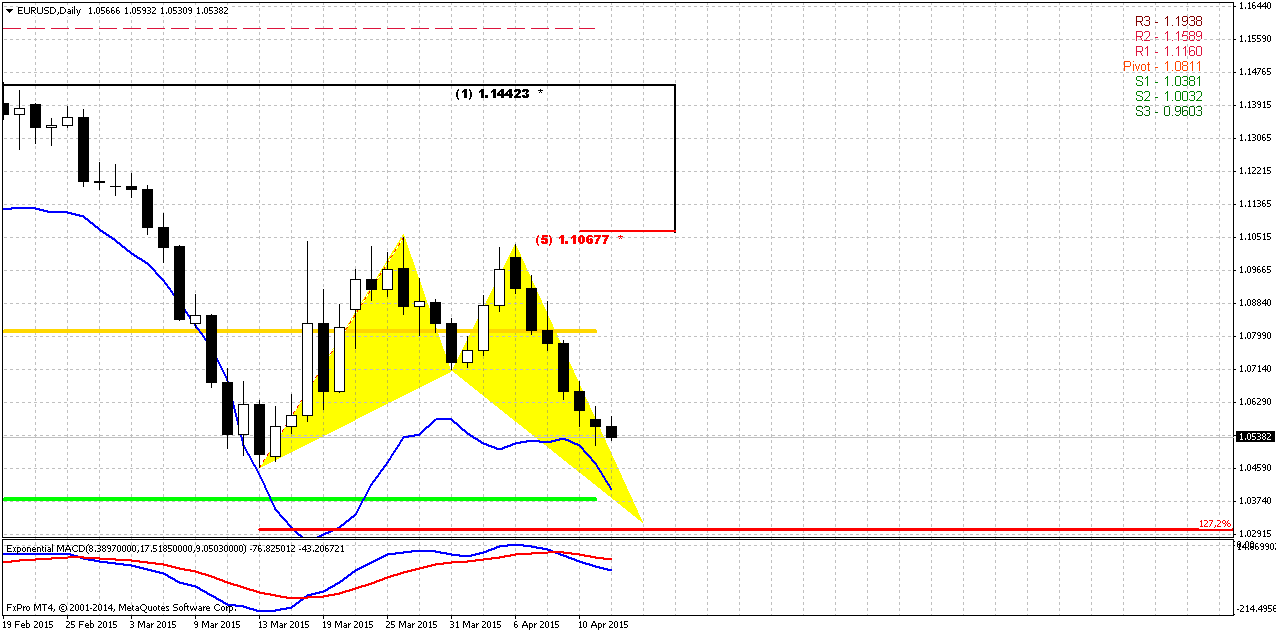
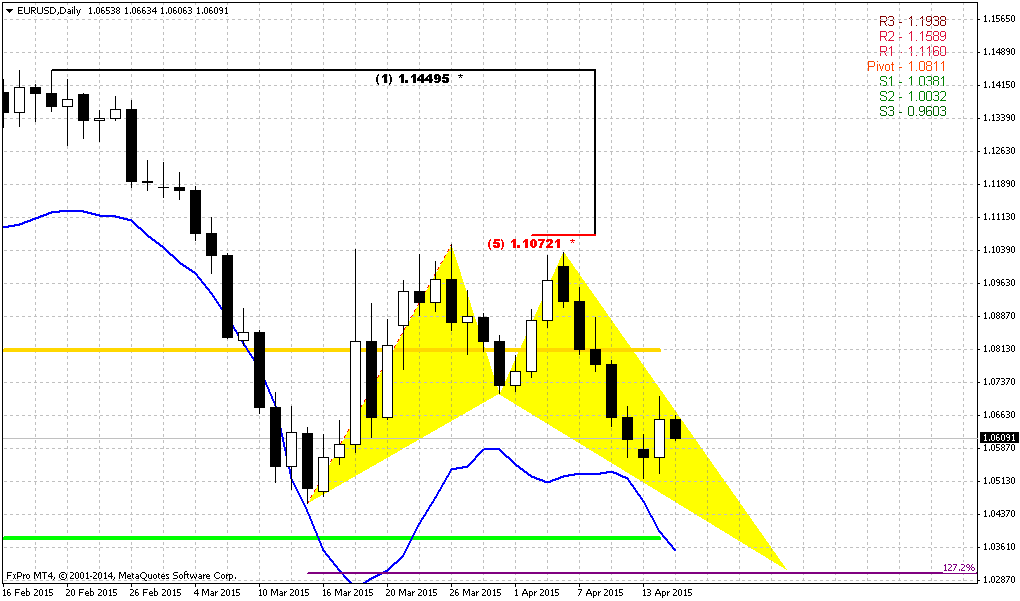
Daily
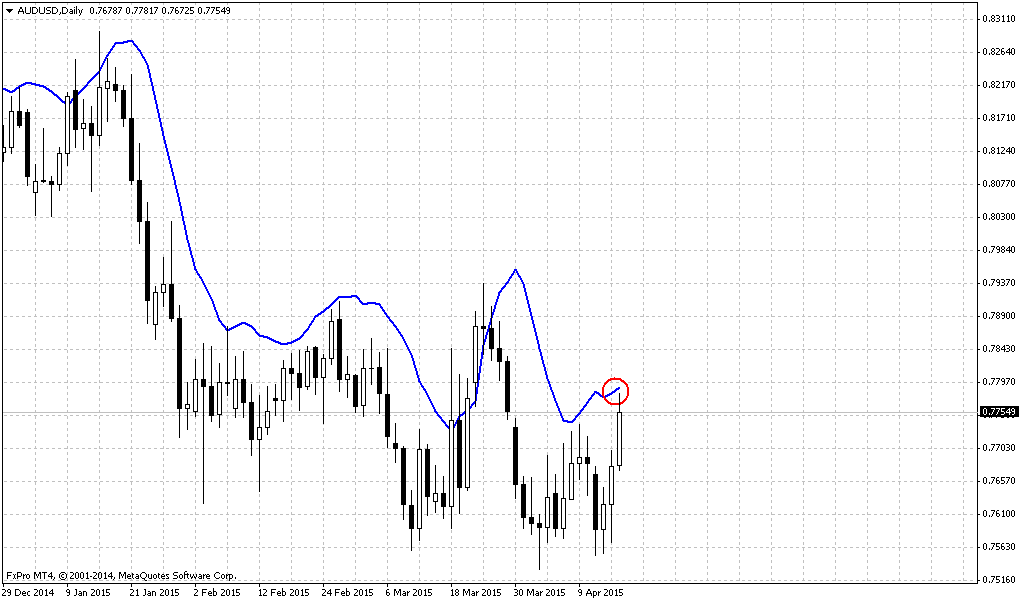
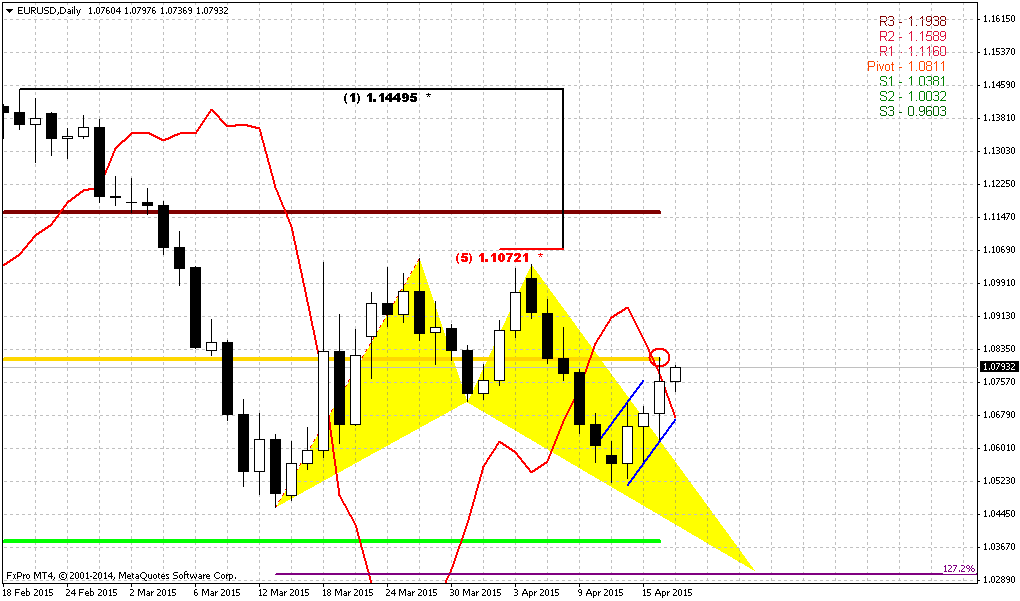
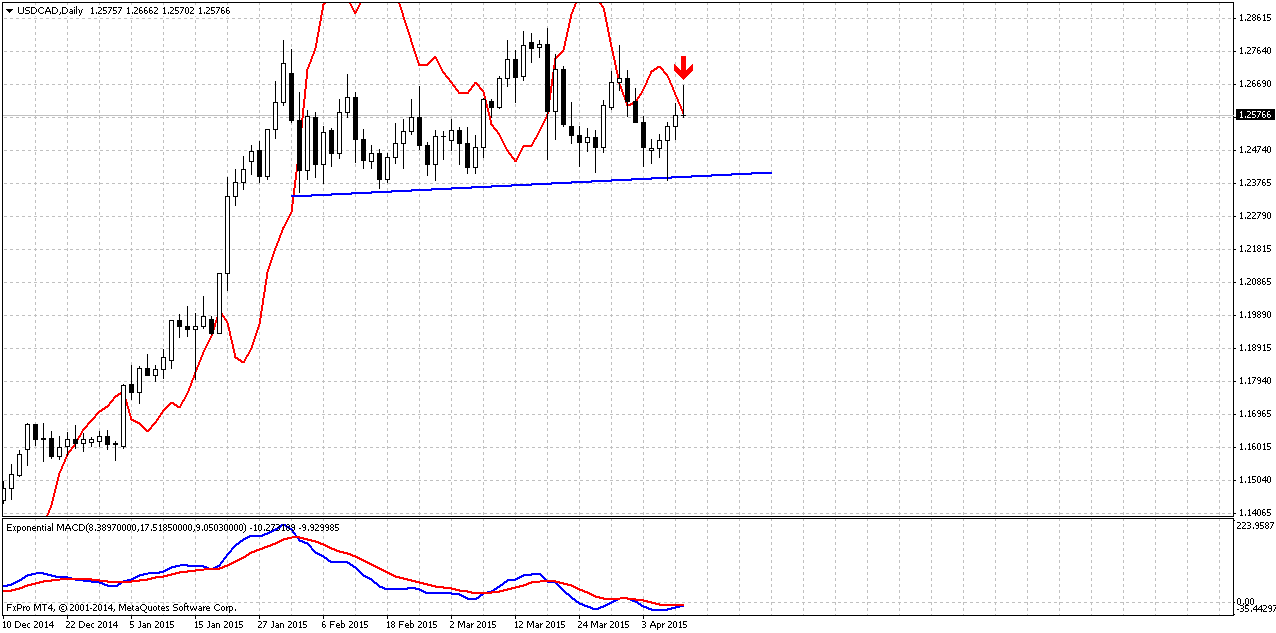
Now let’s see what we have on daily chart. To be honest, guys, I would search chance for long entry here. DRPO has been confirmed, but no thrusting action has followed. Usually DRPO “Sell” is capitulation of bears and capitulation usually ends with fast thrusting action, in our case to the downside. But here we do not see it. At first glance market has formed bearish divergence with MACD, but we see here not bearish pattern but bullish dynamic pressure. Trend mostly has turned bearish, but market is forming higher lows.
Theoretically we know that we have DRPO and it was confirmed and so on. But, guys, price action looks suspicious. Here we need to make complex decision and find a compromise for opposite patterns. Thus, DRPO forces us to take short immediately, especially because we also have bearish grabber at daily chart. At the same time market does not show action typical for DRPO and puts the shadow on perspective of this pattern. Finally DRPO “Failure” has not been formed yet and it seems that it is not the time yet to take short position.
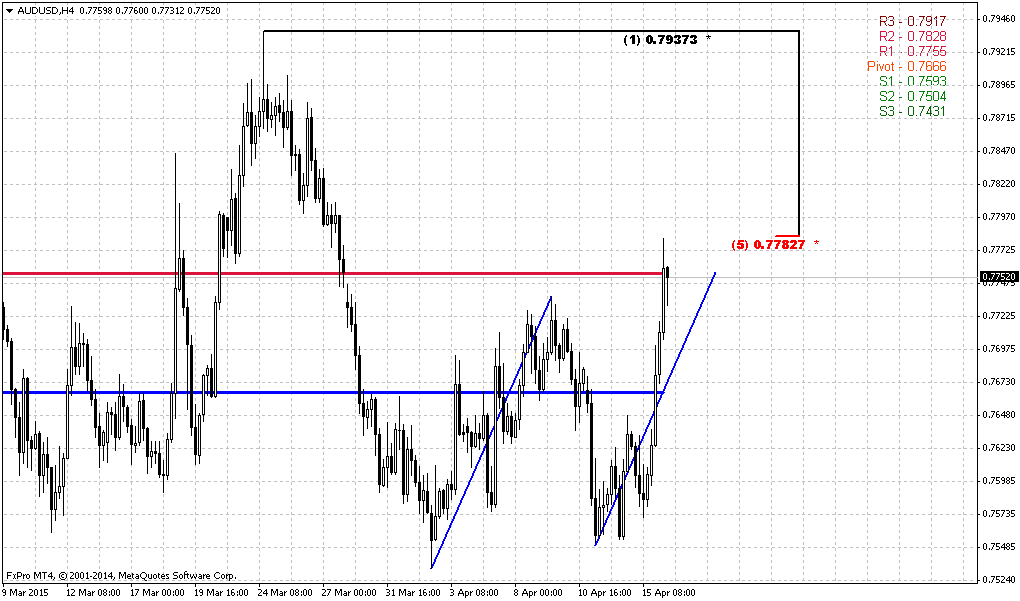
Taking in consideration our doubts on current situation we could wait for some action that will increase our confidence in upward continuation or downward. Thus, to get confidence with bearish scenario, we probably need to wait for downward breakout of support line and wait for failure of bullish dynamic pressure. Theoretically bearish position could be taken even now, based on stop grabber, but in this case you have to be ready for risk of reversal up again from trend line. This will demand more diligence in managing of stops and position.
If you would like to make bet on DRPO Failure here is also couple of solutions. First one is to take position as close as possible to 1.2380 area that is trend line, oversold and MPS1. If market will be bullish, it probably will hold this area and use it as foundation for upside action. Second is – wait for DRPO “Failure” confirmation, when market will move above 1.2830 area and then take long position.
So, major concern right now in current consolidation, since it has as bullish as bearish signs…
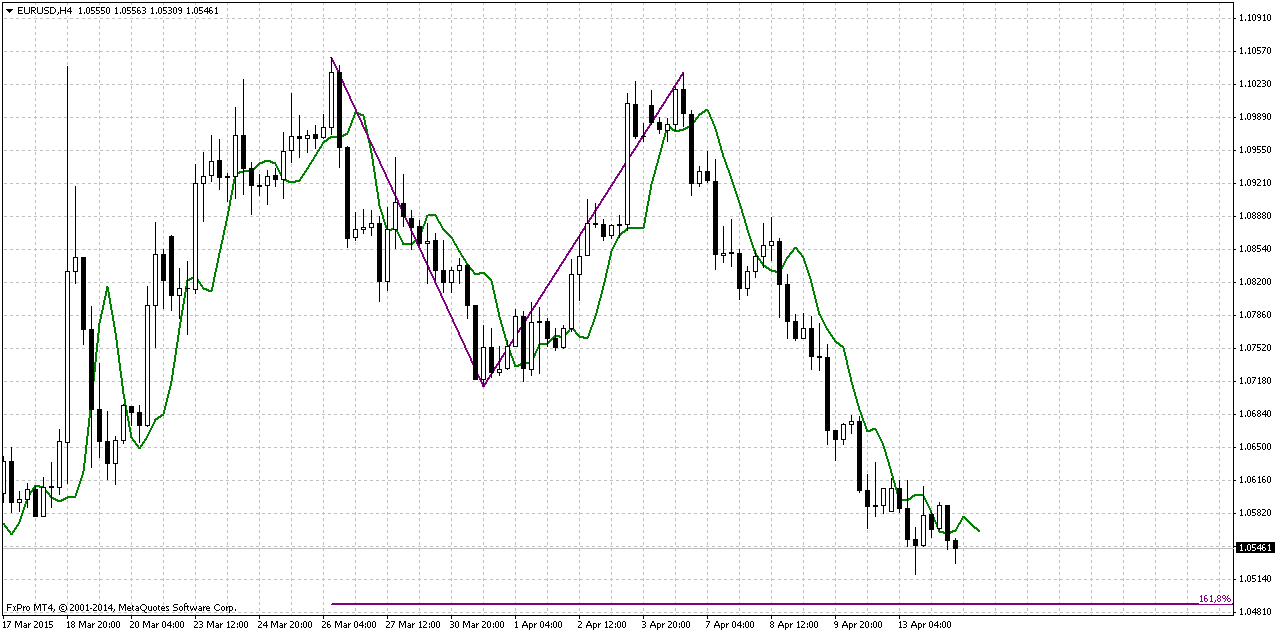
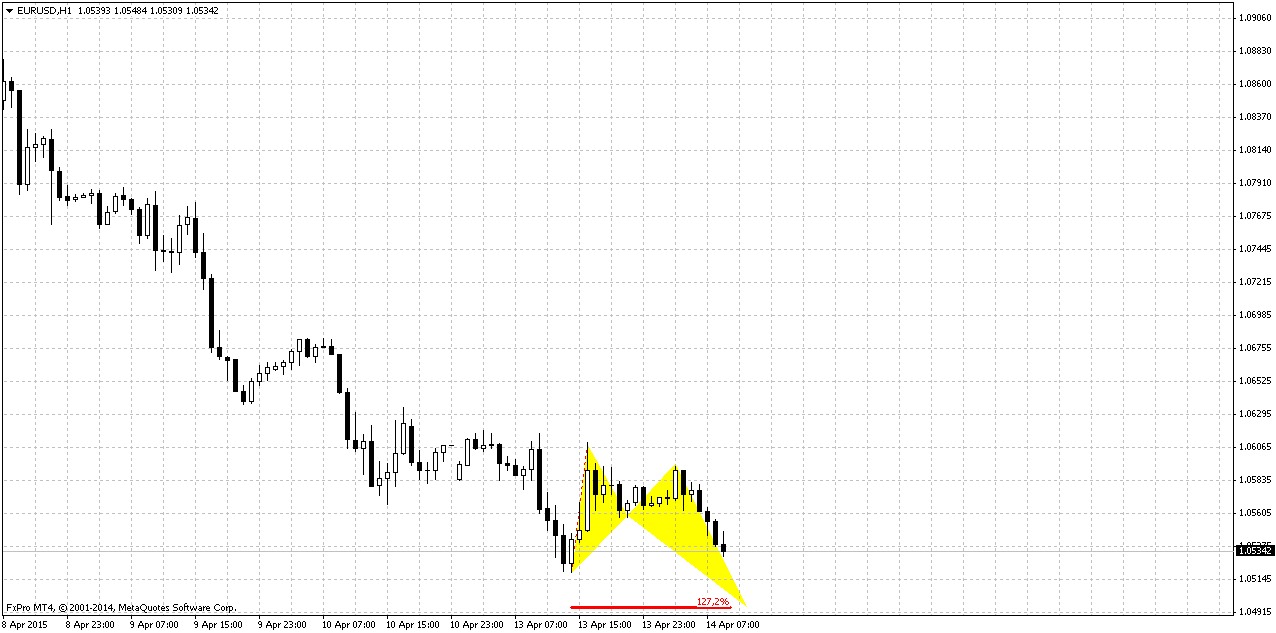
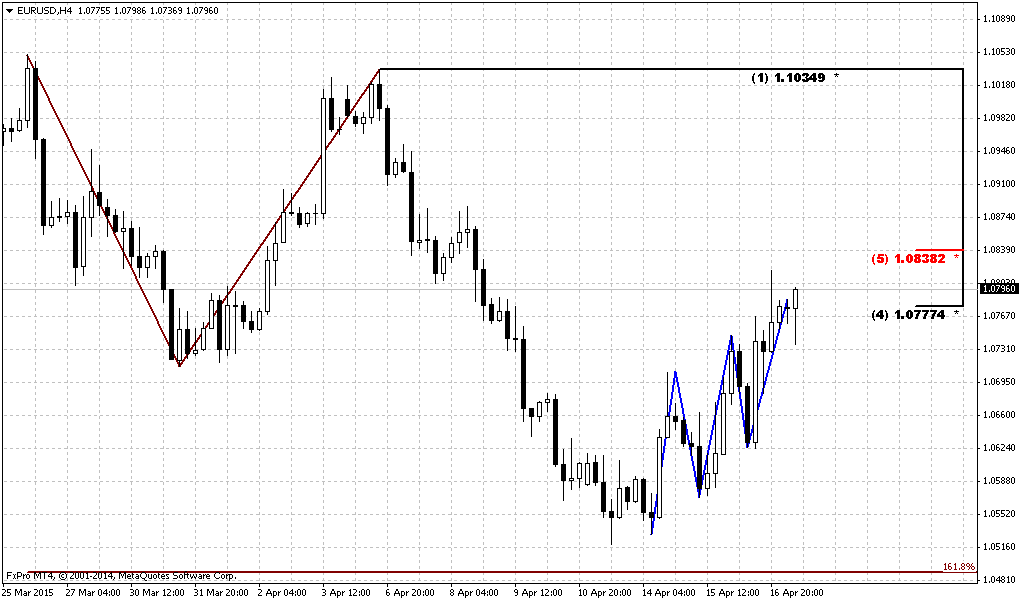
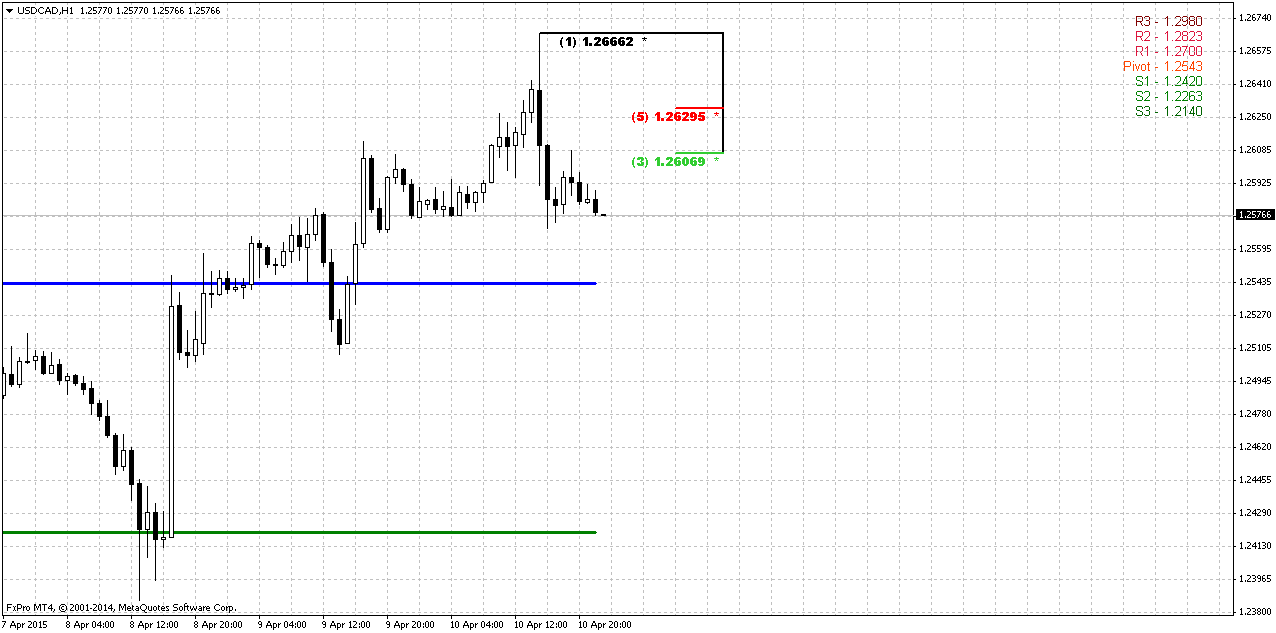
1-Hour
On intraday charts we do not see something really valuable. One thing that could be done probably is to trade daily grabber. Thus we could use some resistance of grabber’s swing to take short position. Invalidation point will be above the top @ 1.2670 while target potential is solid – right at 1.23 lows.
Conclusion:
Although CAD has formed clear bearish pattern the perspective of downward reversal now still looks suspicious. Thus, we need to get more confidence to surely tell on one or other direction and monitor signs that we’ve mentioned in research.
The technical portion of Sive's analysis owes a great deal to Joe DiNapoli's methods, and uses a number of Joe's proprietary indicators. Please note that Sive's analysis is his own view of the market and is not endorsed by Joe DiNapoli or any related companies.
Reuters reports euro slumped for a fifth straight session against the U.S. dollar on Friday to a 3-1/2 week low as falling European interest rates drove investors into greenbacks and the yen.
"You can look at euro/yen, clearly breaking lower. The big picture globally is negative yields in the euro zone and long yields trading at incredibly low yields, substantially lower than Japanese yields," said Jens Nordvig, global head of currency strategy at Nomura in New York.
"That is triggering this persistent (fixed-income) asset allocation shift out of euro zone," he said.
At its low, the euro was off 1.28 percent to 127.22 yen, its weakest point in four weeks before recouping ground to trade at 127.43 yen, down 0.86 percent. For the week the euro fell 2.35 percent against the yen.
Nordvig notes how euro zone yields have flipped versus those of Japan. Whereas a year ago German 30-year yields were 75 basis points above equivalent Japanese yields, now they are exactly the opposite.
European Central Bank measures to loosen monetary policy via a program of bond buying contrasts against the U.S. Federal Reserve's trajectory for tightening policy after ending its own massive stimulus plan which is credited with helping boost economic growth
One spot of weakness for the dollar, marring its general push higher, is against the yen. It lost 0.33 percent to 120.18 yen.
Sterling hit a near five-year low of $1.4585 before easing back to $1.4637, still off 0.51 percent on the day and 1.89 percent for the week.
Markets are focused on Britain's May 7 elections which are set to generate a potentially destabilizing period of negotiations to form a government.
The cost of hedging against volatile moves in the pound around the vote has risen steadily since the start of the year and finally begun to show up in spot rates of sterling as well.
"A $1.40 level for sterling/dollar is certainly not out of reach if the election aftermath turns ugly," said Standard Bank currency strategist Steve Barrow in London.
Today guys, we will talk on CAD. Our view on EUR and GBP does not need any update, since we’ve discussed major points of our plan on previous week. But on CAD we see very interesting action.
CFTC data shows that after solid drop of Open Interest couple of weeks ago due massive closing of short positions, numbers are little change. Major reasons for running out from shorts were probably Yemen turmoil and Saudi Arabia price increase for Asian countries. At the same time CFTC data shows that Shorts are still almost 3 times greater than longs and longs were not increased on those news where shorts were closed. It means that investors do not want to hold aggressive bearish position any more, but they do not see perspective of CAD strengthening yet either.
As you will see later on technical part of research – this institutional investors’ position could become decisive for short-term perspective.
Open interest:
We know that CAD is “oil” currency and has strong correlation with Crude Oil. Thus, as on CAD as on Crude Oil recently was formed the same pattern – DRPO. Now we need understand the perspective of this pattern. At the same time we can trade as DRPO as DRPO “Failure” and existence of direct pattern already creates context for trading despite what direction will happen finally.
Technicals
Monthly
Trend is bullish here. We do not have any yearly pivots here because CAD has passed through all of them, even YPR2 at 1.23 area. Still, monthly chart shows very tricky combination. We have big AB-CD pattern in progress that already has passed above 0.618 target and has major destination point at 1.3420 that creates Agreement with major Fib resistance.
The question is, whether market will continue higher or turn down right from here, since bearish positions on CAD were contracted significantly?
As market right now stands at 50% Fib level and has reached monthly overbought – this creates Stretch pattern and CAD almost whole month stands in tight range. All these moments lead us to conclusion that upward action probably should continue. Here are our arguments:
- Market has not reached major AB=CD target and odds suggest that market never shows reliable bearish reversal until this target will not be hit;
- We see acceleration candle that increase chances on upside continuation. It seems that market has stopped mostly due overbought and Fib resistance;
- Market stands very tight right under resistance and forms the shape of bullish flag.
All these moments point on doubts of possible downward reversal, especially taking into consideration CFTC data.
Weekly
Here guys, we come to major chart. Right at 50% Fib resistance and monthly overbought CAD has formed perfect DRPO “Sell”. The shape of the pattern is really nice. Second top of DRPO is slightly higher than the first one, i.e. W&R of the first top, consolidation between tops is small, thrust is perfect and market has not shown 3/8 retracement, so steam is still in the pot. Market confirmed DRPO on two weeks ago and recent week shows retracement up, but it was held by 3x3 DMA. Currently we see flawless construction. Also you can see that market just can’t move lower since it stands at weekly oversold and MPS1.
If this DRPO will work – its potential target stands at 50% support of whole trust @ 1.1730 area. Could it work? Theoretically yes, since we still have bearish Stretch at monthly chart and retracement mostly was held by weekly oversold. Could it fail? Also yes, because monthly signs mostly points on upward continuation. So, how we could trade it? Here guys could be different approach. Weekly chart has rather big scale and not everybody could trade it directly. Imagine whole process of trading direct DRPO first and DRPO Failure second. Although result will be positive, the temporal loss that trader could get will be significant. It means that you can either significantly reduce trading volume, to 0.1 or even 0.05 lot to make acceptable possible losses. Or, trade some daily or intraday setups in the direction of DRPO pattern that let to place tighter stops.
Following first way – actually we have to take short position with stop somewhere around 1.28-1.2830 and wait. If DRPO will shift to “Failure” – reverse position with target @ monthly AB=CD 1.34
Daily
Now let’s see what we have on daily chart. To be honest, guys, I would search chance for long entry here. DRPO has been confirmed, but no thrusting action has followed. Usually DRPO “Sell” is capitulation of bears and capitulation usually ends with fast thrusting action, in our case to the downside. But here we do not see it. At first glance market has formed bearish divergence with MACD, but we see here not bearish pattern but bullish dynamic pressure. Trend mostly has turned bearish, but market is forming higher lows.
Theoretically we know that we have DRPO and it was confirmed and so on. But, guys, price action looks suspicious. Here we need to make complex decision and find a compromise for opposite patterns. Thus, DRPO forces us to take short immediately, especially because we also have bearish grabber at daily chart. At the same time market does not show action typical for DRPO and puts the shadow on perspective of this pattern. Finally DRPO “Failure” has not been formed yet and it seems that it is not the time yet to take short position.
Taking in consideration our doubts on current situation we could wait for some action that will increase our confidence in upward continuation or downward. Thus, to get confidence with bearish scenario, we probably need to wait for downward breakout of support line and wait for failure of bullish dynamic pressure. Theoretically bearish position could be taken even now, based on stop grabber, but in this case you have to be ready for risk of reversal up again from trend line. This will demand more diligence in managing of stops and position.
If you would like to make bet on DRPO Failure here is also couple of solutions. First one is to take position as close as possible to 1.2380 area that is trend line, oversold and MPS1. If market will be bullish, it probably will hold this area and use it as foundation for upside action. Second is – wait for DRPO “Failure” confirmation, when market will move above 1.2830 area and then take long position.
So, major concern right now in current consolidation, since it has as bullish as bearish signs…
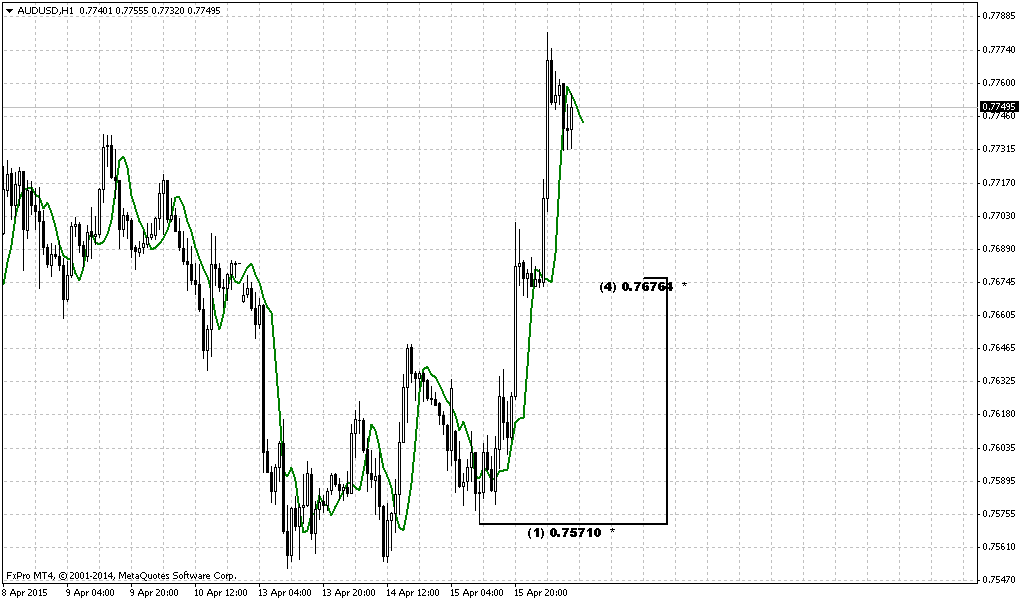
1-Hour
On intraday charts we do not see something really valuable. One thing that could be done probably is to trade daily grabber. Thus we could use some resistance of grabber’s swing to take short position. Invalidation point will be above the top @ 1.2670 while target potential is solid – right at 1.23 lows.
Conclusion:
Although CAD has formed clear bearish pattern the perspective of downward reversal now still looks suspicious. Thus, we need to get more confidence to surely tell on one or other direction and monitor signs that we’ve mentioned in research.
The technical portion of Sive's analysis owes a great deal to Joe DiNapoli's methods, and uses a number of Joe's proprietary indicators. Please note that Sive's analysis is his own view of the market and is not endorsed by Joe DiNapoli or any related companies.