Sive Morten
Special Consultant to the FPA
- Messages
- 18,673
Monthly
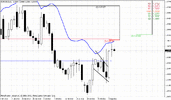
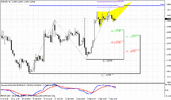
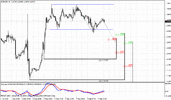
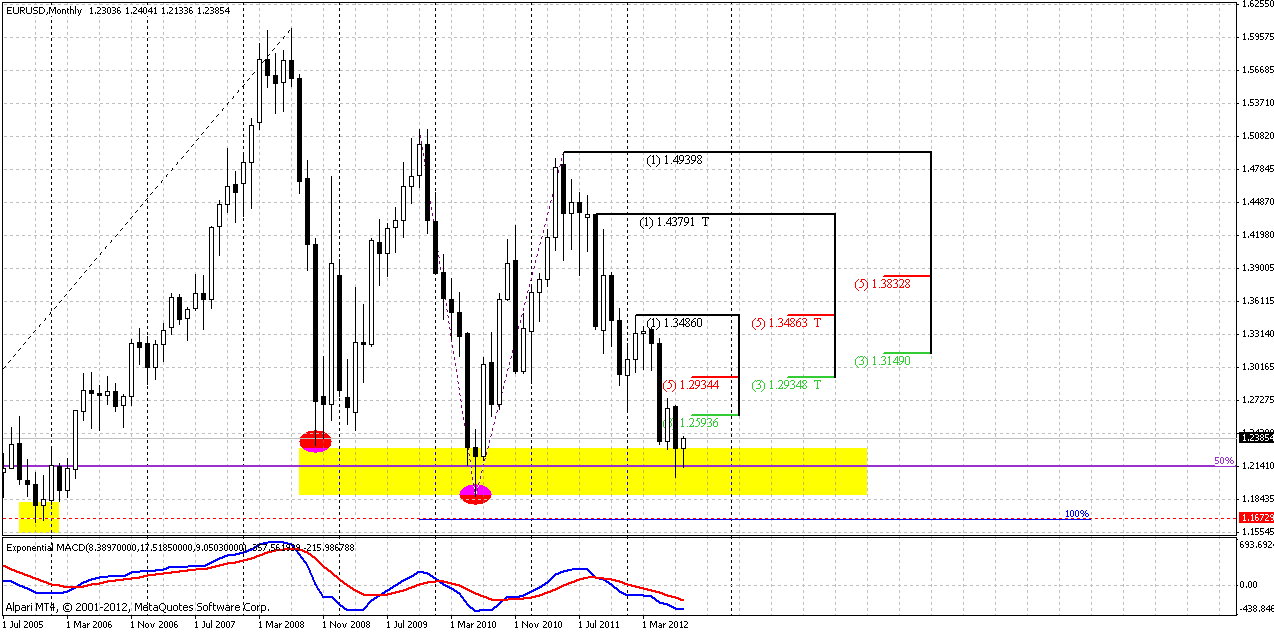
Monthly trend holds bearish. Price continues to force significant support area 1.19-1.23 that held EUR twice from collapse – first time in 2008 when sub-prime crisis has started and second – in 2010 at beginning of Greece turmoil.
August has started, but currently this candle is inside month for July and does not add much to previous analysis. So, technically situation has not changed. Minimum target still is 1.16-1.17 area, based on analysis of quarterly chart of Dollar Index that we’ve made in Nov 2011. Index has 95% correlation with EUR/USD. Also this is AB=CD target of most recent pattern on current chart. Also take a look – this is significant support of 2005 as well – marked by yellow rectangle.
Nearest Fib resistance is 1.2593, stronger area is monthly K-resistance 1.2934. In short-term perspective some bounce to 1.25-1.26 area looks possible. Last two candles have longer shadows, so it shows that support still presents here, despite solid piercing of this area in 2010.
In longer-term market is entering into very, say, “dangerous” area, and it comes to it not at oversold as it was two times previously. If it will break it – this will be the road to 1.07-1.10 area or ultimately even to parity.
Weekly
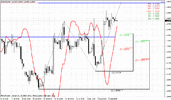
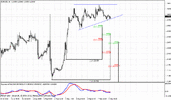
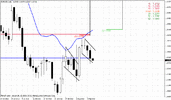
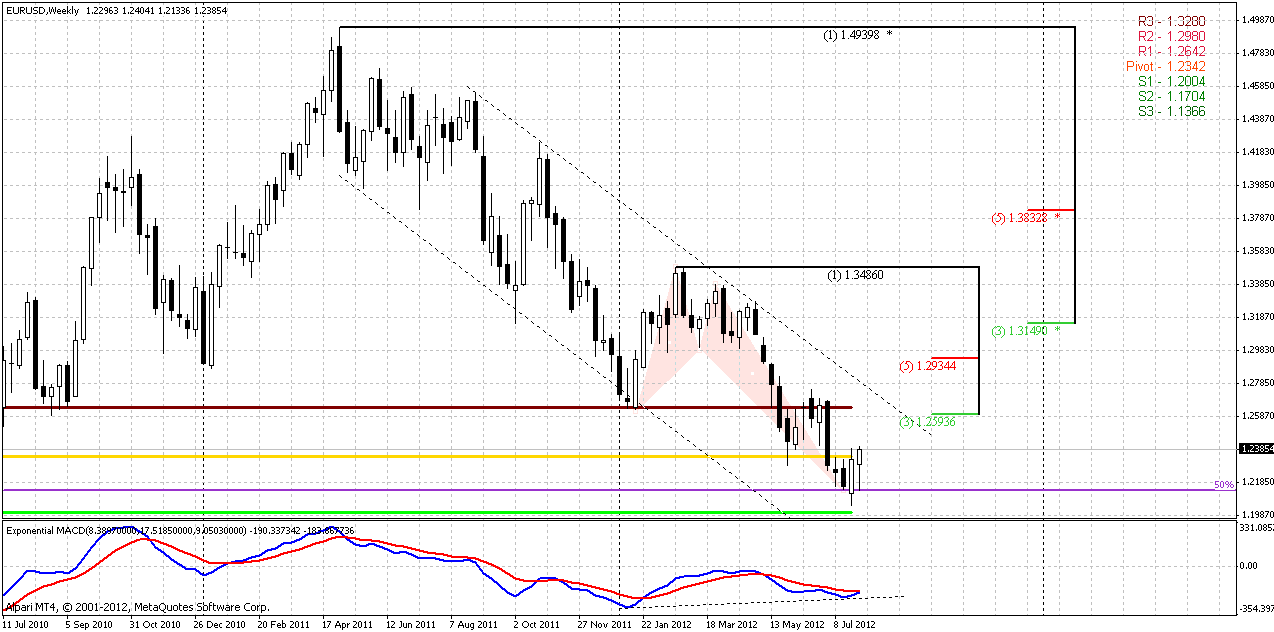
Bearish trend still holds on weekly chart, but price stands very close to its breakeven point. Here I would like to discuss couple of moments that we haven’t touched in previous researches. First of all – take a look at overall price move inside downward parallel channel. During previous bottoms, when price touched low border of the channel there were no divergences. Also we do not see any reversal patterns, when these bottoms were reached. Second moment is – market did not start move to upper border prior of reaching lower one first.
Now take a look at current price action – we have all these signs that weren’t here previously. We have divergence, although it is not quite completed yet, we have butterfly “buy” pattern at long-term 50% monthly support and we see that market is showing attempt to do upward retracement before reaching of lower border of the channel. What conclusion could be made from all this stuff?
Well, one part of puzzle is still absent, I think. I’m speaking about depth of current retracement. If you will take a close look at weekly chart, you’ll see that appearing some kind of bullish wedge or 3-Drive pattern is still possible. By completing of this pattern, market precisely will reach lower border and will continue movement inside of channel. But for that purpose current retracement should stop around 1.2550 area. If this will not happen, then all factors that we just have specified will come in play, and retracement could be deeper.
Currently price stands above monthly pivot point. Take a look that MPR1=1.2642 stands very close to nearest Fib resistance. So, as we know, when market shows retracement at long-term bear trend, it retraces to MPR1.
Daily
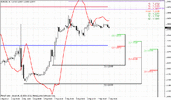
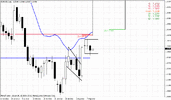
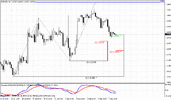
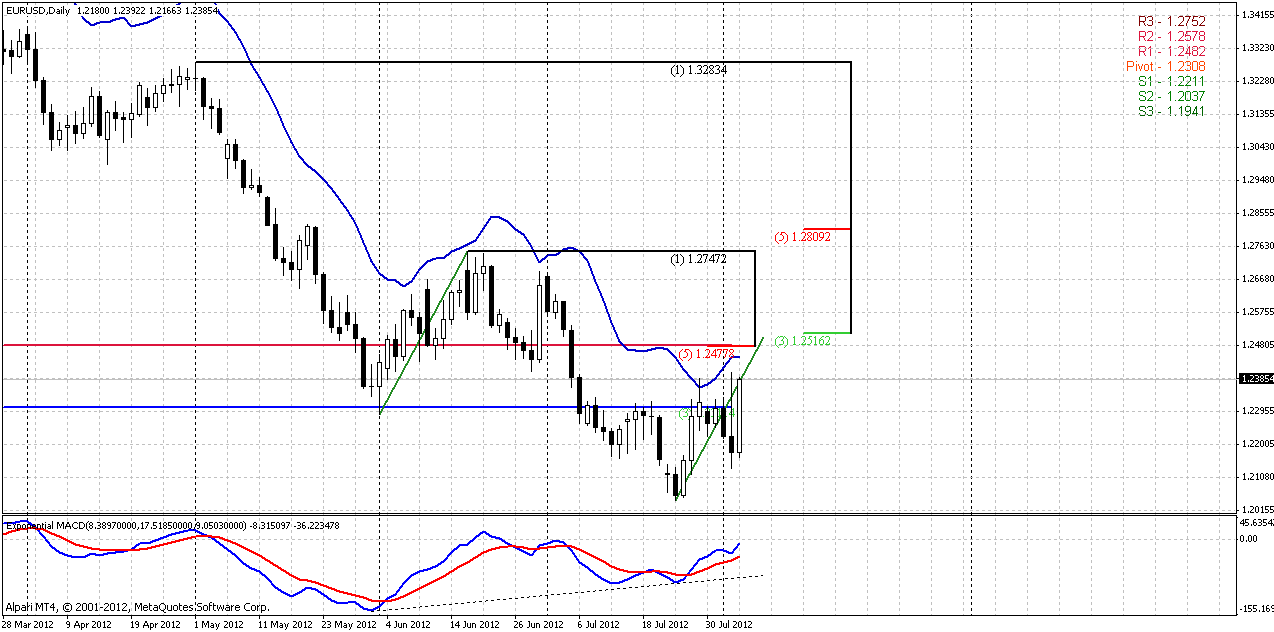
On daily chart price has shown action that was assumed and discussed within the week – deep retracement after potentially bullish swing and upward continuation with breakout of bullish flag pattern. Although ECB speech has added some nervous by spike on Thursday, later price action absolutely didn’t take it into consideration and behaves as it was not here.
So, bullish context still holds, next target, as you can clearly see from the chart is 1.25 area, that is daily K-resistance and overbought. Also, take a look – I’ve cloned previous retracement up and counted and drag it to current move up. It points at the same area. If weekly harmonic pattern still has some chances to appear – upward move should finish somewhere around 1.25-1.2550 area. Also this area agrees with WPR1 of current week and upward AB=CD pattern, although it lost its nice shape due the same spike on Thursday.
60-min
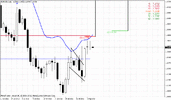
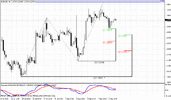
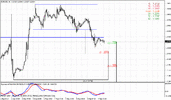
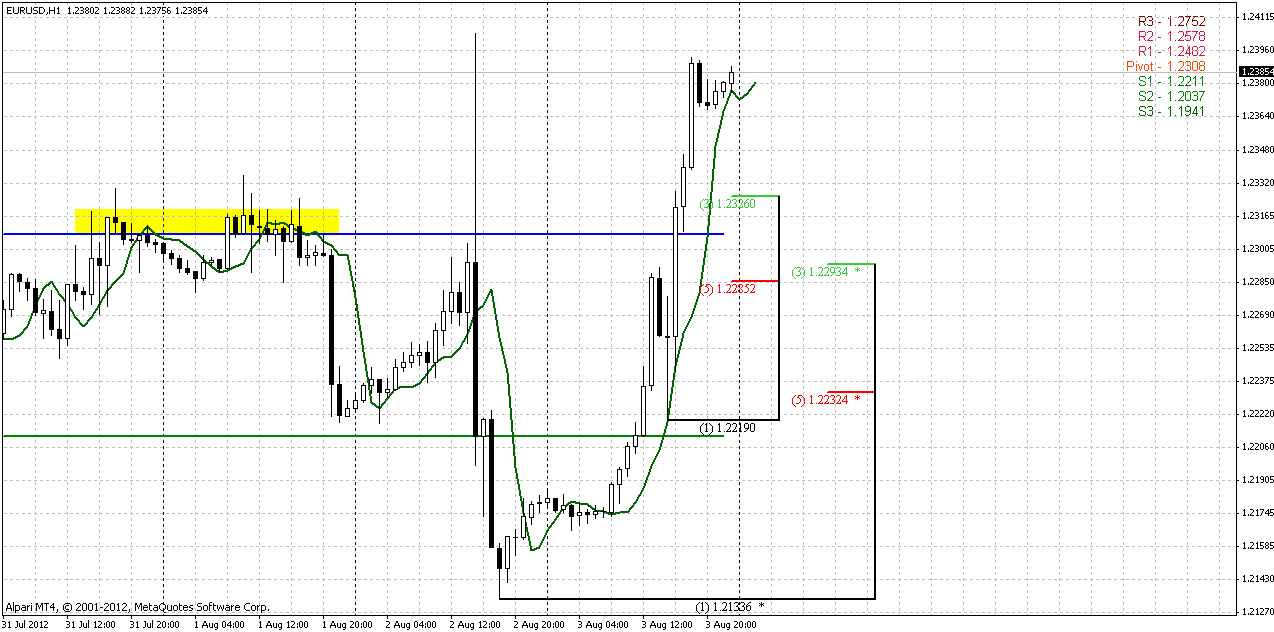
Trend is bullish. We will use this chart to come on board, if you haven’t entered at 1.2175 as we’ve discussed. Since daily chart is not at overboght and, actually not at any resistance, it is better to use nearest Fib support to enter long – that is 1.2326. 3x3 DMA suggests that it might be B&B “Buy” pattern or DRPO “Sell”. In case of B&B, market probably will reached 1.2326 and may be test WPP, while DRPO suggests deeper retracement, probably to K-support around 1.2285-1.2295 area. That is also aproximately a former upper border of daily flag. For stop placement there are two areas – below K-support area or below 1.2211-1.2230 – 0.618 support and WPS1. Logically, first level is more suitable, since if market will break K-support, it will return back inside of flag. That will be enough to negate bullish perspective. Second area is a bit conservative, but it will protect you from possible spikes around K-support. May be it makes sense place stop there, and when market will reestablish upward move – move stop to breakeven or below K-support.
Conclusion:
Long-term bearish sentiment still in play, but as current upward bounce was rather fast, market has some upward momentum that makes possible move to 1.25-1.26 area. At least currently I see nothing on charts that could make it impossible. In medium-term perspective, situation will depend on whether price stop at this area or proceed higher.
In short-term perspective we have bullish context that should lead market to 1.25. Nice area for long entry is 1.2326, next is 1.2285-1.2295. If market will return right back below it – do not enter long, since this is not quite logical from bullish perspective.
The technical portion of Sive's analysis owes a great deal to Joe DiNapoli's methods, and uses a number of Joe's proprietary indicators. Please note that Sive's analysis is his own view of the market and is not endorsed by Joe DiNapoli or any related companies.
Monthly trend holds bearish. Price continues to force significant support area 1.19-1.23 that held EUR twice from collapse – first time in 2008 when sub-prime crisis has started and second – in 2010 at beginning of Greece turmoil.
August has started, but currently this candle is inside month for July and does not add much to previous analysis. So, technically situation has not changed. Minimum target still is 1.16-1.17 area, based on analysis of quarterly chart of Dollar Index that we’ve made in Nov 2011. Index has 95% correlation with EUR/USD. Also this is AB=CD target of most recent pattern on current chart. Also take a look – this is significant support of 2005 as well – marked by yellow rectangle.
Nearest Fib resistance is 1.2593, stronger area is monthly K-resistance 1.2934. In short-term perspective some bounce to 1.25-1.26 area looks possible. Last two candles have longer shadows, so it shows that support still presents here, despite solid piercing of this area in 2010.
In longer-term market is entering into very, say, “dangerous” area, and it comes to it not at oversold as it was two times previously. If it will break it – this will be the road to 1.07-1.10 area or ultimately even to parity.

Weekly
Bearish trend still holds on weekly chart, but price stands very close to its breakeven point. Here I would like to discuss couple of moments that we haven’t touched in previous researches. First of all – take a look at overall price move inside downward parallel channel. During previous bottoms, when price touched low border of the channel there were no divergences. Also we do not see any reversal patterns, when these bottoms were reached. Second moment is – market did not start move to upper border prior of reaching lower one first.
Now take a look at current price action – we have all these signs that weren’t here previously. We have divergence, although it is not quite completed yet, we have butterfly “buy” pattern at long-term 50% monthly support and we see that market is showing attempt to do upward retracement before reaching of lower border of the channel. What conclusion could be made from all this stuff?
Well, one part of puzzle is still absent, I think. I’m speaking about depth of current retracement. If you will take a close look at weekly chart, you’ll see that appearing some kind of bullish wedge or 3-Drive pattern is still possible. By completing of this pattern, market precisely will reach lower border and will continue movement inside of channel. But for that purpose current retracement should stop around 1.2550 area. If this will not happen, then all factors that we just have specified will come in play, and retracement could be deeper.
Currently price stands above monthly pivot point. Take a look that MPR1=1.2642 stands very close to nearest Fib resistance. So, as we know, when market shows retracement at long-term bear trend, it retraces to MPR1.

Daily
On daily chart price has shown action that was assumed and discussed within the week – deep retracement after potentially bullish swing and upward continuation with breakout of bullish flag pattern. Although ECB speech has added some nervous by spike on Thursday, later price action absolutely didn’t take it into consideration and behaves as it was not here.
So, bullish context still holds, next target, as you can clearly see from the chart is 1.25 area, that is daily K-resistance and overbought. Also, take a look – I’ve cloned previous retracement up and counted and drag it to current move up. It points at the same area. If weekly harmonic pattern still has some chances to appear – upward move should finish somewhere around 1.25-1.2550 area. Also this area agrees with WPR1 of current week and upward AB=CD pattern, although it lost its nice shape due the same spike on Thursday.

60-min
Trend is bullish. We will use this chart to come on board, if you haven’t entered at 1.2175 as we’ve discussed. Since daily chart is not at overboght and, actually not at any resistance, it is better to use nearest Fib support to enter long – that is 1.2326. 3x3 DMA suggests that it might be B&B “Buy” pattern or DRPO “Sell”. In case of B&B, market probably will reached 1.2326 and may be test WPP, while DRPO suggests deeper retracement, probably to K-support around 1.2285-1.2295 area. That is also aproximately a former upper border of daily flag. For stop placement there are two areas – below K-support area or below 1.2211-1.2230 – 0.618 support and WPS1. Logically, first level is more suitable, since if market will break K-support, it will return back inside of flag. That will be enough to negate bullish perspective. Second area is a bit conservative, but it will protect you from possible spikes around K-support. May be it makes sense place stop there, and when market will reestablish upward move – move stop to breakeven or below K-support.

Conclusion:
Long-term bearish sentiment still in play, but as current upward bounce was rather fast, market has some upward momentum that makes possible move to 1.25-1.26 area. At least currently I see nothing on charts that could make it impossible. In medium-term perspective, situation will depend on whether price stop at this area or proceed higher.
In short-term perspective we have bullish context that should lead market to 1.25. Nice area for long entry is 1.2326, next is 1.2285-1.2295. If market will return right back below it – do not enter long, since this is not quite logical from bullish perspective.
The technical portion of Sive's analysis owes a great deal to Joe DiNapoli's methods, and uses a number of Joe's proprietary indicators. Please note that Sive's analysis is his own view of the market and is not endorsed by Joe DiNapoli or any related companies.
