FOREX PRO WEEKLY August 25-29, 2014

Any change on overall situation with GBP & NZD with this sentiment change recently on USD!? GBP Butterfly to 1.75 & Kiwi to .0.92 is bigger picture right.!? But at what point do these patterns become 'invalid'!? Yea..my olde Russian friend!? :D
 
Hi sive,

Where do you suggest us to place stoploss if we want to trade stretch pattern directly? By the way we have also kibby right? (OS + Fib extension)

Thanks
 
Hello Sive,
I agree with most of your currency analysis, but not the political considerations.
Of course the EU did make some foreign policy mistakes, but much, much less than the US, (see Iraq, see Afghanisthan, see Syria) and many of the US mistakes have impacted negatively foreign EU decisions (they are allies, aren´t they?)
The Euro weaknes is not political but simply the end of an unsustainable EU/US exchange value.
What goes up must come down.
Greetings

A FOOL AND HIS MONEY ARE SOON PARTED
 
Here is cable monthly chart: View attachment 16544
It did not complete 100% ab=cd at 1.7220. So if it does not do 1.6370-1.6390 zone(BnB buy and stop grabber) we may get DRPO sell after 1.7270 is done.
 
Hi sive,

Where do you suggest us to place stoploss if we want to trade stretch pattern directly? By the way we have also kibby right? (OS + Fib extension)

Thanks
Yes, Kibby as well. I do not mention it, since it is not as famous as Stretch.
Well, concerning stops... You can apply dynamic stop below OS on lows (not on close prices - read Joe comments on application of Predictor oscillator). Or you can wait intraday patterns and place stop below invalidation point + 40 pips (harmonic unit for daily EUR). For example, if invalidation point of some pattern is 1.32, then you can place stop to ~1.3160.

Here is cable monthly chart: View attachment 16544
It did not complete 100% ab=cd at 1.7220. So if it does not do 1.6370-1.6390 zone(BnB buy and stop grabber) we may get DRPO sell after 1.7270 is done.

Hi Venelin,
good observation. I also have looked at it on weekend, but due lack of patterns on intraday charts have decided to wait a bit more, may be 1-2 weeks...
 
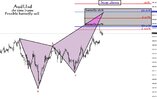
AudUsd
1hr time frame
Possible selling butterfly
audusd 1hr.jpg
 
USDJPY Long ?

USDJPY , I am Long in the market . Sive was giving me some references and I also wanted to restudy the weekly ... but all of Sive´s charts are gone .

One hint I received is a butterfly sell in daily .

As I have ZERO experience with butterfly , my butterfly will probably put a smile on your faces .

USDJPYDaily_BearishTriangle_First_Ever.jpg

Would appreciate any feedback especially as tonight is big news on JPY and I rather close with some losses before . Entry 104.040 , TP 105.000 , SL is 103, 500 == Fib 23,6 at H4 = 103.617 ( RMMM could 102.800 max ) .

KB
 
USDJPY , I am Long in the market . Sive was giving me some references and I also wanted to restudy the weekly ... but all of Sive´s charts are gone .

One hint I received is a butterfly sell in daily .

Here is our JPY analysis foundation monthly graber and daily butterfly. BTW, weekly sideways action also could be treated as bullish dynamic pressure. We also have talked about it in weekly researches:
grabber.png

butterfly.png
 
agreed @Lolly , sounds like u and me are virtually sitting in the same boat :)

@ Sive : Thank you VERY much , once again

KB
 
Back
Top