Sive Morten
Special Consultant to the FPA
- Messages
- 18,664
I HAVE SOME PROBLEMS WITH ACCESS TO FPA FTP SERVER,
SO TODAY RESEARCH WILL BE IN OLDER FORM - WITH ATTACHEMENTS.
FPA IS WORKING WITH THIS PROBLEM AND WILL FIX IT AS SOON AS POSSIBLE
SORRY FOR ANY INCONVENIENCE
SO TODAY RESEARCH WILL BE IN OLDER FORM - WITH ATTACHEMENTS.
FPA IS WORKING WITH THIS PROBLEM AND WILL FIX IT AS SOON AS POSSIBLE
SORRY FOR ANY INCONVENIENCE
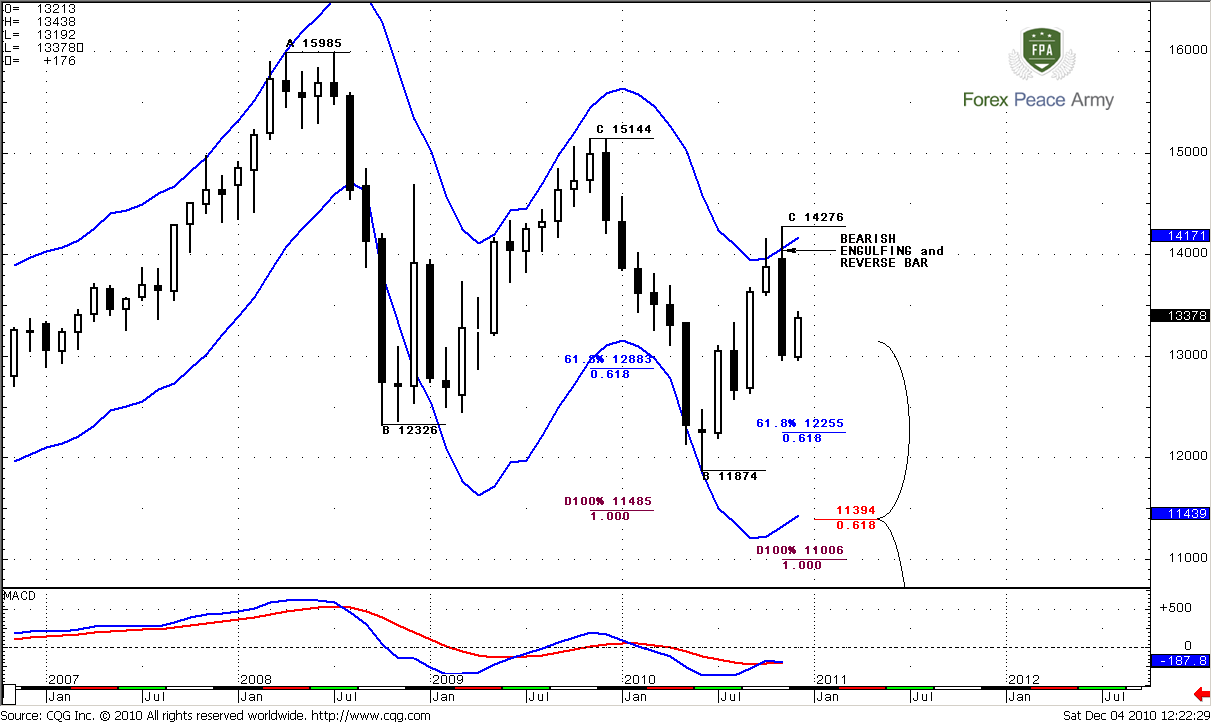
MonthlyMonthly trend is formally bullish, but price action does not absolutely confirm that. Currently the more important is the long-term targets of possible move, based on monthly chart analysis. During the previous research we’ve said that down move has started due to situation that could be interpreted twofold. From the one point of view – this was “Stretch” sell pattern (market has reached Fib resistance simultaneously with overbought). Usual target of this pattern is a zero point on Detrended oscillator or the middle between two lines of Oscillator predictor. I will not bother you with calculations and just tell that this is approximately 1.27 area.
From another point of view – we may treat current retracement up as B&B LAL pattern from the previous swing down. I say LAL (Look-alike) because thrust down has no sufficient number of bars. The target of this trade is 5/8 Fib support from whole opposite to trust price move. This is 1.2793. I’ve decided just remind you this stuff, because it still valid.
Also take a look – market has formed bearish engulfing November bar that also is a reverse bar. And I think that this is an absolutely tradable bar from technical point of view. As you know, bearish engulfing signal remains valid, until market will not take over the highs of this bar. So, currently we can trade that swing down. The nearest target on monthly chart is a 0.618 Fib expansion from more recent ABC-top pattern at 1.2255. Another target is 100% Fib expansion and Agreement from larger and former ABC-top at 1.1485 area, this is also a monthly oversold level. But currently we are more interested in nearest target.
Weekly
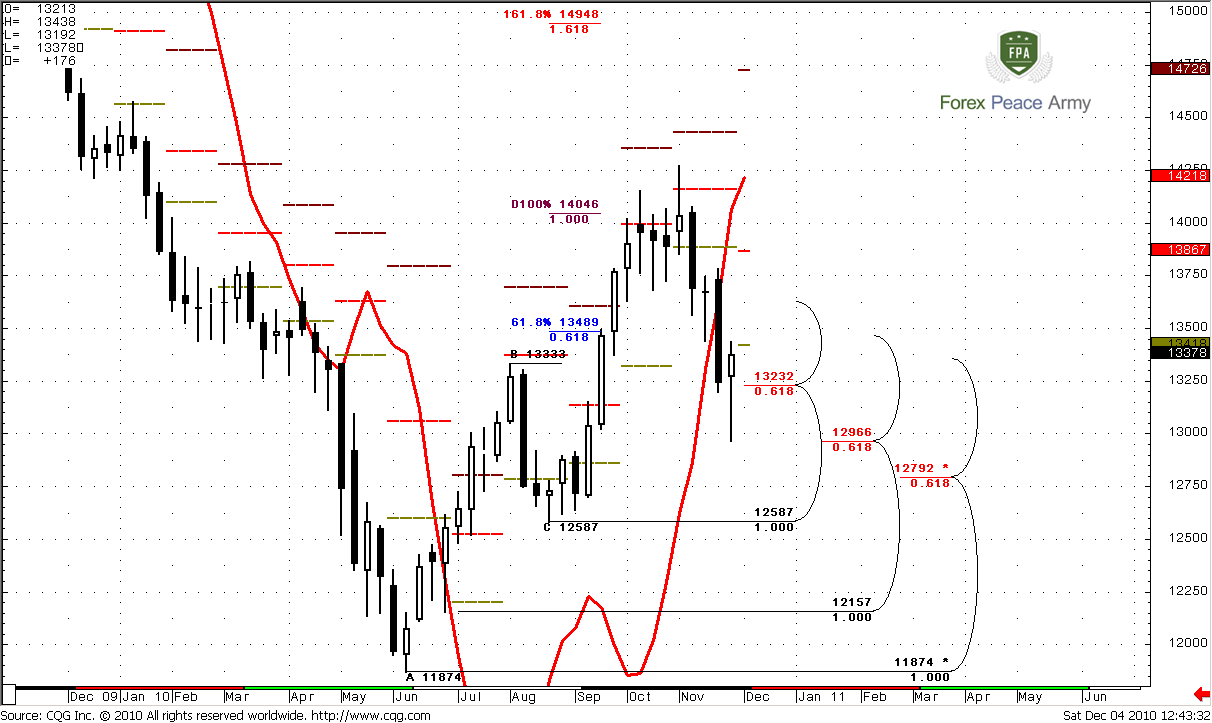
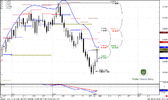
As I’ve said in previous researches current support area will be decisive for the further up move continuation. This is 1.3233-1.3360 weekly confluence support and previous highs area. After two nasty down bars, when market just collapsed – very strange to see hammer candle. It makes analysis very difficult. On former week it seems that market has already broken this area and in fact it did. But minor Fib support around 1.2966 has held the market and it returns back above the area that we’ve talked about. So the main question now – will market show weekly AB-CD retracement, or it will be just AB current move and market will continue its move to the upside.
If we talk only about monthly and weekly analysis, I would say that AB-CD retracement is more probable. Understand – market has shown just 0.618 retracement from previous leg down on monthly chart and hit overbought. Now it shows strong sell-off and very weak November’s close. 0.618 Fib expansion at 1.2250 area is just a minor target. Our weekly support area has been broken too deep, to remain a support. These Fib levels has been erased by the price, except may be 1.2966, besides, market was oversold on daily time frame – it could be just a bounce in down trend. And currently I think that it is. The key moment for finding a decision of this riddle is market responding on strong daily resistance levels.
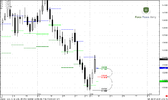
Daily
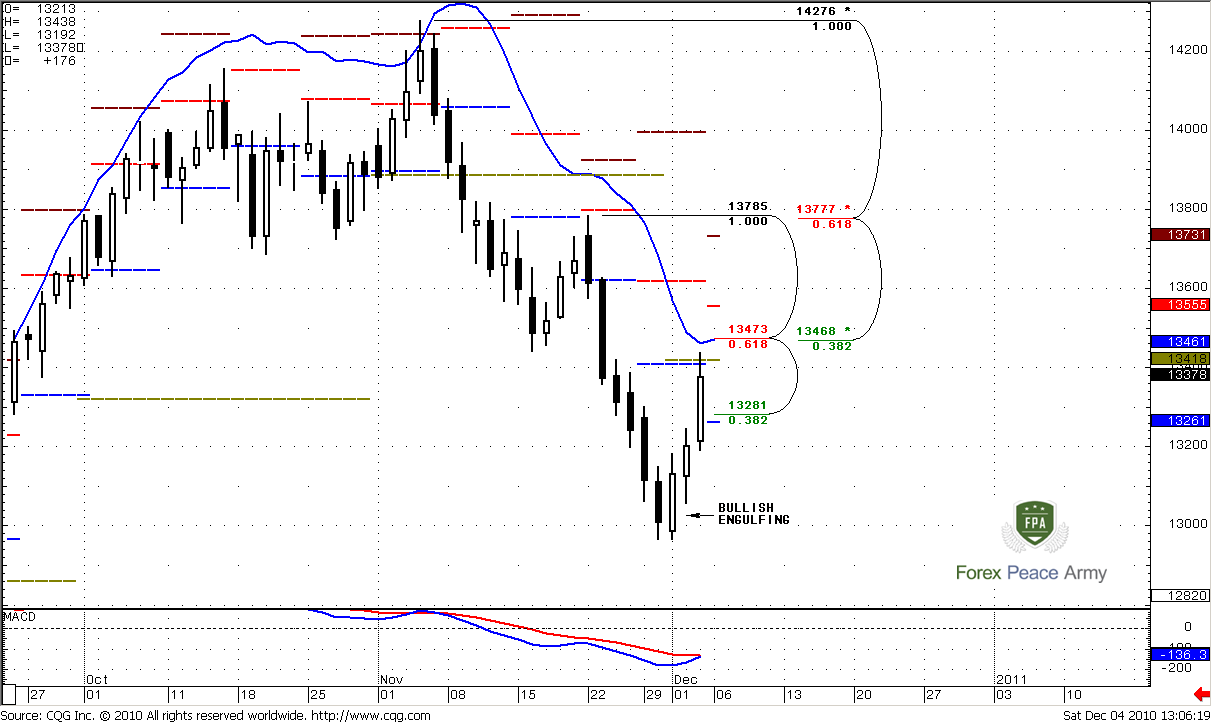
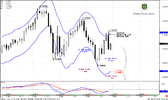
Daily trend is at virgin to turn bullish. Retracement has started from bullish engulfing pattern that we’ve discussed during the week. 1.3281 level is no more the Fib resistance, because it has been erased by price action. There are four important levels on daily time frame for coming week. First one is weekly pivot at 1.3261, second – monthly pivot at 1.3418, third – daily Confluence resistance and overbought level at 1.3468-1.3473 and weekly pivot resistance 1 at 1.3555. Now, how we can estimate are bears still in charge or not, any thoughts?
Scenario #1 – market will open higher and continue it’s move to the upside.
Ok, first of all, when market retraces during bear trend, it usually retraces to weekly pivot resistance 1. You can see it during previous retracement up. It means, that if bears are still in charge market should fail at weekly pivot resistance 1. This is a top beacon for coming week. Also just above the market the strong area of resistance – daily Confluence and daily overbought. The normal price action suggests that market should bounce from there. So the first task for coming week – is look for Sell signals between 1.3470-1.3555 area. If they will appear – you can sell with target at least at weekly pivot or even 5/8 Fib support at 1.3148 (daily chart #2).
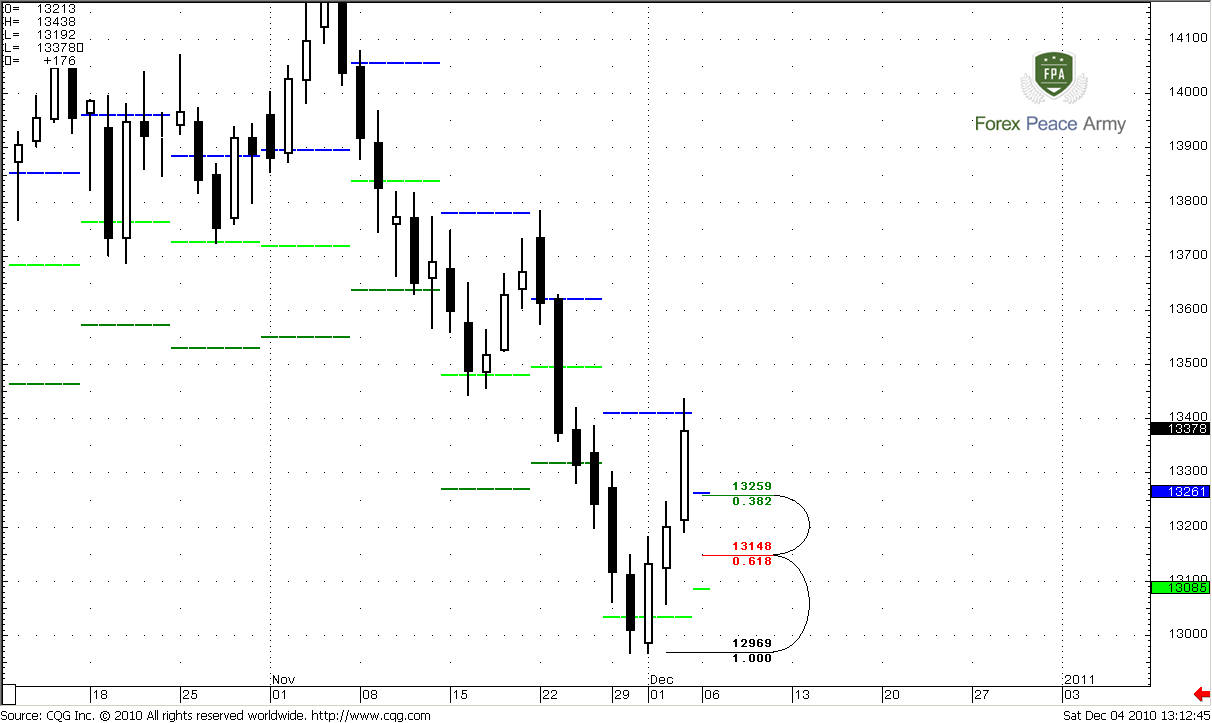
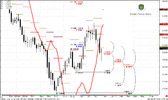
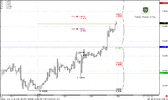
Scenario #2 – market will open and start retracement to the downside before reaching strong area of resistance and weekly pivot resistance 1.
Let’s look at daily chart #2. The first support is 1.3259 and weekly pivot at 1.3261, the next one is 5/8 Fib support at 1.3148. Weekly pivot support 1 is at 1.3085. In this scenario you should look for market behavior around weekly pivot point. If you will see some intraday ABC’s that will make an Agreement with first support area or second support – much better. Look for buy signals around weekly pivot – if market will show some and hold above it – you can buy with target at daily Confluence resistance. If not and market will move below weekly pivot – don’t be long. It will mean that possibly, market will continue its move to the downside.
But intraday price action makes me think that first scenario is more probable, due to intraday logical profit objectives that are just above the market.
#1
#2
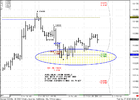
1-Hour
Hourly trend is bullish. Market has shown nice thrust up on NFP release and accelerates from 0.618 Fib expansion target directly to 1.272. Also it moved above monthly pivot currently. Usually, in this circumstances market reaches 1.618 expansion target at 1.3460 that is just above the market and in Agreement with daily Confluence resistance.
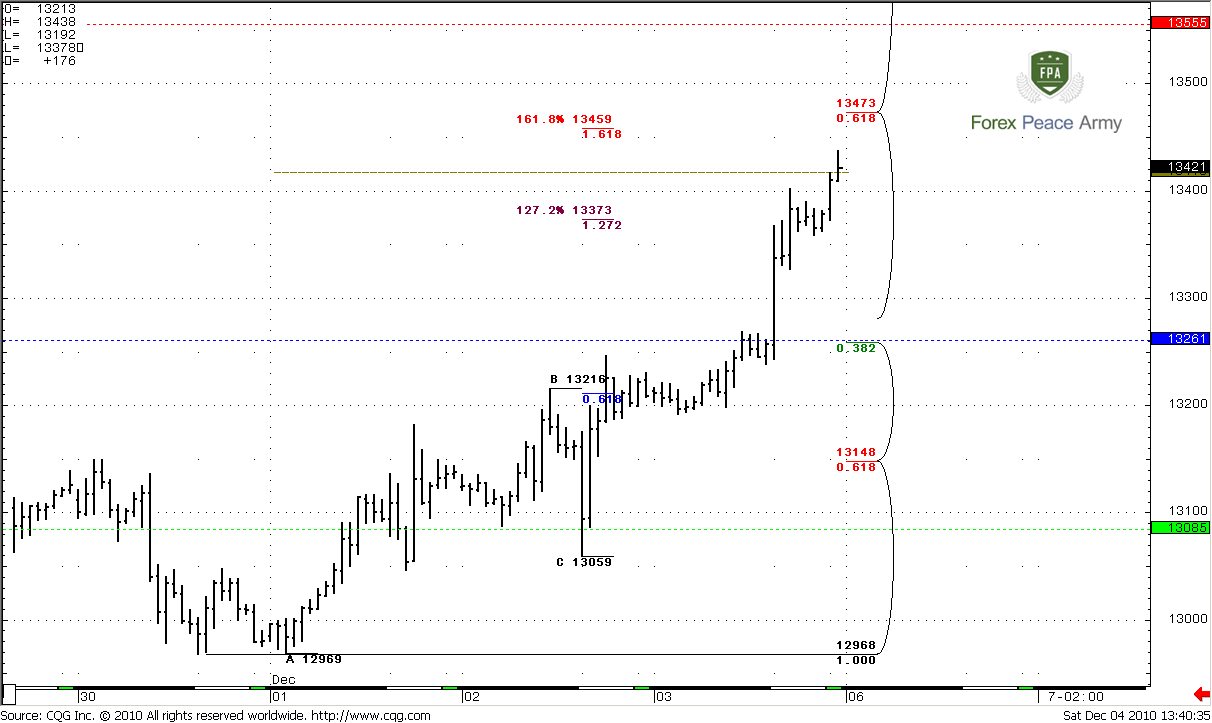
Conclusion: Personally, I expect higher open on Monday and reaching 1.35 area by the market. I will search for “Sell” signals on intraday chart in area between daily Confluence resistance and weekly pivot resistance to possess myself at least till weekly pivot point.
If, however, market will still open lower and start a retracement before reaching strong resistance area – I will be follow the scenario 2 in daily part of research.
The technical portion of Sive's analysis owes a great deal to Joe DiNapoli's methods, and uses a number of Joe's proprietary indicators. Please note that Sive's analysis is his own view of the market and is not endorsed by Joe DiNapoli or any related companies.
Attachments
Last edited by a moderator:
") so why sorry or thanks too teammates ! hehe Cheers sir ... great learning from you ..
so why sorry or thanks too teammates ! hehe Cheers sir ... great learning from you ..