Sive Morten
Special Consultant to the FPA
- Messages
- 18,785
Monthly
The dollar rose for a second straight session against the euro on Friday, as investors began pricing in the possibility that the U.S. Federal Reserve could announce a small reduction in its massive stimulus at next week's meeting. While market participants in general expect the Fed to start paring back its stimulus no later than March, a growing number expect a reduction in the Fed's asset purchases may be announced at the central bank's Dec. 17-18 policy gathering. The bond market and, increasingly, the dollar, are beginning to price in a higher risk of a modest move by the Fed next week," said Omer Esiner, chief market analyst at Commonwealth Foreign Exchange in Washington. Esiner cited Thursday's strong U.S. retail sales number and this week's budget agreement in Washington, which removed the risk of another showdown over government spending early next year. "The budget deal greatly reduced the fiscal headwinds cited by Fed officials in the past as a hurdle to the removal of monetary accommodation," he added.
Europe's economy, in contrast, remained sluggish compared to that of the United States. Thursday's soft euro zone industrial output was a stark reminder of the 17-member group's economic challenges and kept the risk of further easing from the European Central Bank on the table. In late New York trading, the euro fell 0.15 percent against the dollar to $1.3731. On the week, however, Europe's common currency was still up 0.2 percent, its best weekly gain since mid-November.
Marshall Gittler, head of global FX strategy at IronFX Global, who thinks the Fed will begin tapering next week, said he expects dollar/yen to reach 130 yen by the end of next year as Japan's economic struggles come to the fore. So far this year the dollar has gained 19 percent against the yen while the euro has risen 24 percent, on expectations the Bank of Japan will provide even more stimulus next year. The euro in general has been resilient despite recent poor economic data, as two-year swap rates rose to their highest levels in a month. The European Central Bank said on Friday banks will return 22.65 billion euros of crisis loans to it next week, above analysts' forecasts, tightening liquidity in the bloc. Citi strategist Valentin Marinov said this can help push the euro higher for now, but it isn't positive for the euro longer-term as tightening liquidity hits lending and growth.
The amount is the highest weekly repayment since February, when banks had the first chance to pay back funds from the second 3-year loan. The ECB will take a thorough look at the euro zone's top lenders' books before it takes up responsibility as their supervisor from November next year. Banks have already started to clean up their balance sheets in anticipation of such tests. The pace with which banks are returning the 3-year loans they took from the ECB in late 2011 and early 2012 has picked up over recent weeks. The loans mature in early 2015. The repayments were almost four times the expected amount in a Reuters poll of money market traders - they had expected 6.0 billion euros to be returned to the central bank. By repaying the ECB's crisis funds early, banks are further reducing the level of excess liquidity - cash beyond what lenders need to cover their day-to-day operations - that is flushing around the banking sector. That has pushed it down to 163 billion euros - close to a 2-year low. The ECB is monitoring this development closely as resulting higher bank-to-bank borrowing costs could undermine the euro zone's patchy recovery. On Friday, the ECB said seven banks would repay 3.32 billion euros from the first LTRO on Dec. 18, and 9 banks will pay back 19.33 billion euros from the second LTRO. After these repayments, banks have one more chance to repay loans this year, before a year-end break. Repayment announcements will resume on Jan. 10. After this payment Banks still will need to pay out ~200Bln EUR till 2015. It means that we again could meet surprising high volatility in swap rates that could trigger EUR growth at the eve of next payment.
Technical
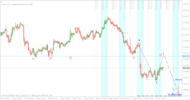
So, from fundamental point of view, as we’ve read above, the reason for recent EUR growth is extraordinary demand on EU currency at the eve of huge banks’ payment of bailout credits. While from technical point of view upward action could be explained by price action on monthly chart. Actually, this behavior could be an early sign of extended upward action, guys. I will take a roundabout approach to the subject. Recall that in November and even in the beginning of December, when move down from yearly pivot resistance has started, we asked – what is this? Is it downward trend re-establishing, or just retracement before upward continuation? Our criteria was to see whether market will exceed allowable retracement down or not. Thus, we’ve said – since market has hit just 0.618 AB-CD target, it should not show deep retracement. Thus if market would pass below 1.33 this could be a sign of downward trend. But this has not happened. But what has happened? Take a look – after hitting 0.618 market has shown only minor 3/8 retracement from the most recent (CD) leg of AB-CD pattern. That is absolutely normal and even theoretically perfect AB-CD action. Now price has returned right back to previous highs. We know that 1.3775-1.3830 is very strong resistance area, including YPR1, AB-CD minor target and 5/8 Fib resistance, but now target is not in play anymore, and level itself has been tested once already. And all this hard rock and scaring resistance has led market only to 3/8 minor bounce... Interesting...
What I’m trying to say, guys, is that picture looks perfect by far as flawless AB-CD upward action. It means that market could be on a way to 1.44 area – target of AB-CD pattern. And our control point will be – previous highs. If market will exceed them, this will have a greate value for next year as well. Market will move above YPR1. So, currently major point for monitoring on EUR is price action around previous highs. Because the major concern here – what if this move up really was triggered only by lack of EUR liquidity for payment and it will end as fast as it has started.

Weekly
Trend has turned bullish here. As you can see we have some potentially bullish patterns. First is the same AB-CD as on monthly chart, second is Buttefly “sell” that has almost the same completion point, very close to AB-CD target. In shorter-term, it seems that market has formed bullish dynamic pressure within previous 4 weeks. Trend by MACD was bearish, but price action has moved higher and higher. As a rule, appearing of dynamic pressure suggests taking out of previous highs.
So, on weekly time frame we do not have any clear bearish patterns right now. The one a bit disturbing moment is that CD leg is much flatter than AB and it could suggest existance of some weakness in current upward action. Weekly chart as well as monthly points on importance of previous highs. Initially we’ve suggested that current move up could be respect on K-support area around 1.33 where bullish engulfing pattern was formed (right in the beginning of most recent move up). But retracement suggests smaller counter-trend swing and greater trend swing. That is just how trend develops. But right now, if upward swing will increase previous swing down – that will not be a retracement anymore, right?
Another interesting observation here – take a look at upward move of right butterfly’s wing, does it remind you anything? No? Now take a look at the swing of AB leg. They are the same, but former is 2 times smaller than the latter. Could we get another smaller butterfly here? Why not. Market very often forms butterflies near the tops. Anyway it’s nothing to trade yet on weekly chart, only to monitor very significant action that could take place right around the previous highs.

Daily
On daily time frame trend holds bullish, but unfortunately we do not have any patterns for trading. DiNapoli directional patterns also can’t be formed here – it’s a poor thrust up. So, market has reached 1.618 extension of major AB-CD pattern and has formed small bearish engulfing – that’s all that we have by far. Price has enough room to trend breakeven point by MACD. Still, we can make some useful conclusions and observations. First is, as ultimate 1.618 extension was reached, price could continue move up only by shifting to greater AB-CD, where current move up will be first leg. It means that retracement down probably should be significant. If price will start to form, say, butterfly “sell” here – conclusion is the same, retracement down should be solid. Although we have a lot of levels here, including K-support, following previous thought I would look for 1.3550 Fib support area as potential upward reversal. Mostly because this level fulfills EUR all conditions. It will be sufficient as retracement for butterfly, also it includes with major 50% retracement level and we know that EUR likes 50% levels. Finally it coincides with previous consolidation that was formed earlier – just contract the chart a bit and you’ll see. Appearing of deep retracement instead of immediate breakout could be some sort of trap. Because people, when the will see the retreat from previous high could start to think that it’s over and market has turned down. Then, suddenly at some deep support market will blast up again. I do not want to say that it will definitely happen, this is just one of the scenarios. May be this will happen even on Wednesday, if FOMC will not announce any QE tapering at all. And right before Wed, traders could fix profits of previous rally and that could trigger deep retracement. So, here we have more questions rather than answers, but no clear pattern to trade. So, let’s see what will happen.

Intraday charts
Right now guys, I see nothing on intraday chart, upward action just has taken a pause and no reasonable patterns have been formed yet. I’ve promised to focus on EUR and it cares solid potential in longer term but cares nothing for immediate short-term trading. May be we will get something w/c.
Conclusion:
Depending on price action around previous highs EUR could get huge upside potential, if current move up is something more valuable than just short-term liquidity demand splash at the eve of bank’s debt payments. Unfortunately, in short-term perspective market has had not enough time to form any clear patterns yet, since upward action just has finished.
Right now we will monitor possible retracement down. If it will reach 1.3550 as we’ve suggested, then it could be a challenge on possible butterfly appearing. Result also will strongly depend on FOMC rhetoric on Wed.
The technical portion of Sive's analysis owes a great deal to Joe DiNapoli's methods, and uses a number of Joe's proprietary indicators. Please note that Sive's analysis is his own view of the market and is not endorsed by Joe DiNapoli or any related companies.
The dollar rose for a second straight session against the euro on Friday, as investors began pricing in the possibility that the U.S. Federal Reserve could announce a small reduction in its massive stimulus at next week's meeting. While market participants in general expect the Fed to start paring back its stimulus no later than March, a growing number expect a reduction in the Fed's asset purchases may be announced at the central bank's Dec. 17-18 policy gathering. The bond market and, increasingly, the dollar, are beginning to price in a higher risk of a modest move by the Fed next week," said Omer Esiner, chief market analyst at Commonwealth Foreign Exchange in Washington. Esiner cited Thursday's strong U.S. retail sales number and this week's budget agreement in Washington, which removed the risk of another showdown over government spending early next year. "The budget deal greatly reduced the fiscal headwinds cited by Fed officials in the past as a hurdle to the removal of monetary accommodation," he added.
Europe's economy, in contrast, remained sluggish compared to that of the United States. Thursday's soft euro zone industrial output was a stark reminder of the 17-member group's economic challenges and kept the risk of further easing from the European Central Bank on the table. In late New York trading, the euro fell 0.15 percent against the dollar to $1.3731. On the week, however, Europe's common currency was still up 0.2 percent, its best weekly gain since mid-November.
Marshall Gittler, head of global FX strategy at IronFX Global, who thinks the Fed will begin tapering next week, said he expects dollar/yen to reach 130 yen by the end of next year as Japan's economic struggles come to the fore. So far this year the dollar has gained 19 percent against the yen while the euro has risen 24 percent, on expectations the Bank of Japan will provide even more stimulus next year. The euro in general has been resilient despite recent poor economic data, as two-year swap rates rose to their highest levels in a month. The European Central Bank said on Friday banks will return 22.65 billion euros of crisis loans to it next week, above analysts' forecasts, tightening liquidity in the bloc. Citi strategist Valentin Marinov said this can help push the euro higher for now, but it isn't positive for the euro longer-term as tightening liquidity hits lending and growth.
The amount is the highest weekly repayment since February, when banks had the first chance to pay back funds from the second 3-year loan. The ECB will take a thorough look at the euro zone's top lenders' books before it takes up responsibility as their supervisor from November next year. Banks have already started to clean up their balance sheets in anticipation of such tests. The pace with which banks are returning the 3-year loans they took from the ECB in late 2011 and early 2012 has picked up over recent weeks. The loans mature in early 2015. The repayments were almost four times the expected amount in a Reuters poll of money market traders - they had expected 6.0 billion euros to be returned to the central bank. By repaying the ECB's crisis funds early, banks are further reducing the level of excess liquidity - cash beyond what lenders need to cover their day-to-day operations - that is flushing around the banking sector. That has pushed it down to 163 billion euros - close to a 2-year low. The ECB is monitoring this development closely as resulting higher bank-to-bank borrowing costs could undermine the euro zone's patchy recovery. On Friday, the ECB said seven banks would repay 3.32 billion euros from the first LTRO on Dec. 18, and 9 banks will pay back 19.33 billion euros from the second LTRO. After these repayments, banks have one more chance to repay loans this year, before a year-end break. Repayment announcements will resume on Jan. 10. After this payment Banks still will need to pay out ~200Bln EUR till 2015. It means that we again could meet surprising high volatility in swap rates that could trigger EUR growth at the eve of next payment.
Technical
So, from fundamental point of view, as we’ve read above, the reason for recent EUR growth is extraordinary demand on EU currency at the eve of huge banks’ payment of bailout credits. While from technical point of view upward action could be explained by price action on monthly chart. Actually, this behavior could be an early sign of extended upward action, guys. I will take a roundabout approach to the subject. Recall that in November and even in the beginning of December, when move down from yearly pivot resistance has started, we asked – what is this? Is it downward trend re-establishing, or just retracement before upward continuation? Our criteria was to see whether market will exceed allowable retracement down or not. Thus, we’ve said – since market has hit just 0.618 AB-CD target, it should not show deep retracement. Thus if market would pass below 1.33 this could be a sign of downward trend. But this has not happened. But what has happened? Take a look – after hitting 0.618 market has shown only minor 3/8 retracement from the most recent (CD) leg of AB-CD pattern. That is absolutely normal and even theoretically perfect AB-CD action. Now price has returned right back to previous highs. We know that 1.3775-1.3830 is very strong resistance area, including YPR1, AB-CD minor target and 5/8 Fib resistance, but now target is not in play anymore, and level itself has been tested once already. And all this hard rock and scaring resistance has led market only to 3/8 minor bounce... Interesting...
What I’m trying to say, guys, is that picture looks perfect by far as flawless AB-CD upward action. It means that market could be on a way to 1.44 area – target of AB-CD pattern. And our control point will be – previous highs. If market will exceed them, this will have a greate value for next year as well. Market will move above YPR1. So, currently major point for monitoring on EUR is price action around previous highs. Because the major concern here – what if this move up really was triggered only by lack of EUR liquidity for payment and it will end as fast as it has started.
Weekly
Trend has turned bullish here. As you can see we have some potentially bullish patterns. First is the same AB-CD as on monthly chart, second is Buttefly “sell” that has almost the same completion point, very close to AB-CD target. In shorter-term, it seems that market has formed bullish dynamic pressure within previous 4 weeks. Trend by MACD was bearish, but price action has moved higher and higher. As a rule, appearing of dynamic pressure suggests taking out of previous highs.
So, on weekly time frame we do not have any clear bearish patterns right now. The one a bit disturbing moment is that CD leg is much flatter than AB and it could suggest existance of some weakness in current upward action. Weekly chart as well as monthly points on importance of previous highs. Initially we’ve suggested that current move up could be respect on K-support area around 1.33 where bullish engulfing pattern was formed (right in the beginning of most recent move up). But retracement suggests smaller counter-trend swing and greater trend swing. That is just how trend develops. But right now, if upward swing will increase previous swing down – that will not be a retracement anymore, right?
Another interesting observation here – take a look at upward move of right butterfly’s wing, does it remind you anything? No? Now take a look at the swing of AB leg. They are the same, but former is 2 times smaller than the latter. Could we get another smaller butterfly here? Why not. Market very often forms butterflies near the tops. Anyway it’s nothing to trade yet on weekly chart, only to monitor very significant action that could take place right around the previous highs.
Daily
On daily time frame trend holds bullish, but unfortunately we do not have any patterns for trading. DiNapoli directional patterns also can’t be formed here – it’s a poor thrust up. So, market has reached 1.618 extension of major AB-CD pattern and has formed small bearish engulfing – that’s all that we have by far. Price has enough room to trend breakeven point by MACD. Still, we can make some useful conclusions and observations. First is, as ultimate 1.618 extension was reached, price could continue move up only by shifting to greater AB-CD, where current move up will be first leg. It means that retracement down probably should be significant. If price will start to form, say, butterfly “sell” here – conclusion is the same, retracement down should be solid. Although we have a lot of levels here, including K-support, following previous thought I would look for 1.3550 Fib support area as potential upward reversal. Mostly because this level fulfills EUR all conditions. It will be sufficient as retracement for butterfly, also it includes with major 50% retracement level and we know that EUR likes 50% levels. Finally it coincides with previous consolidation that was formed earlier – just contract the chart a bit and you’ll see. Appearing of deep retracement instead of immediate breakout could be some sort of trap. Because people, when the will see the retreat from previous high could start to think that it’s over and market has turned down. Then, suddenly at some deep support market will blast up again. I do not want to say that it will definitely happen, this is just one of the scenarios. May be this will happen even on Wednesday, if FOMC will not announce any QE tapering at all. And right before Wed, traders could fix profits of previous rally and that could trigger deep retracement. So, here we have more questions rather than answers, but no clear pattern to trade. So, let’s see what will happen.
Intraday charts
Right now guys, I see nothing on intraday chart, upward action just has taken a pause and no reasonable patterns have been formed yet. I’ve promised to focus on EUR and it cares solid potential in longer term but cares nothing for immediate short-term trading. May be we will get something w/c.
Conclusion:
Depending on price action around previous highs EUR could get huge upside potential, if current move up is something more valuable than just short-term liquidity demand splash at the eve of bank’s debt payments. Unfortunately, in short-term perspective market has had not enough time to form any clear patterns yet, since upward action just has finished.
Right now we will monitor possible retracement down. If it will reach 1.3550 as we’ve suggested, then it could be a challenge on possible butterfly appearing. Result also will strongly depend on FOMC rhetoric on Wed.
The technical portion of Sive's analysis owes a great deal to Joe DiNapoli's methods, and uses a number of Joe's proprietary indicators. Please note that Sive's analysis is his own view of the market and is not endorsed by Joe DiNapoli or any related companies.