Sive Morten
Special Consultant to the FPA
- Messages
- 18,699
Monthly
The dollar fell from five-year highs against the yen on Friday as investors consolidated gains this week and pared positions back ahead of the holidays, but the strong trend for the U.S. currency remained intact going into next year. Upbeat U.S. economic growth data for the third quarter, showing revised growth of 4.1 percent, reinforced the Federal Reserve's decision to start paring back its monetary stimulus and pushed the dollar to five-year peaks versus the yen earlier. The yen's losses against the dollar were compounded by a decision by the Bank of Japan (BoJ) to maintain its pledge of increasing base money in the financial system. The greenback also climbed to two-week peaks against both the euro and the Swiss franc.
"Investors are now settling into holiday ranges and we're seeing a pullback in the dollar a little bit, but this is not really significant," said Greg Moore, currency strategist, at TD Securities in Toronto. "The broad strong dollar trend is still intact." Data showed the U.S. economy grew at its fastest pace in almost two years in the third quarter while business spending was stronger than previously estimated. Gross domestic product grew at a 4.1 percent annual rate instead of the 3.6 percent pace reported earlier this month, the Commerce Department said in its third estimate on Friday. "The GDP report was consistent with an improving U.S. economy, validating the Fed's decision this week to taper stimulus by $10 billion," said Joe Manimbo, senior market analyst at Western Union Business Solutions in Washington.
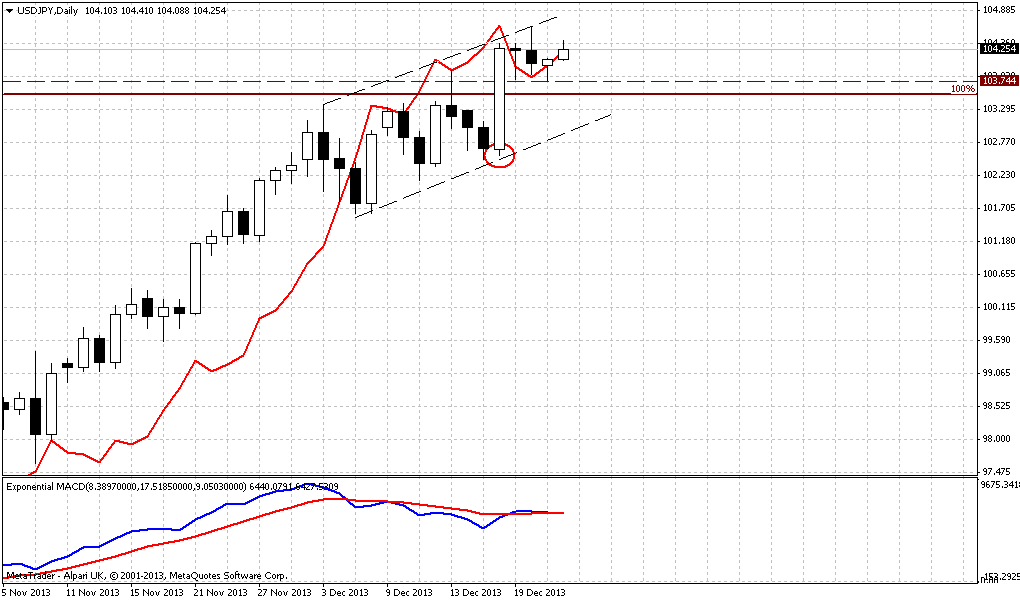
In contrast to the Fed, the BoJ reaffirmed overnight it would keep monetary policy loose. Dollar bulls are now targeting a level around 105.25 yen, a 61.8 percent retracement of the dollar's fall from its 2007 high of 124.14 yen to its 2011 low of 75.31 yen. That’s approximately a development that we’ve suggested 2 weeks ago in our weekly research, dedicated to yen. This setup is still valid and we will watch over it in next year as well.
The greenback earlier gained against the euro, which was held back by S&P's decision to cut the European Union's supranational long-term rating to AA+ from AAA, citing rising tensions on budget negotiations. The euro, which has surprised many analysts and hedge fund managers by moving higher against the dollar since the summer, fell to $1.3623 , its lowest since Dec. 5. The common currency has been boosted in recent weeks by tightening monetary conditions in the euro zone as banks repay cheap borrowing to the European Central Bank. Next week banks will return 20.7 billion euros, the ECB said on Friday, which is above expectations and which will offer further support to the currency.
MORE FROM BOJ TO COME
Two-year U.S. yields rose from 0.34 percent to 0.3677 percent on Thursday, with the differential over Japanese two-year yields now at its highest since early October. On Friday, U.S. two-year yields were at 0.37 percent. The BoJ voted unanimously to keep its pledge of raising base money, or cash and deposits at the central bank, at an annual pace of 60 trillion yen to 70 trillion yen ($576 billion to $672 billion). BoJ Governor Haruhiko Kuroda said on Friday the correction in the yen's "excessive" strength had been positive for Japan's economy. Nearly two-thirds of Japanese companies expect the BOJ to ease further in the first six months of 2014, as it tries to achieve 2 percent inflation within two years, a Reuters poll showed earlier this month. The Australian dollar, meanwhile, was trading above a 3-1/2-year low hit after the Fed revealed its stimulus reduction plans. On Friday, The Aussie dollar last changed hands at US$0.8924 , up 0.7 percent on the day.
Standing around this euphoria with promising GDP numbers and QEIII tapering start, major questing is, whether 10 Bln is a lot or few? As breaking news just has been released, on next day there are a lot of forecasts have appeared that show the shedule of closing QE III, even totally by march 2014. And what if next contraction will be not very soon, say at the end of 2014? And what is 10Bln if 75 Bln still inflow on markets? Initial rush will start to fade if Fed will be slow with next step of contraction – all could return on its own. As we haven’t got any clear confirmation of reversal yet, I think that we should not haste with drastical conclusions, especially on EUR. On JPY – yes, there we have double impact as from Fed as from BoJ. And if even Fed will be indecisive, BoJ will make the rest and trend on JPY has better foundation than EUR.
Technical
On previous week our major concern was around recent EUR growth and we have needed to estimate, whether this growth was triggered only by ECB measures of liquidity contraction or, it has some stronger foundation. Now we see that either this move really was due ECB or recent US data and Fed has impacted on markets, but EUR has stopped its growth.
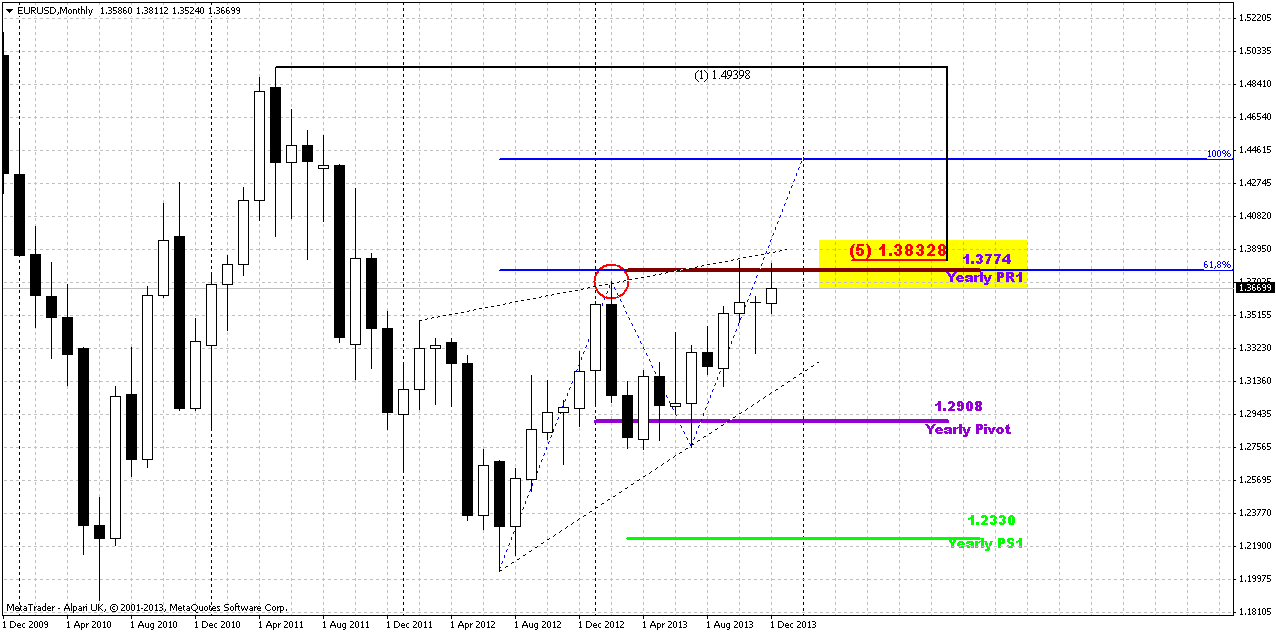
Generally speaking we still stand around determination point – at major monthly resistance 1.3775-1.3830 and previous swing high. And market has not done any drastical steps yet. From the one point of view, retracement after first hit of 0.618 target of AB-CD pattern was shy and that is perfect for bullish development, but from the another point of view – market was not able to pass through this target and stand on course to 1.44 area, but stuck in solid resistance. We know that 1.3775-1.3830 is very strong resistance area, including YPR1, and 5/8 Fib resistance. YPR1 has special meaning here – if price will move above it, it will significantly increase probability of further upward action in 2014. As end of the year is gradually approaching, market could sit in the range as investors will avoid strong trading activity. But conclusion here is simple – we either should see upward breakout and take long position, or some reversal pattern on weekly/daily chart and start to think about enter short. Right now market still stands on the edge here.
Weekly
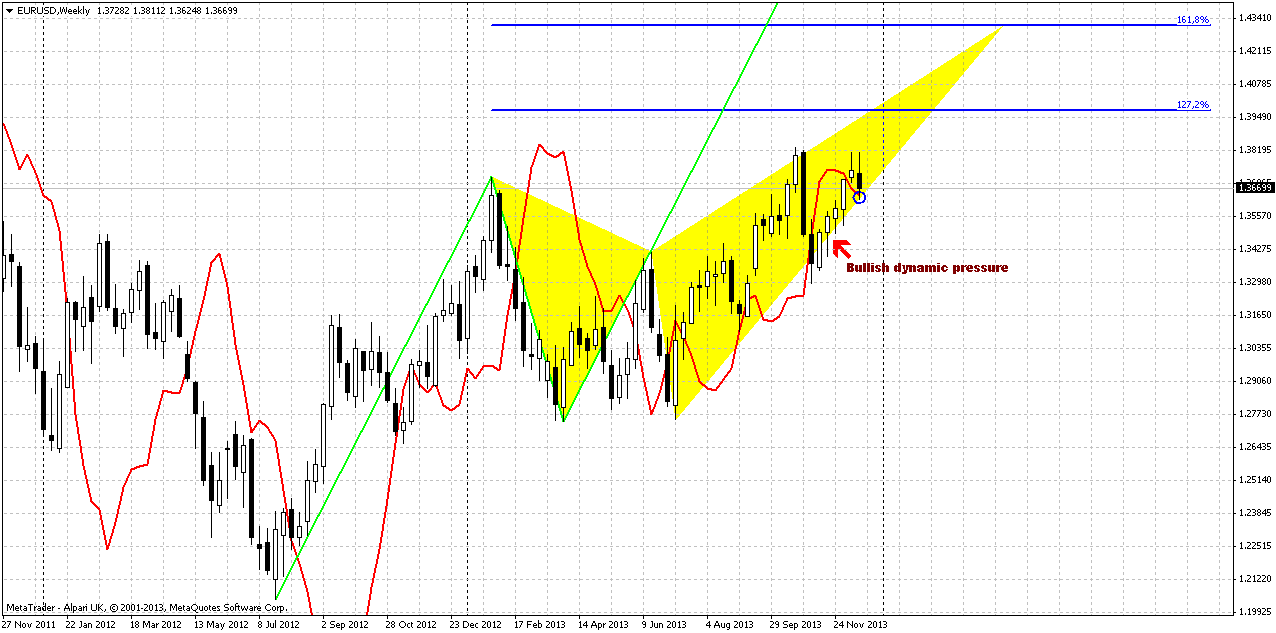
Sometimes, guys, technical pictures shows very interesting setups, that could point on such resolving of the riddle that you never could suggest by yourself. And here we see rather tricky picture. So, we just have said that we need either breakout or reversal by some reversal pattern and depending on what we will get – we will take position, right? But what do we see here, on weekly chart? I ask you – does butterfly reversal pattern? Yes. But reversal points stand too high compares to our suggestion. We’ve suggested that market probably will fail to pass through current 1.38+ resistance and that should indicate it’s reversal. But what if market will show reversal by this butterfly? The reversal point agrees with the upward AB=CD target and stands around 1.44. This is also an area of 1.618 initial smaller AB-CD pattern (not shown here) Should we exclude this possibility? Well, currently I do not see any reasons to do this. Invalidation point of this butterfly is 1.2770s low. Major events will take place probably only in 2014 and next two canldes here could be small, market could turn to consolidation. But situation with upside potential is not done yet here.
In shorter-term perspective, we said previously that market has formed bullish dynamic pressure – take a look within a month market moves up, while trend holds bearish. Now trend has turned bullish and see – price has formed bullish stop grabber. This is not a stop grabber that I prefer to trade, but still, this is the pattern that suggests taking out of previous highs, as well, as dynamic pressure. As you can see situation is not as simple as it has seemed before, only on GDP=4,1% and QE tapering...
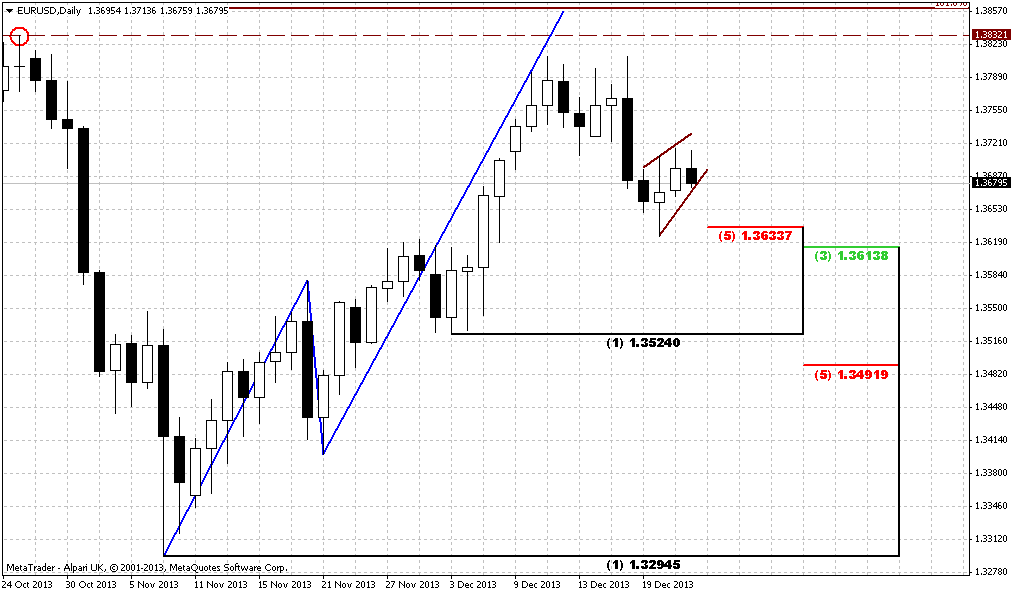
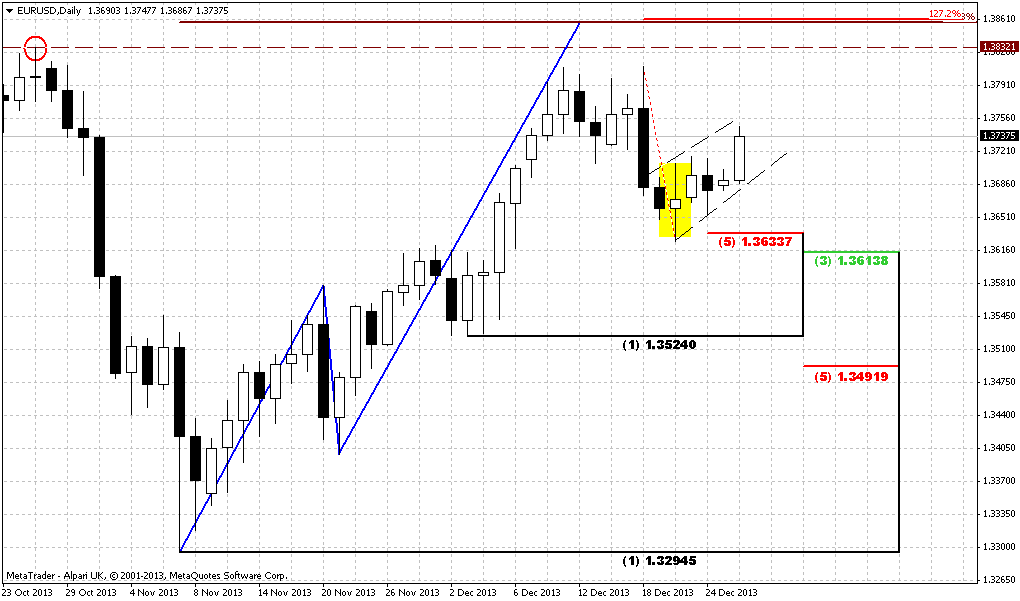
Daily
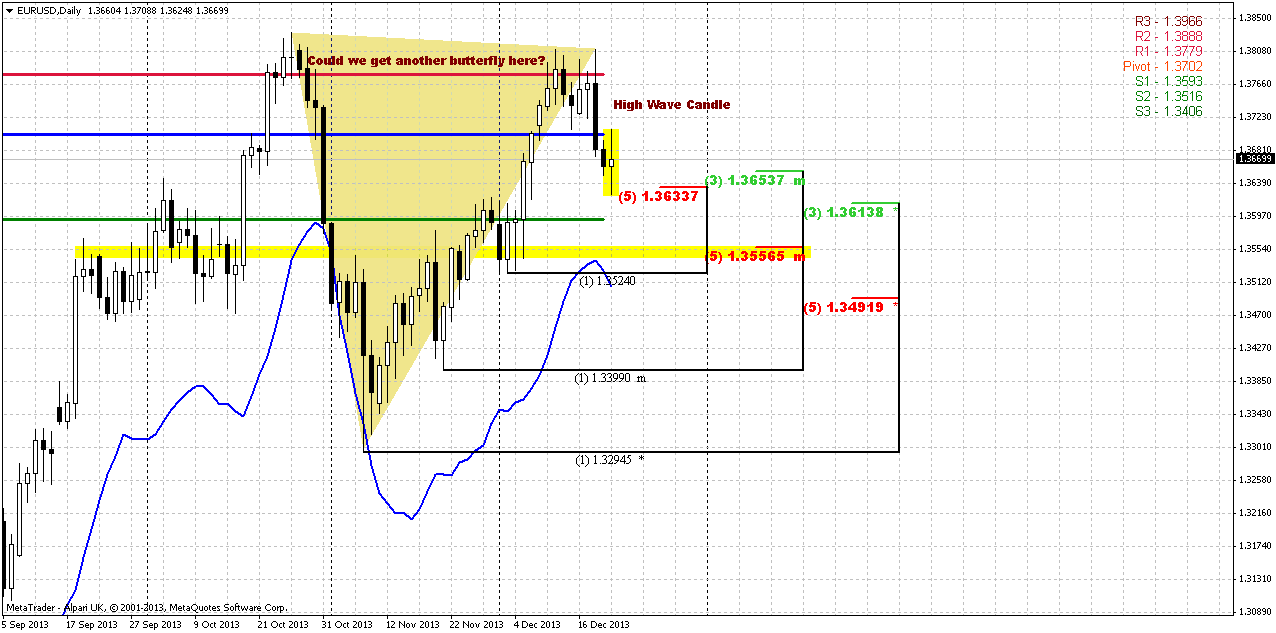
Appearing of bullish stop grabber on weekly was accompanied by appearing of high wave pattern here, on daily. Trend is bearish, market has shown a respect of daily K-support as we’ve suggested, but now it is interesting, what to expect next. High wave is neither bullish nor bearish by itself; it just indicates market indecision or indifference concerning current action. Thus, major direction will be estimated when market will take out either highs or lows of high wave pattern. Meantime, K-support area is rather wide and includes also major 3/8 Fib support level that has not been touched yet. Also WPS1 will also stand around it. So, the first development that we can suggest here is possible return right back down to wide support cluster, although I’m not sure that market will pass through it fast.
Taking broader view on current situation – we could get another butterfly here, guys. Right wing of it I have drawn already here. Daily trend is bearish here, and theoretically we should trade market in bearish direction. At the same time we have to take short-term trades and do not marry any position, since it is not obvious situation on higher time frames. May be some short-term downward continuation will follow as a result of initial bearish impulse, but maximum that we could take from it is next extension target, but not more, I suppose.
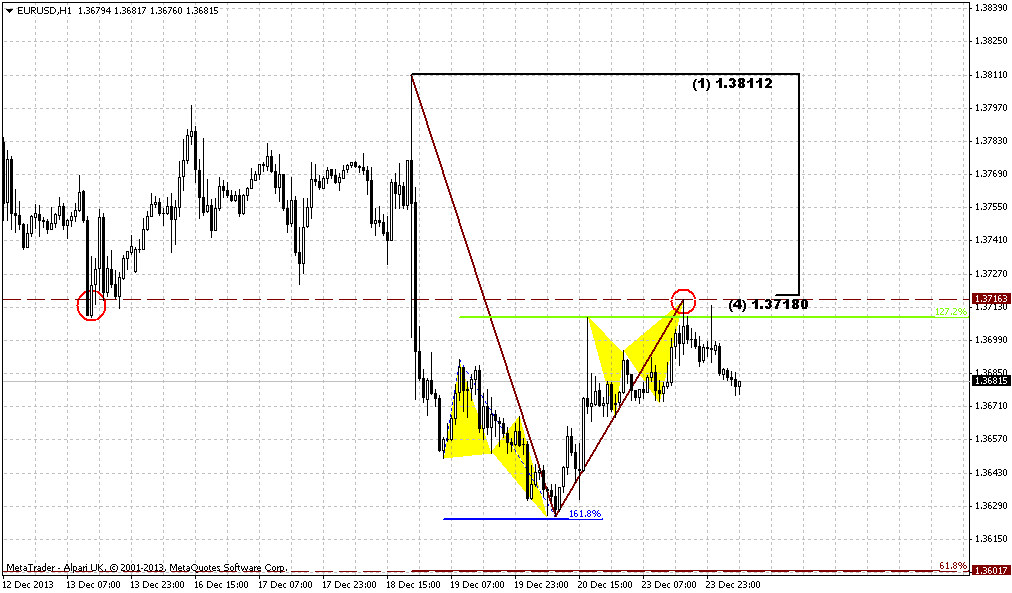
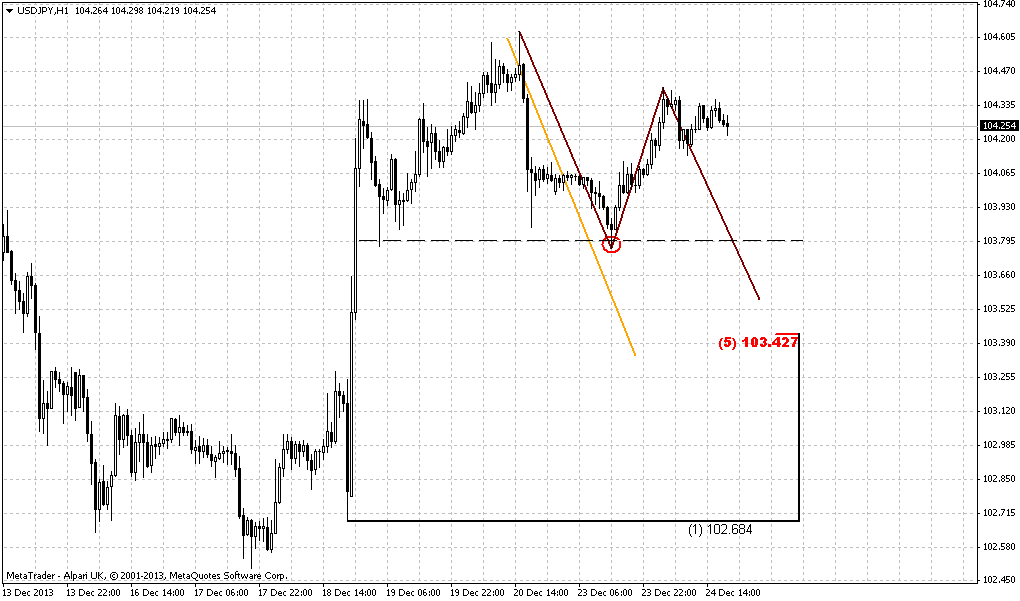
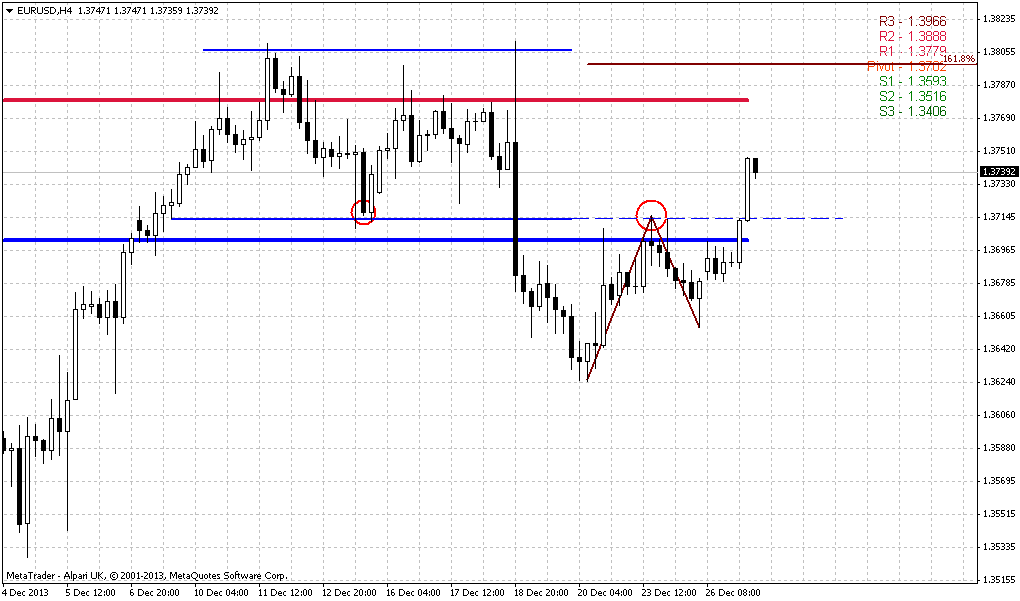
60-min
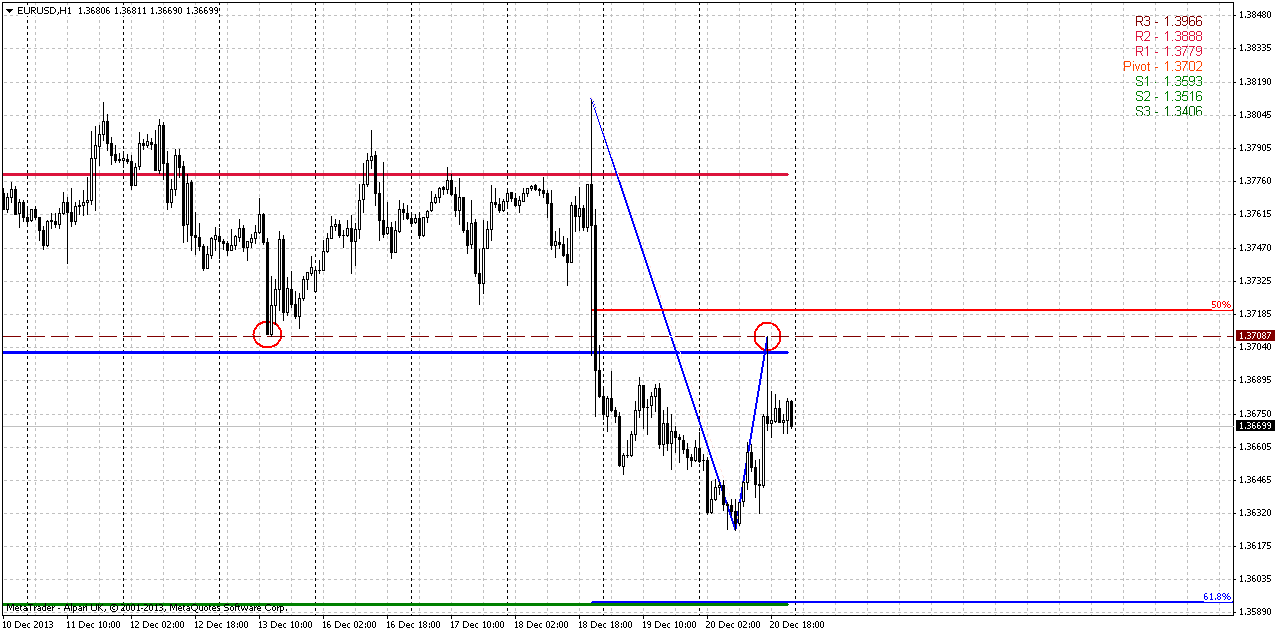
That’s what I’m talking about. On Friday market has shown reasonable upward retracement, as we’ve suggested. Price has not quite reached 50% level, but stuck in natural support/resistance zone. As downward impulse was solid, we can suggest appearing of AB-CD down here with minor extension at 1.36 level – that agrees with WPS1 and lower border of daily K-support. Currently we do not have possibility to choose and rely on more extended targets, since we do not have any extended patterns yet, that could point these targets for us. Later we will see what do next. At the same time I can’t exclude that we will run from one scalp target to another till the end of the year.
Conclusion:
Despite all positive USD data of previous week, action on EUR does not suggest yet total and final reversal. Price still coiling around edge point and currently chances exist as for upward breakout as for downward reversal. To rely on direction whatever it will be, we need to get clear patterns that could confirm it and point extended targets for us.
Until this will not happen, we probably will have to deal with scalp fast trades on daily chart and lower ones.
The technical portion of Sive's analysis owes a great deal to Joe DiNapoli's methods, and uses a number of Joe's proprietary indicators. Please note that Sive's analysis is his own view of the market and is not endorsed by Joe DiNapoli or any related companies.
The dollar fell from five-year highs against the yen on Friday as investors consolidated gains this week and pared positions back ahead of the holidays, but the strong trend for the U.S. currency remained intact going into next year. Upbeat U.S. economic growth data for the third quarter, showing revised growth of 4.1 percent, reinforced the Federal Reserve's decision to start paring back its monetary stimulus and pushed the dollar to five-year peaks versus the yen earlier. The yen's losses against the dollar were compounded by a decision by the Bank of Japan (BoJ) to maintain its pledge of increasing base money in the financial system. The greenback also climbed to two-week peaks against both the euro and the Swiss franc.
"Investors are now settling into holiday ranges and we're seeing a pullback in the dollar a little bit, but this is not really significant," said Greg Moore, currency strategist, at TD Securities in Toronto. "The broad strong dollar trend is still intact." Data showed the U.S. economy grew at its fastest pace in almost two years in the third quarter while business spending was stronger than previously estimated. Gross domestic product grew at a 4.1 percent annual rate instead of the 3.6 percent pace reported earlier this month, the Commerce Department said in its third estimate on Friday. "The GDP report was consistent with an improving U.S. economy, validating the Fed's decision this week to taper stimulus by $10 billion," said Joe Manimbo, senior market analyst at Western Union Business Solutions in Washington.
In contrast to the Fed, the BoJ reaffirmed overnight it would keep monetary policy loose. Dollar bulls are now targeting a level around 105.25 yen, a 61.8 percent retracement of the dollar's fall from its 2007 high of 124.14 yen to its 2011 low of 75.31 yen. That’s approximately a development that we’ve suggested 2 weeks ago in our weekly research, dedicated to yen. This setup is still valid and we will watch over it in next year as well.
The greenback earlier gained against the euro, which was held back by S&P's decision to cut the European Union's supranational long-term rating to AA+ from AAA, citing rising tensions on budget negotiations. The euro, which has surprised many analysts and hedge fund managers by moving higher against the dollar since the summer, fell to $1.3623 , its lowest since Dec. 5. The common currency has been boosted in recent weeks by tightening monetary conditions in the euro zone as banks repay cheap borrowing to the European Central Bank. Next week banks will return 20.7 billion euros, the ECB said on Friday, which is above expectations and which will offer further support to the currency.
MORE FROM BOJ TO COME
Two-year U.S. yields rose from 0.34 percent to 0.3677 percent on Thursday, with the differential over Japanese two-year yields now at its highest since early October. On Friday, U.S. two-year yields were at 0.37 percent. The BoJ voted unanimously to keep its pledge of raising base money, or cash and deposits at the central bank, at an annual pace of 60 trillion yen to 70 trillion yen ($576 billion to $672 billion). BoJ Governor Haruhiko Kuroda said on Friday the correction in the yen's "excessive" strength had been positive for Japan's economy. Nearly two-thirds of Japanese companies expect the BOJ to ease further in the first six months of 2014, as it tries to achieve 2 percent inflation within two years, a Reuters poll showed earlier this month. The Australian dollar, meanwhile, was trading above a 3-1/2-year low hit after the Fed revealed its stimulus reduction plans. On Friday, The Aussie dollar last changed hands at US$0.8924 , up 0.7 percent on the day.
Standing around this euphoria with promising GDP numbers and QEIII tapering start, major questing is, whether 10 Bln is a lot or few? As breaking news just has been released, on next day there are a lot of forecasts have appeared that show the shedule of closing QE III, even totally by march 2014. And what if next contraction will be not very soon, say at the end of 2014? And what is 10Bln if 75 Bln still inflow on markets? Initial rush will start to fade if Fed will be slow with next step of contraction – all could return on its own. As we haven’t got any clear confirmation of reversal yet, I think that we should not haste with drastical conclusions, especially on EUR. On JPY – yes, there we have double impact as from Fed as from BoJ. And if even Fed will be indecisive, BoJ will make the rest and trend on JPY has better foundation than EUR.
Technical
On previous week our major concern was around recent EUR growth and we have needed to estimate, whether this growth was triggered only by ECB measures of liquidity contraction or, it has some stronger foundation. Now we see that either this move really was due ECB or recent US data and Fed has impacted on markets, but EUR has stopped its growth.
Generally speaking we still stand around determination point – at major monthly resistance 1.3775-1.3830 and previous swing high. And market has not done any drastical steps yet. From the one point of view, retracement after first hit of 0.618 target of AB-CD pattern was shy and that is perfect for bullish development, but from the another point of view – market was not able to pass through this target and stand on course to 1.44 area, but stuck in solid resistance. We know that 1.3775-1.3830 is very strong resistance area, including YPR1, and 5/8 Fib resistance. YPR1 has special meaning here – if price will move above it, it will significantly increase probability of further upward action in 2014. As end of the year is gradually approaching, market could sit in the range as investors will avoid strong trading activity. But conclusion here is simple – we either should see upward breakout and take long position, or some reversal pattern on weekly/daily chart and start to think about enter short. Right now market still stands on the edge here.
Weekly
Sometimes, guys, technical pictures shows very interesting setups, that could point on such resolving of the riddle that you never could suggest by yourself. And here we see rather tricky picture. So, we just have said that we need either breakout or reversal by some reversal pattern and depending on what we will get – we will take position, right? But what do we see here, on weekly chart? I ask you – does butterfly reversal pattern? Yes. But reversal points stand too high compares to our suggestion. We’ve suggested that market probably will fail to pass through current 1.38+ resistance and that should indicate it’s reversal. But what if market will show reversal by this butterfly? The reversal point agrees with the upward AB=CD target and stands around 1.44. This is also an area of 1.618 initial smaller AB-CD pattern (not shown here) Should we exclude this possibility? Well, currently I do not see any reasons to do this. Invalidation point of this butterfly is 1.2770s low. Major events will take place probably only in 2014 and next two canldes here could be small, market could turn to consolidation. But situation with upside potential is not done yet here.
In shorter-term perspective, we said previously that market has formed bullish dynamic pressure – take a look within a month market moves up, while trend holds bearish. Now trend has turned bullish and see – price has formed bullish stop grabber. This is not a stop grabber that I prefer to trade, but still, this is the pattern that suggests taking out of previous highs, as well, as dynamic pressure. As you can see situation is not as simple as it has seemed before, only on GDP=4,1% and QE tapering...
Daily
Appearing of bullish stop grabber on weekly was accompanied by appearing of high wave pattern here, on daily. Trend is bearish, market has shown a respect of daily K-support as we’ve suggested, but now it is interesting, what to expect next. High wave is neither bullish nor bearish by itself; it just indicates market indecision or indifference concerning current action. Thus, major direction will be estimated when market will take out either highs or lows of high wave pattern. Meantime, K-support area is rather wide and includes also major 3/8 Fib support level that has not been touched yet. Also WPS1 will also stand around it. So, the first development that we can suggest here is possible return right back down to wide support cluster, although I’m not sure that market will pass through it fast.
Taking broader view on current situation – we could get another butterfly here, guys. Right wing of it I have drawn already here. Daily trend is bearish here, and theoretically we should trade market in bearish direction. At the same time we have to take short-term trades and do not marry any position, since it is not obvious situation on higher time frames. May be some short-term downward continuation will follow as a result of initial bearish impulse, but maximum that we could take from it is next extension target, but not more, I suppose.
60-min
That’s what I’m talking about. On Friday market has shown reasonable upward retracement, as we’ve suggested. Price has not quite reached 50% level, but stuck in natural support/resistance zone. As downward impulse was solid, we can suggest appearing of AB-CD down here with minor extension at 1.36 level – that agrees with WPS1 and lower border of daily K-support. Currently we do not have possibility to choose and rely on more extended targets, since we do not have any extended patterns yet, that could point these targets for us. Later we will see what do next. At the same time I can’t exclude that we will run from one scalp target to another till the end of the year.
Conclusion:
Despite all positive USD data of previous week, action on EUR does not suggest yet total and final reversal. Price still coiling around edge point and currently chances exist as for upward breakout as for downward reversal. To rely on direction whatever it will be, we need to get clear patterns that could confirm it and point extended targets for us.
Until this will not happen, we probably will have to deal with scalp fast trades on daily chart and lower ones.
The technical portion of Sive's analysis owes a great deal to Joe DiNapoli's methods, and uses a number of Joe's proprietary indicators. Please note that Sive's analysis is his own view of the market and is not endorsed by Joe DiNapoli or any related companies.
") For me you are a hero and my trading idol...
For me you are a hero and my trading idol...
