FOREX PRO WEEKLY February 17-21, 2014

EurGbp possible DRPO Buy...???
eurgbp.jpg

NzdUsd posible Ed
nzdusd.jpg

UsdJpy bullish Abcd
usdjpy222.jpg
 
EurGbp possible DRPO Buy...???
View attachment 13413

NzdUsd posible Ed
View attachment 13414

UsdJpy bullish Abcd
View attachment 13415

Hi Lolly,
On EUR/GBP it is not quite DRPO, since it is too big difference between bottoms and first crossing of 3x3 was too deep. I suggest that market could form here some reversal pattern, may be it will be even H&S, but I wouldn't treat it as DRPO.
NZD - OK
JPY - yes, this is pattern that we're trading now. It's target stands in Agreement with weekly 5/8 Fib resistance and weekly B&B target.
 
Long-term resistance - great eurusd sell opportunity

...Conclusion:
On long-term charts price has started to show signs of upward continuation and it could point us direction for long period and extended targets...
Hi Sive Morten, thank you for great analysis...
As I see you don't use very simple and VERY powerfull forex tool in long-term trading named resistance/support trend lines described by Demark and others...
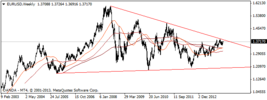
I proffer you to discuss with us chart below, showing clear trend lines with clear long-term trade opportunity:
.eurusdweekly.png...
As you see on this chart 12.27.13 eurusd already hit resistance 1.3893 (it was even 20-30 poins higher than I expected) and I sold it @ 1.3890...
Soon we'll have second opportunity to sell eurusd about 1.3820 with target 1.0000 - it will be right shoulder of H&S figure and second hit of drawn resistance... After this I expect very fast drop in eurusd, so my target 1.0000 can be reached in 1-2 year period...
What do you think?
P.S. if you will try to sell eurusd @ 1.3820 too - don't forget to place stop-loss @ 1.39 - clear brake of this level will indicate strong way to 1.6 level...
 
Last edited:
I have been subscribed to this thread for ages but never received anything like this before!? Is this just a 1 off posting from Lolly or have I missed lots of postings..?
 
Hi Sive Morten, thank you for great analysis...
As I see you don't use very simple and VERY powerfull forex tool in long-term trading named resistance/support trend lines described by Demark and others...
I proffer you to discuss with us chart below, showing clear trend lines with clear long-term trade opportunity:
As you see on this chart 12.27.13 eurusd already hit resistance 1.3893 (it was even 20-30 poins higher than I expected) and I sold it @ 1.3890...
Soon we'll have second opportunity to sell eurusd about 1.3820 with target 1.0000 - it will be right shoulder of H&S figure and second hit of drawn resistance... After this I expect very fast drop in eurusd, so my target 1.0000 can be reached in 1-2 year period...
What do you think?
P.S. if you will try to sell eurusd @ 1.3820 too - don't forget to place stop-loss @ 1.39 - clear brake of this level will indicate strong way to 1.6 level...

I have no objection on this scenario. Our long term analysis of Dollar Index that we've made in Nov 2011 also suggests significant dollar strength in long term. But since we mostly trade here short-term we have to focus on much closer perspectives and try to catch issues that could be useful on next coming week.

I have been subscribed to this thread for ages but never received anything like this before!? Is this just a 1 off posting from Lolly or have I missed lots of postings..?
No, this is alternative analysis - the stuff that I call you to do and post here. Since this forum part is for education.
 
Our Monday plan for buying BgpUsd
x1.jpg

Possible UsdChf bullish pattern
x2.jpg

Possible HnS AudCad
audcad hns.jpg
 
Last edited:
Back
Top