Sive Morten
Special Consultant to the FPA
- Messages
- 18,699
Fundamentals
Reuters reports U.S. dollar and the euro gained a little ground against the Swiss franc on Friday, a day after the Swiss National Bank shocked markets by scrapping a currency cap, while the dollar hit new multi-year highs against the euro on expected European Central Bank easing.
The euro suffered its biggest-ever one-day fall against the franc on Thursday, dropping more than 18 percent, after the SNB stunned markets by scrapping its three-year-old pledge to limit the franc's value to 1.20 per euro.
Volatility lingered and liquidity in franc trading was low as investors grappled with the SNB's move, analysts said.
"Traders don't know what the new equilibrium price is on the Swiss franc," said Greg Anderson, global head of FX strategy at BMO Capital Markets in New York.
The dollar last traded at 0.85670 franc , up 2.1 percent on the day but still about 16 percent below where it was before the cap was scrapped. Thursday's sharp acceleration in the franc resulted in the currency's first weekly gain against the dollar since early December.
Dealers speculated the Swiss had moved because they knew the ECB would take the plunge into full-scale quantitative easing, effectively printing hundreds of billions of euros, at its next policy meeting on Jan. 22.
The view that the SNB move was a sign the ECB would announce outright money-printing in an effort to combat deflation in the euro zone drove the euro to a fresh 11-year low against the dollar of $1.14595 on Friday. The euro was last down 0.6 percent to trade slightly up from the 11-year low, at $1.15635.
"It seems that an ECB QE program is imminent," said Thierry Albert Wizman, global interest rates and currencies strategist at Macquarie Ltd in New York.
Goldman Sachs cut its long-term forecasts for the euro on Friday, unrelated to the payrolls data. It expects the euro to fall to $1.14 in three months, $1.11 by June and $1.08 by year-end. But it also expects euro parity with the dollar by the end of 2017.
CFTC data shows increasing of open interest and faster growth on short position. Right now speculative shorts stand for 215’425 contracts vs. longs 48’192. Thus, our ratio stands at 81,71% and gradually approaches to crucial numbers when market will need some pause or pullback to reduce this number.
Open interest:
 Shorts:
 Longs:

Recently guys, we’ve put our thoughts on SNB action. We think that major reason stands beyond European QE. QE is just small add-on but not major factor. To better understand what really has happened we need to take a look at Switzerland economy. Economy stands near recession, struggles with deflation, SNB reduces rates and right now it stands at -0.75%. To understand what usually country does in this kind of situation – take a look at Japan. Here we see massive government spending and lending programs, massive easing program and steps of stimulation of consumption and spending. Significant steps to stimulate inflation and reduce the value of national currency to pump export.
But the trick is Switzerland stands in the same situation – export oriented country falls in recession but what they do – increase the value of franc for 30% to USD and 20% to EUR. Why? What for? My college has spent Xmas time in Switzerland and brought me a present – Swiss “Lindt” chocolate sweets. Small box costs around 11 francs! Even in Russia I can buy the same sweets cheaper in German “Metro” store.
So, we were able to find only one explanation of this SNB step. They intend to buy something. This is single logical explanation why SNB took this step in current economic conditions. And we suspect that this “something” will be gold.
As you know among other events we’re tracking geopolitical situation and try to catch some relations that we see there. Of cause, geopolicy is most blur sphere of international relations and nobody could say definitely what is really going on. But still, we think that situation in Ukraine, terrorist attack in France and across the Europe, crude oil prices, gold and SNB action is the part of the same chain.
If you will monitor, say, Germany newspapers and recent media you’ll see that Ukraine almost totally disappeared from major news. As we’ve mentioned previously shooting in France has happened when Hollande gave hints on warming relations with Russia.
Recently NATO Stoltenberg has come to Germany trying to get additional financing and frighten Europe with “Russian menace”. He treads that US right now has contracted possibilities while Germany and France are rather rich and they could do much more for NATO. Otherwise they will be one-on-one with dreadful Putin. The major background for this “speech” was September conference when NATO members have decided to increase spending to 2% of GDP of each member.
But what result of this meeting, I mean recent visit of Stoltenberg… Germany said “nein”. But you may ask what about G7 meeting, Russia was not invited, what about sanctions prolongation etc… We would say that we should take in consideration not speeches but deeds and facts:
Merkel has banned on the use of nuclear energy to generate electricity, which she has pushed despite the resistance of the industry, putting the economy heavily dependent on Russian gas, the failure to increase investment in the defense industry, failure of Ukraine in the financial assistance and other moments. Second, recently F. Mogherini hints on reducing of sanctions that comes opposite to US line:
Sanktionen: EU-Außenbeauftragte will auf Russland zugehen | ZEIT ONLINE
Finally, as for the Germans themselves, colleagues, and politicians, and in "smoking rooms", very often you can hear talk openly - Putin is the only person who can help us save our traditional values.
Anyway, now we can try to collect puzzle. It is obvious that EU attitude to situation is changing and it becomes healthier. This comes in contradiction with US policy who tries to keep globe dominant power as economical as political. Gradually world starts to doubt real reliability and safety of US dollar and US has applied unprecedented steps to keep it. Subprime crisis in 2008, mass wars across the Globe to spread instability and sow chaos across the planet, to convince global financial society that only US dollar worthy to be an absolute protection again globe turmoil. Then drop in crude oil price and gold should prove that US dollar is strong and expensive. Right now nobody has any doubts that crude oil drives not by economical law of demand and supply.
When they saw that Europe is trying to be on her own mind – they start to frighten it, triggering terror, hinting that it will become worse if you will continue this line. Right in this moment war in Ukraine has activated again and turns to hot stage. And right now SNB cancels the cap… and gold shows unprecedented rally. This is the part of the same chain. SNB decision looks negative for US, especially if they will start to buy gold… Franc now becomes a rival for US dollar. Franc is not yen, because Japan totally depends on US export, keeps huge volumes of US debt and now applies mass money printing. Other words, yen stability is based on US stability. CHF is a quite another tune.
There is a rumor on the market that US keeps gold price low by selling its own gold storages. Nobody knows any details, and to be honest I have real doubts on this, but this is what I’ve heard on the markets. Still it does not seem as absolutely impossible.
As Europe still stands on its way to make its own policy and try to become real member of geopolitical game – US will continue somehow to press on it. Thus, we can’t exclude some bad events in EU of any type – either economical, may be again some social turmoil that we already see. Besides, 25th of January Greece will take voting on its future.
In economy sphere we mostly watch for two major events – details on ECB QE that should be announced on 22nd of January, second – impact of Fed rate policy on EUR. The major concern here how EUR will behave in this whitewater of financial events and Greece voting on 25th of January.
Probably we need to explain a bit. At first glance it seems all simple – US will start rise rate and hence EUR should fall even deeper. But this is not quite so. We suspect that this will be true only till the moment of first rate hiking by Fed. We suspect that starting of QE program by ECB will attract a lot of investors who will want to make easy money. As US experience of QE shows, real Central Bank money mostly was put in equities but not in long-term loans of real industrial sector, population, manufacturing and etc. This has led to huge bubble on US equities. We suspect that something of this sort could appear on EU equities. Initially it will be gradual. But as soon as Fed will start to increase rates capital will start to flow to EU. As amount of money will increase this will lead to additional demand on EUR and here drop of EUR could stop, or at least will loose its pace, despite opposite courses in rate policy…
Currently it is very difficult to predict how definitely this will happen; we just mention common view on this situation. But what we do know that this will not be as simple as “US rising rates while EU not, hence USD will dominate over EUR”.
Technicals
Monthly
So, January becomes really hot for EUR. Last week we saw solid plunge due many reasons. Although that we’ve thought that it would be “long-term” targets, but EUR has reached next one very fast. EUR has passed 50% support and Agreement without any respect. This just tells how market weak is. Next target stands at 1.11-1.12 area. It includes AB=CD target, Butterfly extension, major 5/8 Fib level.
Right now market stands at another important support area – Yearly Pivot support 1. Let’s see whether we will get any bounce here… Since this chart stands in tight relation with dollar index, and dollar index already has hit AB=CD and butterfly target. Still, on previous week it has not shown any solid action and it looks like DXY “waits” when EUR will catch it up. Also recent thrust on monthly chart becomes suitable for DiNapoli directional patterns… and YPP has not been tested yet.
Weekly
Last week we’ve discussed chances on appearing bullish patterns around MPS1 @ 1.20-1.21 area and 1.15 area was our second extended target. But EUR has shown so fast drop that we’ve got it at 1.15 right now. We even do not have any monthly pivots on the chart because EUR has broken all of them. Thus, right now EUR at YPS1, 1.27 extension of previous upside swing and weekly oversold. It is interesting whether we will get any reaction here…
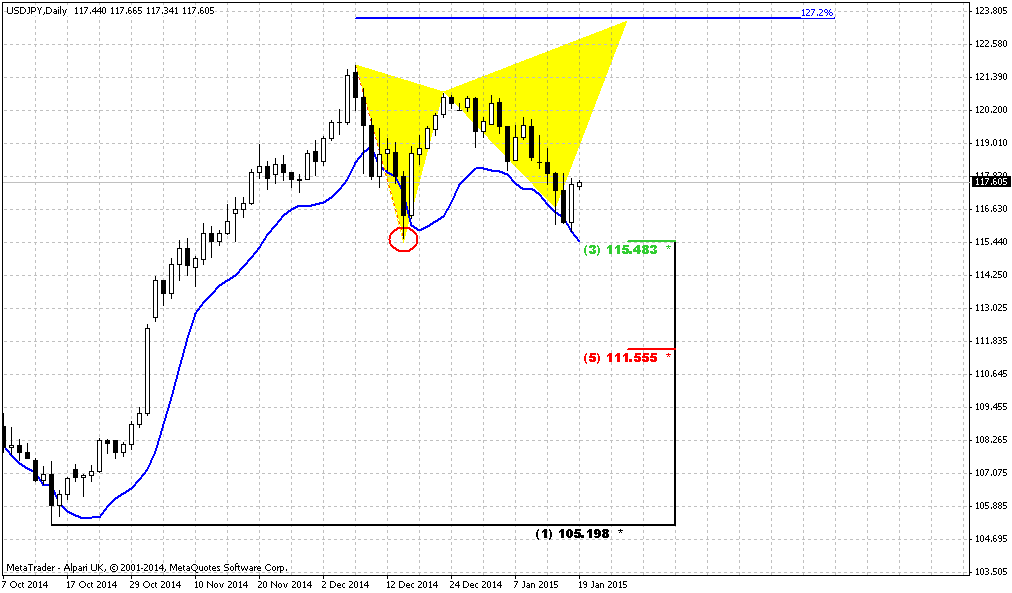
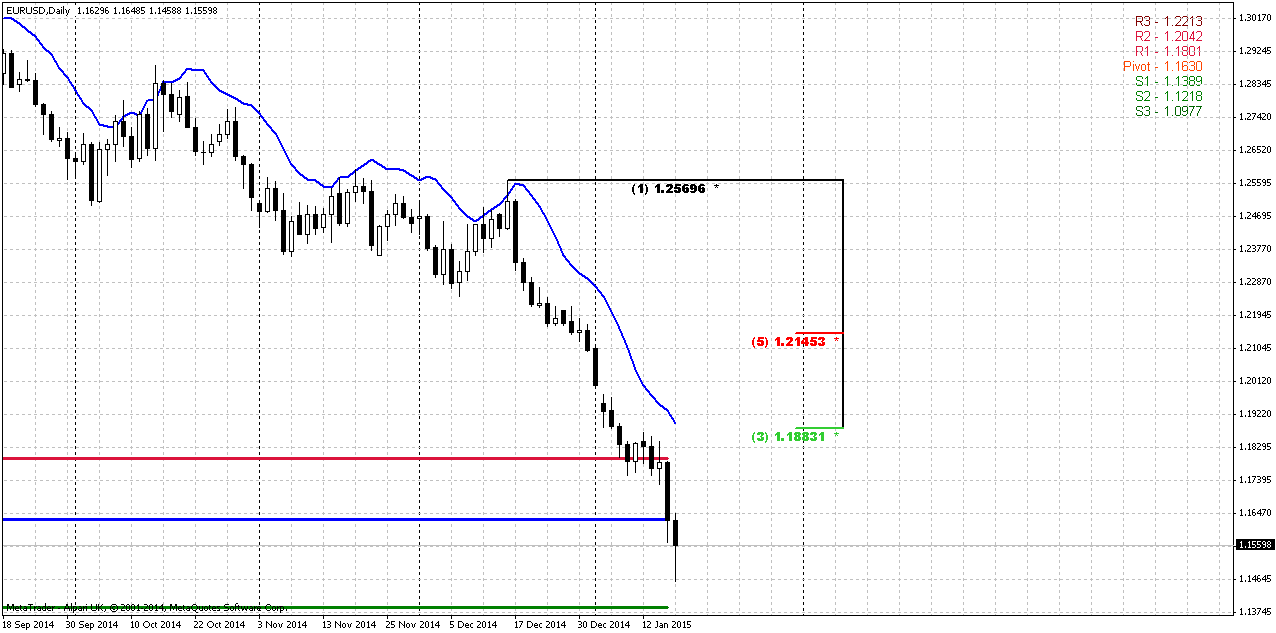
Daily
Here we do not have any patterns that could hint on reversal. Trend is obviously bearish and yes, EUR stands at daily oversold as well. Still long shadow of Friday session shows that market starts to feel monthly support. All that we see here is thrust. Thus probably any bounce that could happen here will be based on some DiNapoli pattern – either DRPO or B&B. B&B seems more logical, because EUR is not overbought at monthly and major targets stand 300 pips lower. Anyway, if even it will be DRPO – hardly market will be able to move higher than 1.18-1.19 area – combination of WPR1, Fib level and daily overbought. Retracement could become even shyer, if EUR will reach WPS1 first. In this case it could, for example, just test WPP and continue move down. The only hope of higher retracement stands in relation to ECB speech, if QE will be as not radical as market expects, or on Greece voting, but this will happen not on coming week.
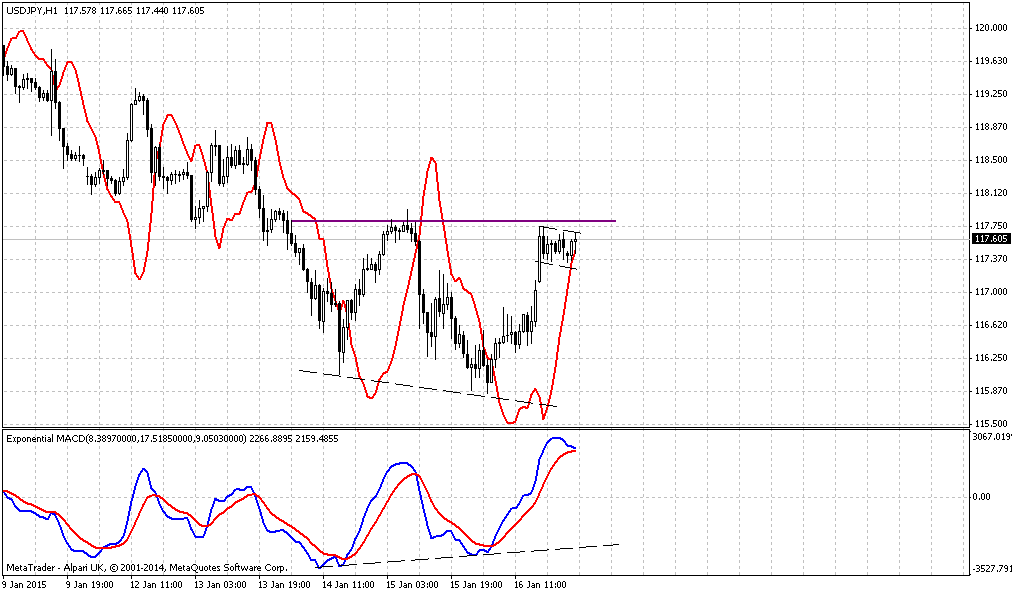
Intraday charts
On Intraday charts, guys, we do not see anything interesting yet. Market moves so fast that has not formed yet any patterns that could be treated as response on support area. Let’s see, may be we will get something later in the week.
Conclusion:
In 2015 it will be interesting to watch on EUR, since overall situation around EU as political as economical is very sophisticated and potentially in carries a lot of opportunities.
In long-term perspective we will be watching for patterns and events that we’ve mentioned in “Monthly” part of our analysis.
In short-term we mostly wonder, whether market will response on current support and will we get some retracement before market will start move to next target…
The technical portion of Sive's analysis owes a great deal to Joe DiNapoli's methods, and uses a number of Joe's proprietary indicators. Please note that Sive's analysis is his own view of the market and is not endorsed by Joe DiNapoli or any related companies.
Reuters reports U.S. dollar and the euro gained a little ground against the Swiss franc on Friday, a day after the Swiss National Bank shocked markets by scrapping a currency cap, while the dollar hit new multi-year highs against the euro on expected European Central Bank easing.
The euro suffered its biggest-ever one-day fall against the franc on Thursday, dropping more than 18 percent, after the SNB stunned markets by scrapping its three-year-old pledge to limit the franc's value to 1.20 per euro.
Volatility lingered and liquidity in franc trading was low as investors grappled with the SNB's move, analysts said.
"Traders don't know what the new equilibrium price is on the Swiss franc," said Greg Anderson, global head of FX strategy at BMO Capital Markets in New York.
The dollar last traded at 0.85670 franc , up 2.1 percent on the day but still about 16 percent below where it was before the cap was scrapped. Thursday's sharp acceleration in the franc resulted in the currency's first weekly gain against the dollar since early December.
Dealers speculated the Swiss had moved because they knew the ECB would take the plunge into full-scale quantitative easing, effectively printing hundreds of billions of euros, at its next policy meeting on Jan. 22.
The view that the SNB move was a sign the ECB would announce outright money-printing in an effort to combat deflation in the euro zone drove the euro to a fresh 11-year low against the dollar of $1.14595 on Friday. The euro was last down 0.6 percent to trade slightly up from the 11-year low, at $1.15635.
"It seems that an ECB QE program is imminent," said Thierry Albert Wizman, global interest rates and currencies strategist at Macquarie Ltd in New York.
Goldman Sachs cut its long-term forecasts for the euro on Friday, unrelated to the payrolls data. It expects the euro to fall to $1.14 in three months, $1.11 by June and $1.08 by year-end. But it also expects euro parity with the dollar by the end of 2017.
CFTC data shows increasing of open interest and faster growth on short position. Right now speculative shorts stand for 215’425 contracts vs. longs 48’192. Thus, our ratio stands at 81,71% and gradually approaches to crucial numbers when market will need some pause or pullback to reduce this number.
Open interest:
Recently guys, we’ve put our thoughts on SNB action. We think that major reason stands beyond European QE. QE is just small add-on but not major factor. To better understand what really has happened we need to take a look at Switzerland economy. Economy stands near recession, struggles with deflation, SNB reduces rates and right now it stands at -0.75%. To understand what usually country does in this kind of situation – take a look at Japan. Here we see massive government spending and lending programs, massive easing program and steps of stimulation of consumption and spending. Significant steps to stimulate inflation and reduce the value of national currency to pump export.
But the trick is Switzerland stands in the same situation – export oriented country falls in recession but what they do – increase the value of franc for 30% to USD and 20% to EUR. Why? What for? My college has spent Xmas time in Switzerland and brought me a present – Swiss “Lindt” chocolate sweets. Small box costs around 11 francs! Even in Russia I can buy the same sweets cheaper in German “Metro” store.
So, we were able to find only one explanation of this SNB step. They intend to buy something. This is single logical explanation why SNB took this step in current economic conditions. And we suspect that this “something” will be gold.
As you know among other events we’re tracking geopolitical situation and try to catch some relations that we see there. Of cause, geopolicy is most blur sphere of international relations and nobody could say definitely what is really going on. But still, we think that situation in Ukraine, terrorist attack in France and across the Europe, crude oil prices, gold and SNB action is the part of the same chain.
If you will monitor, say, Germany newspapers and recent media you’ll see that Ukraine almost totally disappeared from major news. As we’ve mentioned previously shooting in France has happened when Hollande gave hints on warming relations with Russia.
Recently NATO Stoltenberg has come to Germany trying to get additional financing and frighten Europe with “Russian menace”. He treads that US right now has contracted possibilities while Germany and France are rather rich and they could do much more for NATO. Otherwise they will be one-on-one with dreadful Putin. The major background for this “speech” was September conference when NATO members have decided to increase spending to 2% of GDP of each member.
But what result of this meeting, I mean recent visit of Stoltenberg… Germany said “nein”. But you may ask what about G7 meeting, Russia was not invited, what about sanctions prolongation etc… We would say that we should take in consideration not speeches but deeds and facts:
Merkel has banned on the use of nuclear energy to generate electricity, which she has pushed despite the resistance of the industry, putting the economy heavily dependent on Russian gas, the failure to increase investment in the defense industry, failure of Ukraine in the financial assistance and other moments. Second, recently F. Mogherini hints on reducing of sanctions that comes opposite to US line:
Sanktionen: EU-Außenbeauftragte will auf Russland zugehen | ZEIT ONLINE
Finally, as for the Germans themselves, colleagues, and politicians, and in "smoking rooms", very often you can hear talk openly - Putin is the only person who can help us save our traditional values.
Anyway, now we can try to collect puzzle. It is obvious that EU attitude to situation is changing and it becomes healthier. This comes in contradiction with US policy who tries to keep globe dominant power as economical as political. Gradually world starts to doubt real reliability and safety of US dollar and US has applied unprecedented steps to keep it. Subprime crisis in 2008, mass wars across the Globe to spread instability and sow chaos across the planet, to convince global financial society that only US dollar worthy to be an absolute protection again globe turmoil. Then drop in crude oil price and gold should prove that US dollar is strong and expensive. Right now nobody has any doubts that crude oil drives not by economical law of demand and supply.
When they saw that Europe is trying to be on her own mind – they start to frighten it, triggering terror, hinting that it will become worse if you will continue this line. Right in this moment war in Ukraine has activated again and turns to hot stage. And right now SNB cancels the cap… and gold shows unprecedented rally. This is the part of the same chain. SNB decision looks negative for US, especially if they will start to buy gold… Franc now becomes a rival for US dollar. Franc is not yen, because Japan totally depends on US export, keeps huge volumes of US debt and now applies mass money printing. Other words, yen stability is based on US stability. CHF is a quite another tune.
There is a rumor on the market that US keeps gold price low by selling its own gold storages. Nobody knows any details, and to be honest I have real doubts on this, but this is what I’ve heard on the markets. Still it does not seem as absolutely impossible.
As Europe still stands on its way to make its own policy and try to become real member of geopolitical game – US will continue somehow to press on it. Thus, we can’t exclude some bad events in EU of any type – either economical, may be again some social turmoil that we already see. Besides, 25th of January Greece will take voting on its future.
In economy sphere we mostly watch for two major events – details on ECB QE that should be announced on 22nd of January, second – impact of Fed rate policy on EUR. The major concern here how EUR will behave in this whitewater of financial events and Greece voting on 25th of January.
Probably we need to explain a bit. At first glance it seems all simple – US will start rise rate and hence EUR should fall even deeper. But this is not quite so. We suspect that this will be true only till the moment of first rate hiking by Fed. We suspect that starting of QE program by ECB will attract a lot of investors who will want to make easy money. As US experience of QE shows, real Central Bank money mostly was put in equities but not in long-term loans of real industrial sector, population, manufacturing and etc. This has led to huge bubble on US equities. We suspect that something of this sort could appear on EU equities. Initially it will be gradual. But as soon as Fed will start to increase rates capital will start to flow to EU. As amount of money will increase this will lead to additional demand on EUR and here drop of EUR could stop, or at least will loose its pace, despite opposite courses in rate policy…
Currently it is very difficult to predict how definitely this will happen; we just mention common view on this situation. But what we do know that this will not be as simple as “US rising rates while EU not, hence USD will dominate over EUR”.
Technicals
Monthly
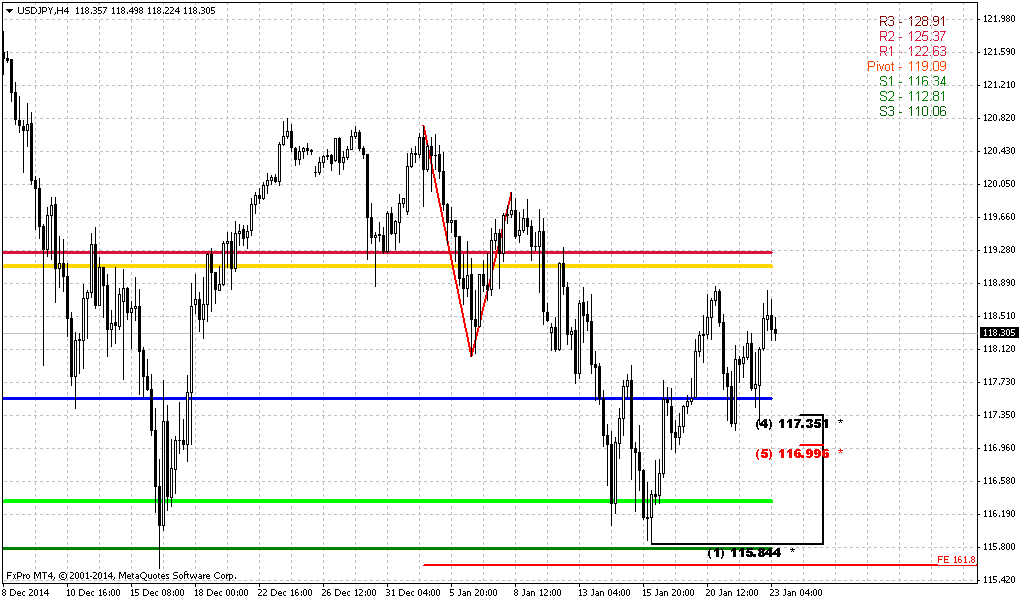
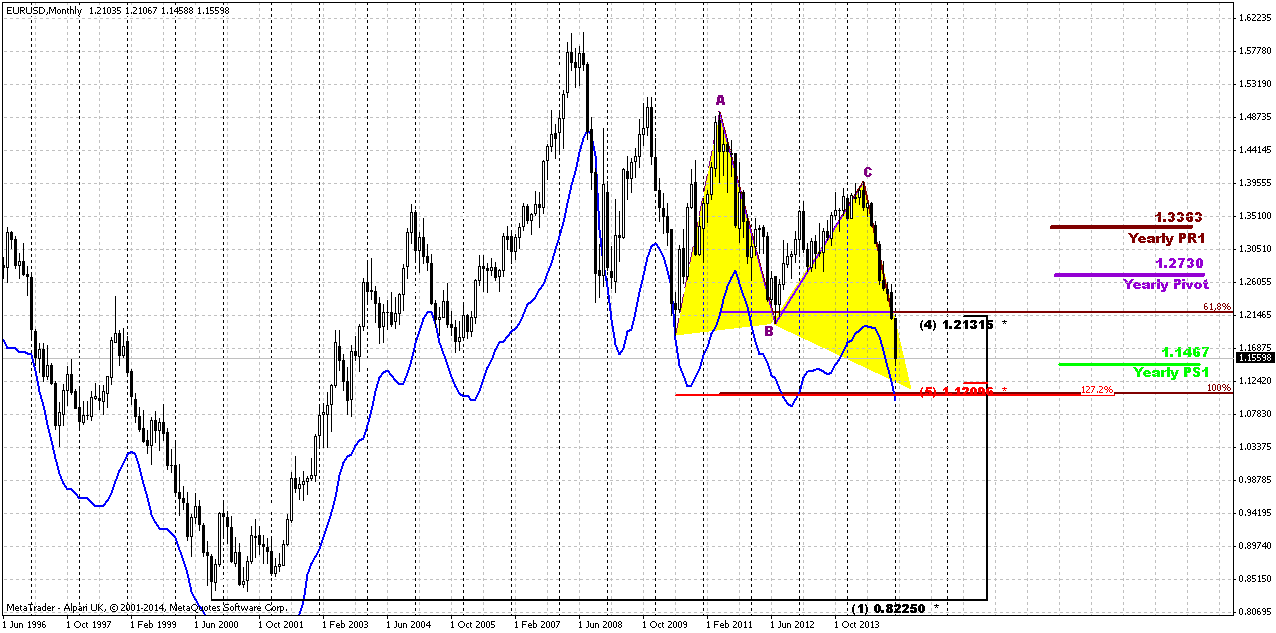
So, January becomes really hot for EUR. Last week we saw solid plunge due many reasons. Although that we’ve thought that it would be “long-term” targets, but EUR has reached next one very fast. EUR has passed 50% support and Agreement without any respect. This just tells how market weak is. Next target stands at 1.11-1.12 area. It includes AB=CD target, Butterfly extension, major 5/8 Fib level.
Right now market stands at another important support area – Yearly Pivot support 1. Let’s see whether we will get any bounce here… Since this chart stands in tight relation with dollar index, and dollar index already has hit AB=CD and butterfly target. Still, on previous week it has not shown any solid action and it looks like DXY “waits” when EUR will catch it up. Also recent thrust on monthly chart becomes suitable for DiNapoli directional patterns… and YPP has not been tested yet.
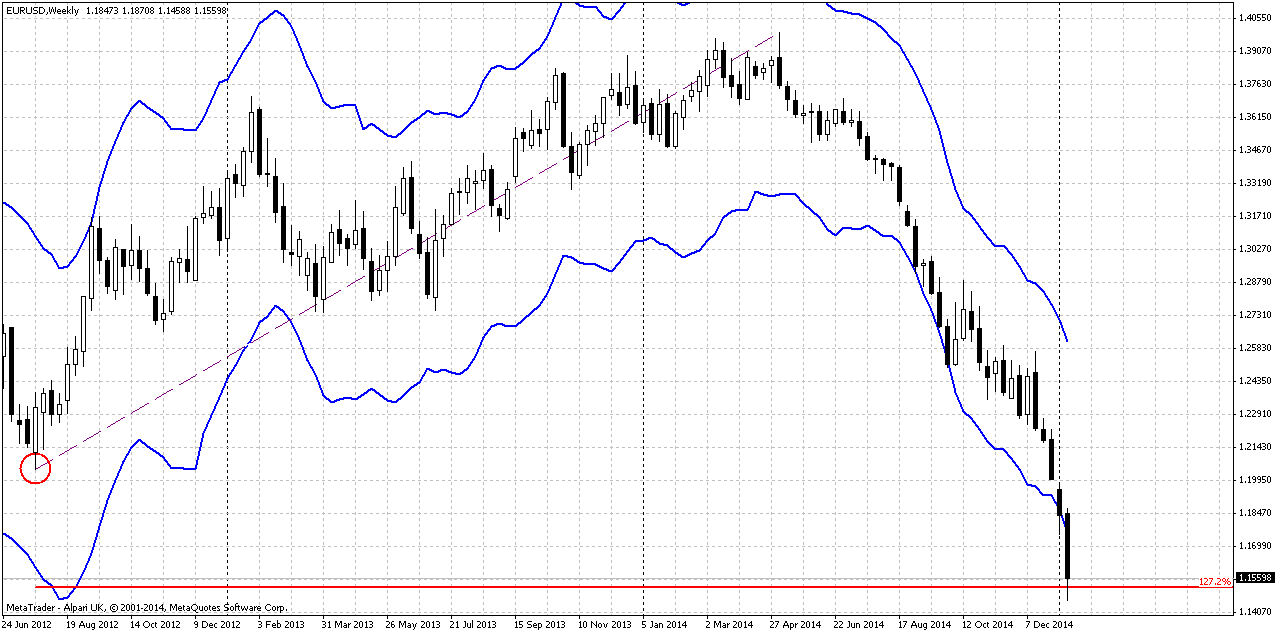
Weekly
Last week we’ve discussed chances on appearing bullish patterns around MPS1 @ 1.20-1.21 area and 1.15 area was our second extended target. But EUR has shown so fast drop that we’ve got it at 1.15 right now. We even do not have any monthly pivots on the chart because EUR has broken all of them. Thus, right now EUR at YPS1, 1.27 extension of previous upside swing and weekly oversold. It is interesting whether we will get any reaction here…
Daily
Here we do not have any patterns that could hint on reversal. Trend is obviously bearish and yes, EUR stands at daily oversold as well. Still long shadow of Friday session shows that market starts to feel monthly support. All that we see here is thrust. Thus probably any bounce that could happen here will be based on some DiNapoli pattern – either DRPO or B&B. B&B seems more logical, because EUR is not overbought at monthly and major targets stand 300 pips lower. Anyway, if even it will be DRPO – hardly market will be able to move higher than 1.18-1.19 area – combination of WPR1, Fib level and daily overbought. Retracement could become even shyer, if EUR will reach WPS1 first. In this case it could, for example, just test WPP and continue move down. The only hope of higher retracement stands in relation to ECB speech, if QE will be as not radical as market expects, or on Greece voting, but this will happen not on coming week.
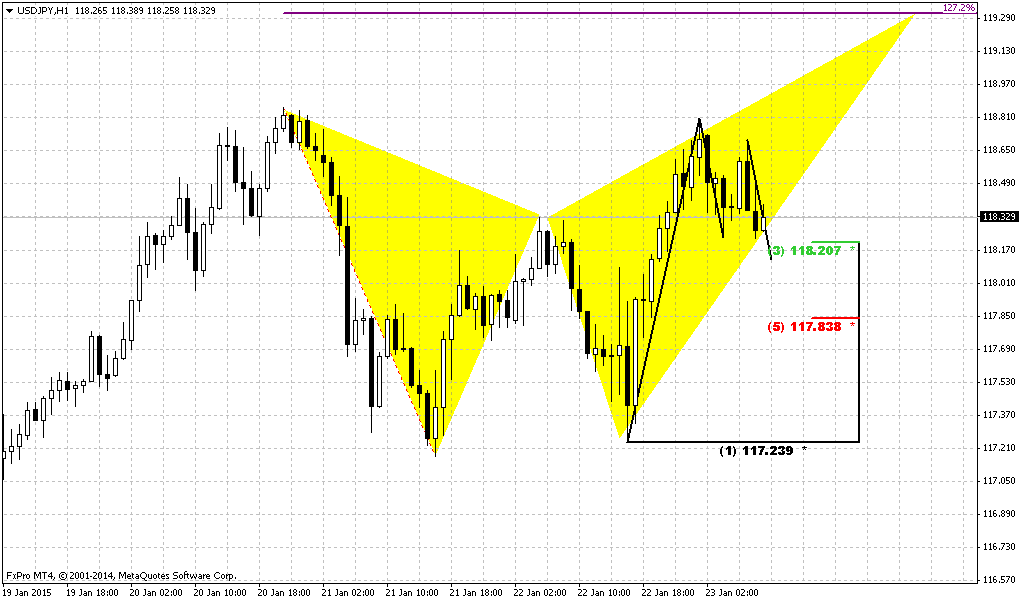
Intraday charts
On Intraday charts, guys, we do not see anything interesting yet. Market moves so fast that has not formed yet any patterns that could be treated as response on support area. Let’s see, may be we will get something later in the week.
Conclusion:
In 2015 it will be interesting to watch on EUR, since overall situation around EU as political as economical is very sophisticated and potentially in carries a lot of opportunities.
In long-term perspective we will be watching for patterns and events that we’ve mentioned in “Monthly” part of our analysis.
In short-term we mostly wonder, whether market will response on current support and will we get some retracement before market will start move to next target…
The technical portion of Sive's analysis owes a great deal to Joe DiNapoli's methods, and uses a number of Joe's proprietary indicators. Please note that Sive's analysis is his own view of the market and is not endorsed by Joe DiNapoli or any related companies.