Sive Morten
Special Consultant to the FPA
- Messages
- 18,690
Monthly
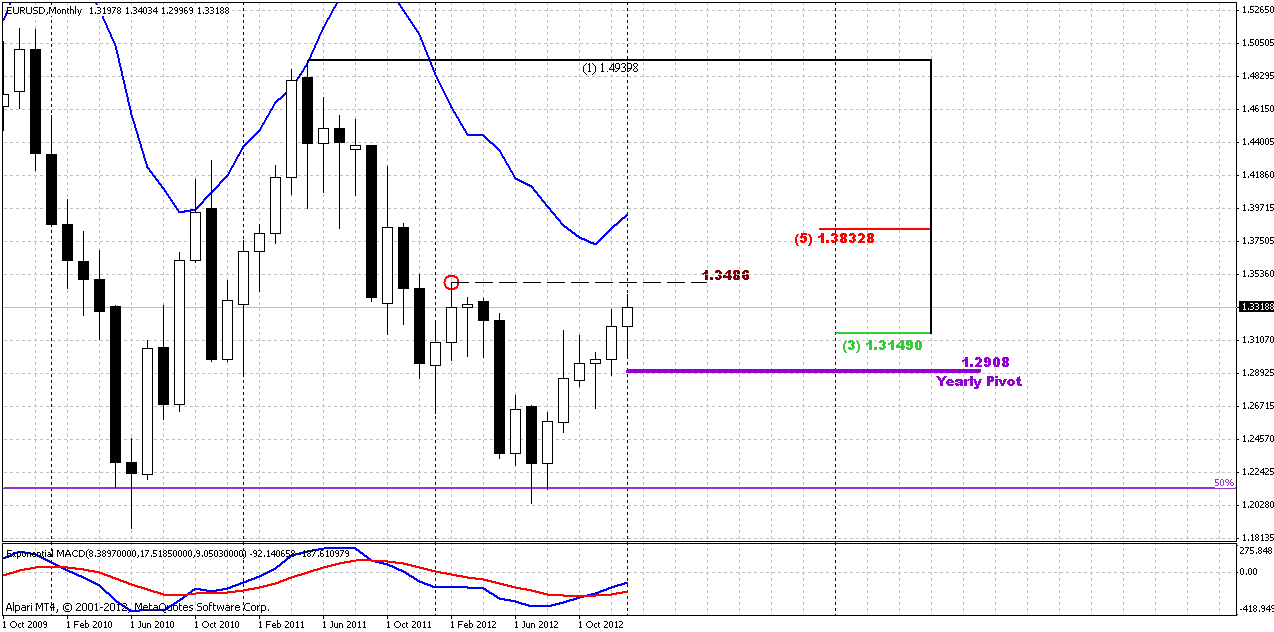
Currently monthly chart carries nothing new compares to previous week. Trend holds bullish and price has no barriers ahead – next resistance level is 1.3834 and monthly overbought. At the same time we have to pay attention to 1.3486 level. This level is significant by two reasons. It coincides with 50% resistance and second - this level is a kind of quality test for current upward move, since this is a high of most recent swing down. We know that when market forms swing up that is greater than previous swing down – this might be an indication of reversal. Particularly by that mean – 1.3486 is significant. That is what about current swing up...
Generally speaking upward move looks not as impressive as previous one in 2010. Currently we do not see any explosive thrusts, long candles – just gradual, calm and choppy move. It looks more like just a retracement rather reversal and new upside trend. You may appeal to MACD trend, since it’s bullish, however price has not formed higher high yet – usual feature of uptrend. Hence, we still in kind of limbo here.
Weekly
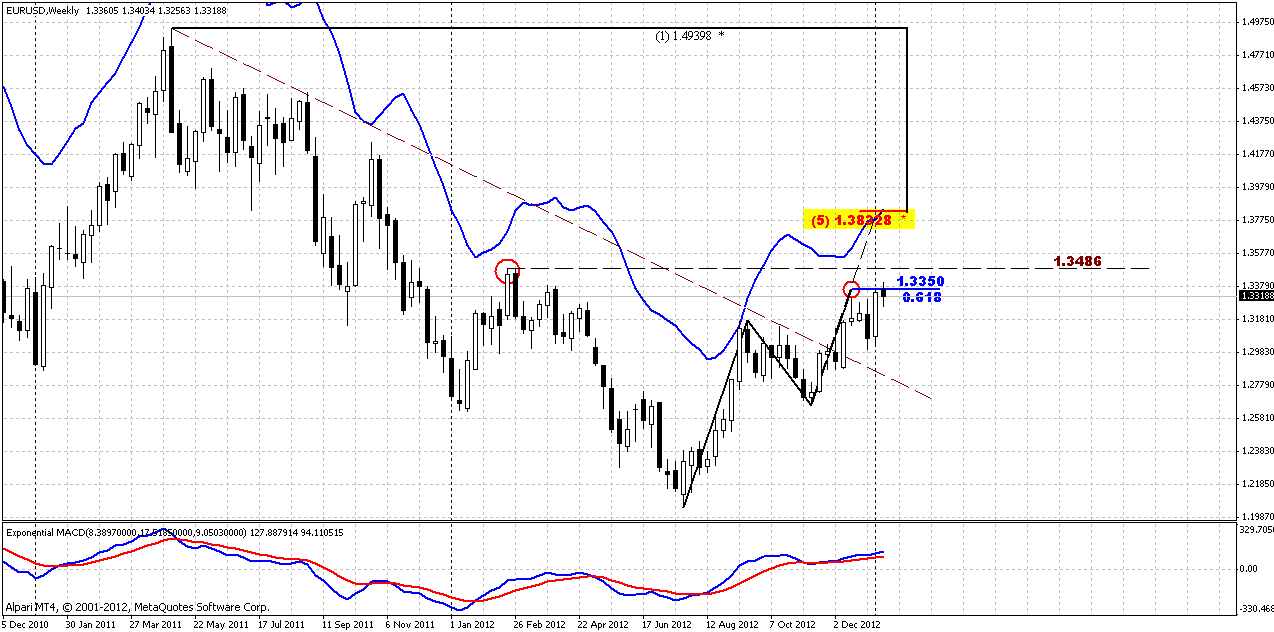
So, previous week had relatively tight range, but still there was a significant moment – market has touched 0.618 target of AB=CD pattern and MPR1. In fact, any pullback from here will be reasonable, until it will be small. Theoretically, as we’ve said above, next resistance area is 1.3486, but it will catch AB=CD development between 0.618 and 1.0 targets. I do not know, how market will deal with it. Ultimately, we have strong resistance around major 5/8 Fib level that as we can see now – is weekly Agreement and overbought as well. All these moments are correct, but we’ve discussed already some suspicions in weekly analysis, and here I do not like couple of moments. First is – slow CD leg that is a bit curious, especially when BC leg is just 0.382 retracement.
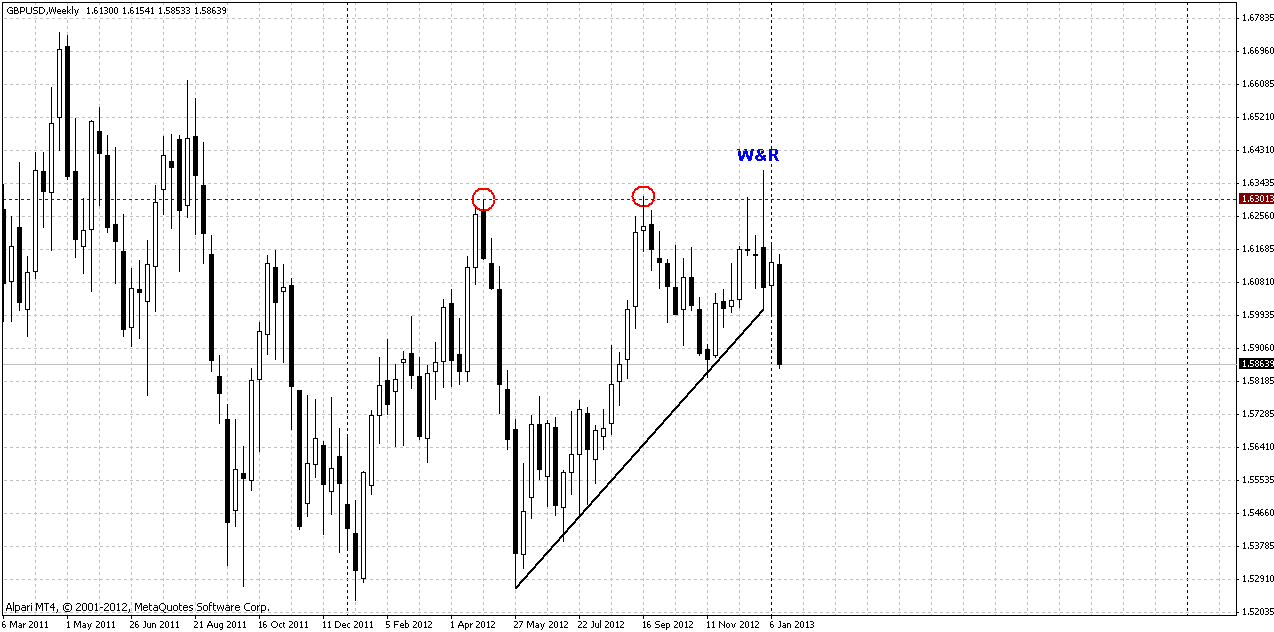
Second – take a look at weekly GBP chart – very bearish price action. Trend has turned bearish, W&R and breakout of support line. Reasonable argument that GBP and EUR are not the same, still such divergence with congener currency should not be unconsidered.
Current growth on EUR looks a bit artificial, because fundamentally I do not see many outclass points in favor of EU, statistics is poor, no turning solutions on crisis. Is the only thing that could fed it – fiscall cliff? That’s very precarious foundation... I don’t want to say that this growth will not continue, but not all so clear as I want it to see.
Daily
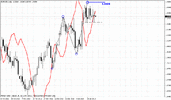
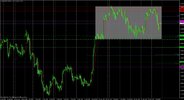
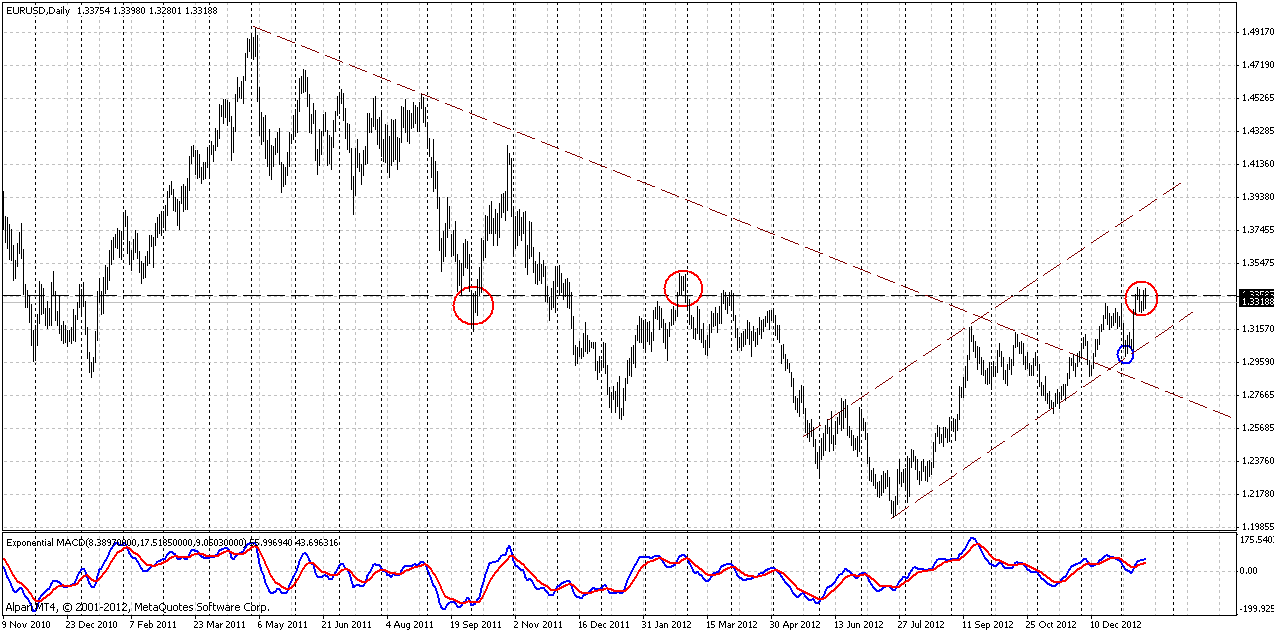
In the beginning of daily view, I would like to take a look at contracted daily chart. It carries nothing new – just lets us a bit clearer understand big picture. We see that upward channel has dominated and market has broken long-term bear trend. We have significant tradable low in blue circle, since it holds upward channel. Still, now market has reached long-term natural resistance line. To get the confidence with bullish intentions we need some confirmation – upward breakout above 1.3480-1.35 area. In this case weekly AB=CD will hold and next level is 1.3833.
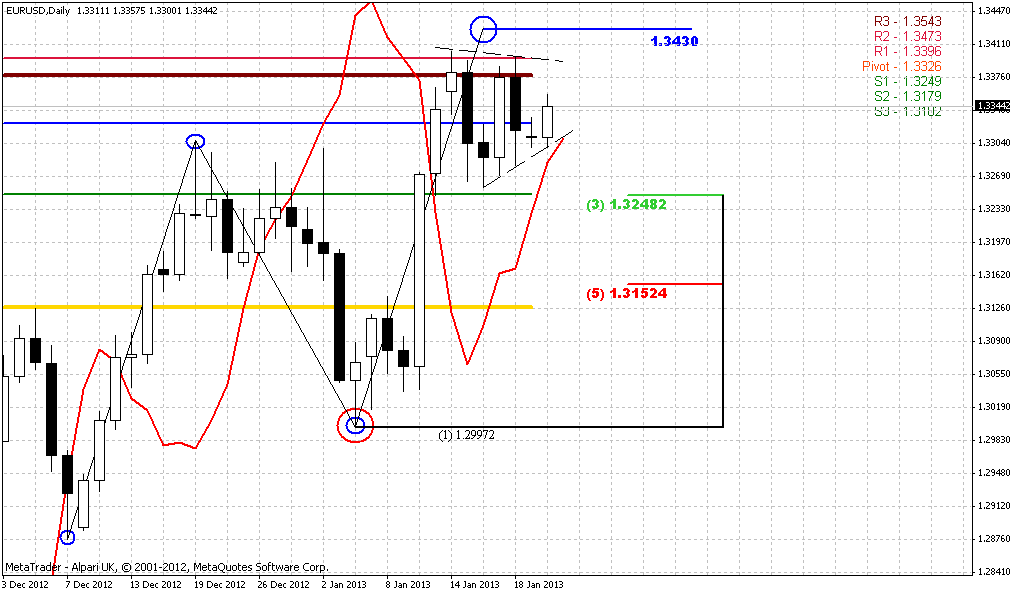
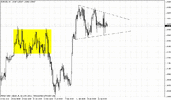
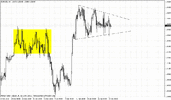
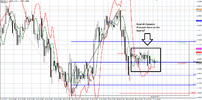
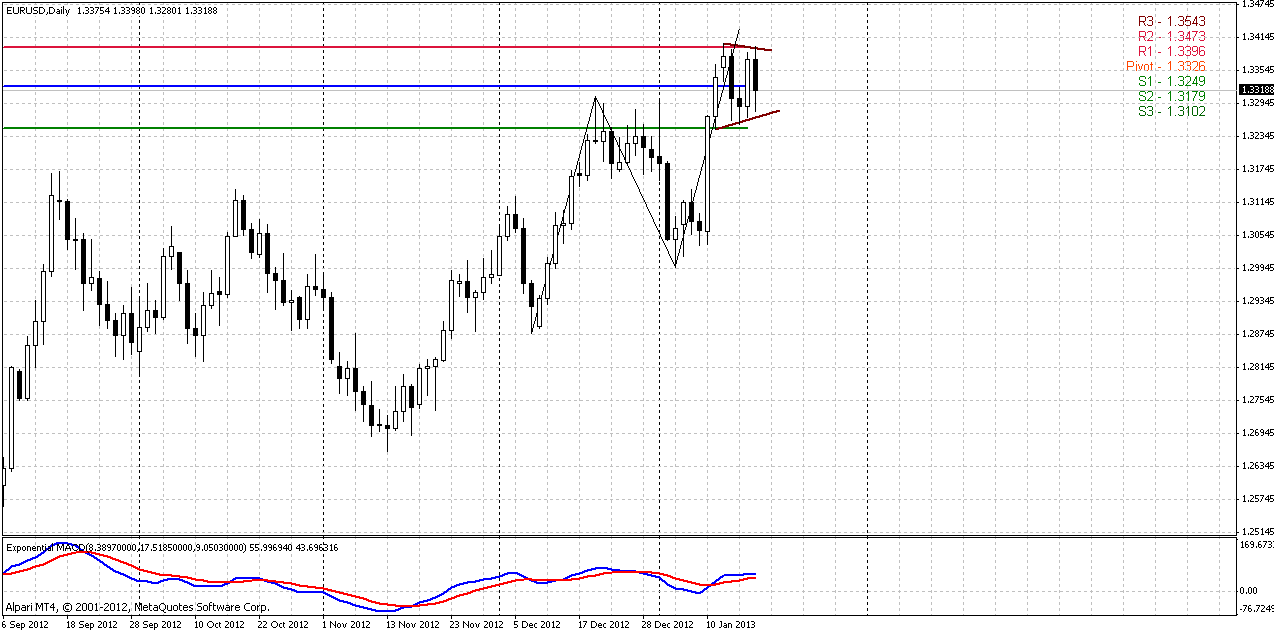
Shorter chart shows that market is coiling under solid resistance, recent AB=CD has not been completed – our Friday’s suspicions have panned out. Now price action reminds pennant. On coming week we could get great assistance from pivots. Take a look – market will open right around WPP and upper and lower borders coincide with WPR1 and WPS1 correspondingly. Unfortunately I can’t extract more from daily time frame.
4-hour
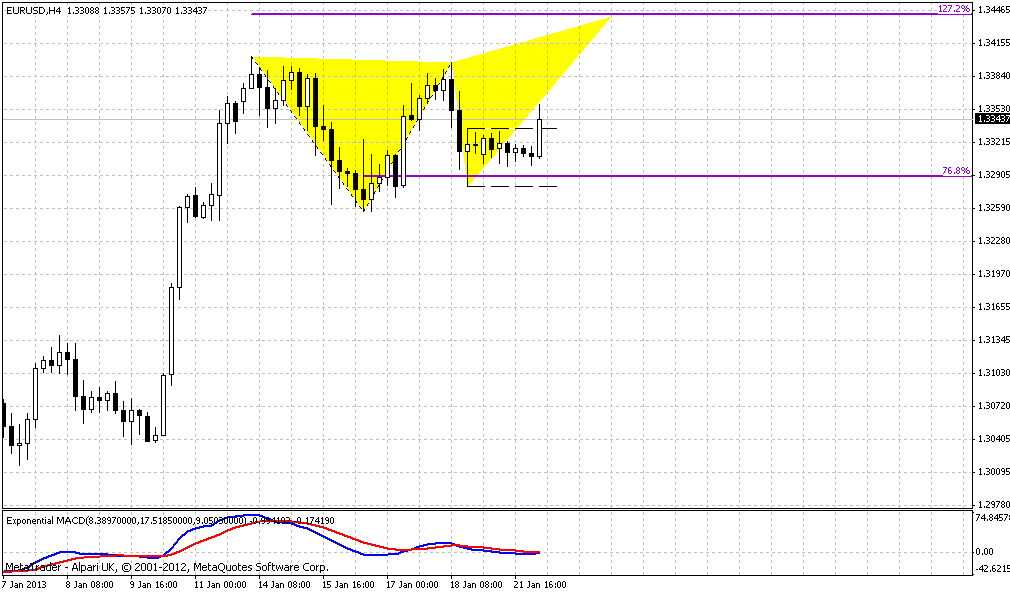
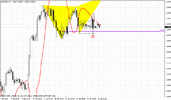
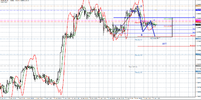
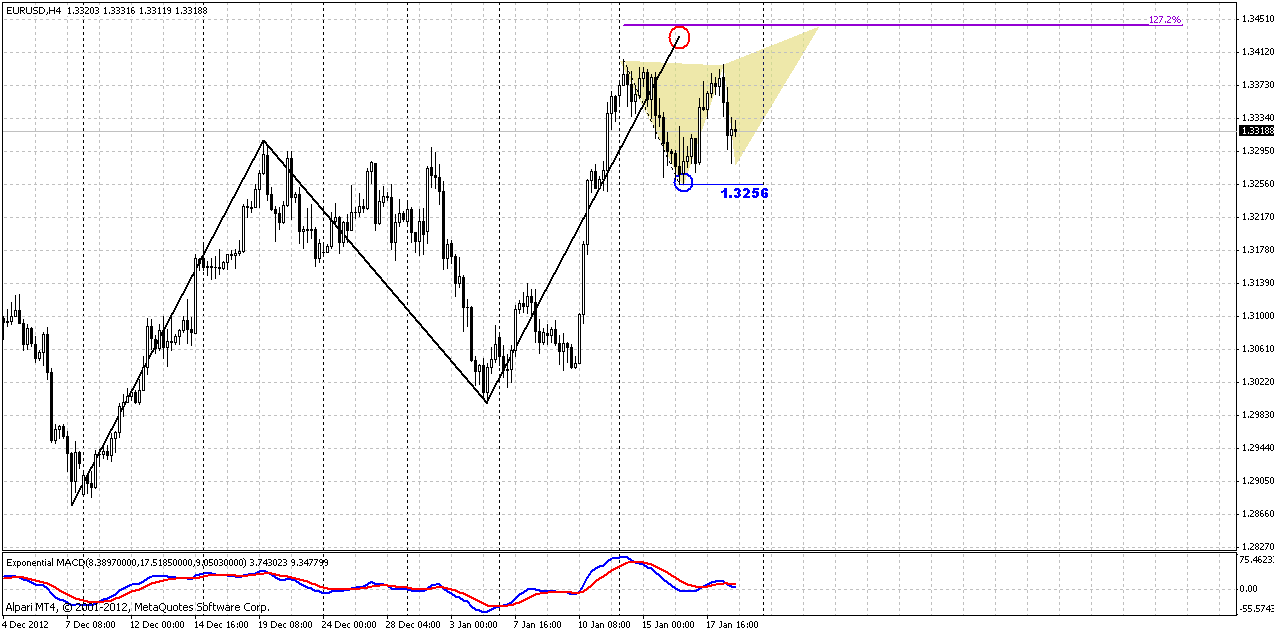
4-hour chart seems significant for bulls. Here we have Butterfly “Sell” in progress that simulteniously could accomplish daily AB=CD pattern. 1.3256 is crucial low for upward scenario – this is Butterfly invalidation point, WPS1 and support of previous consolidation. If market will fail here, it at once will break daily pennant. This will be not welcome price action for bulls.
1-hour
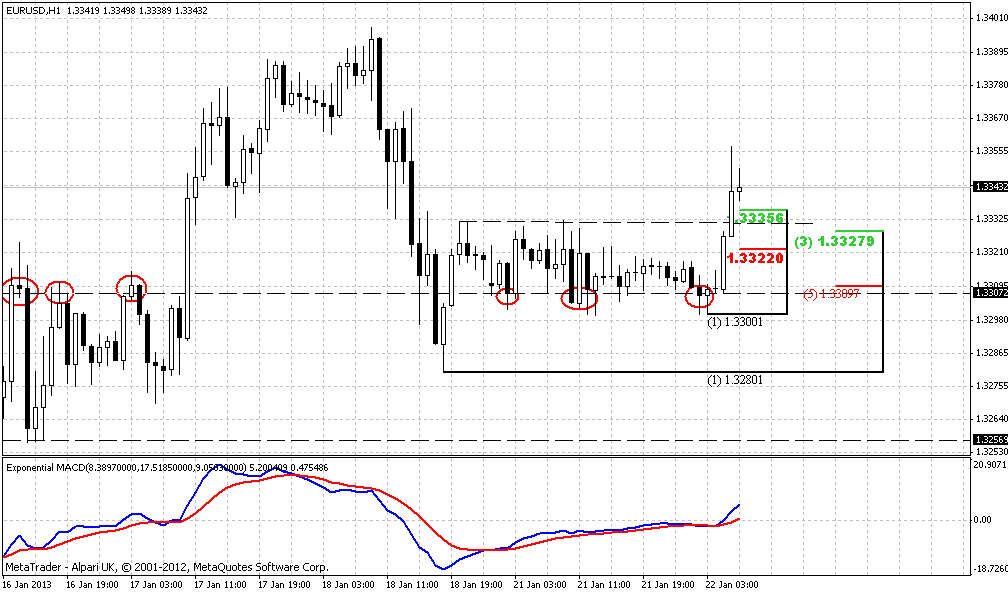
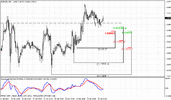
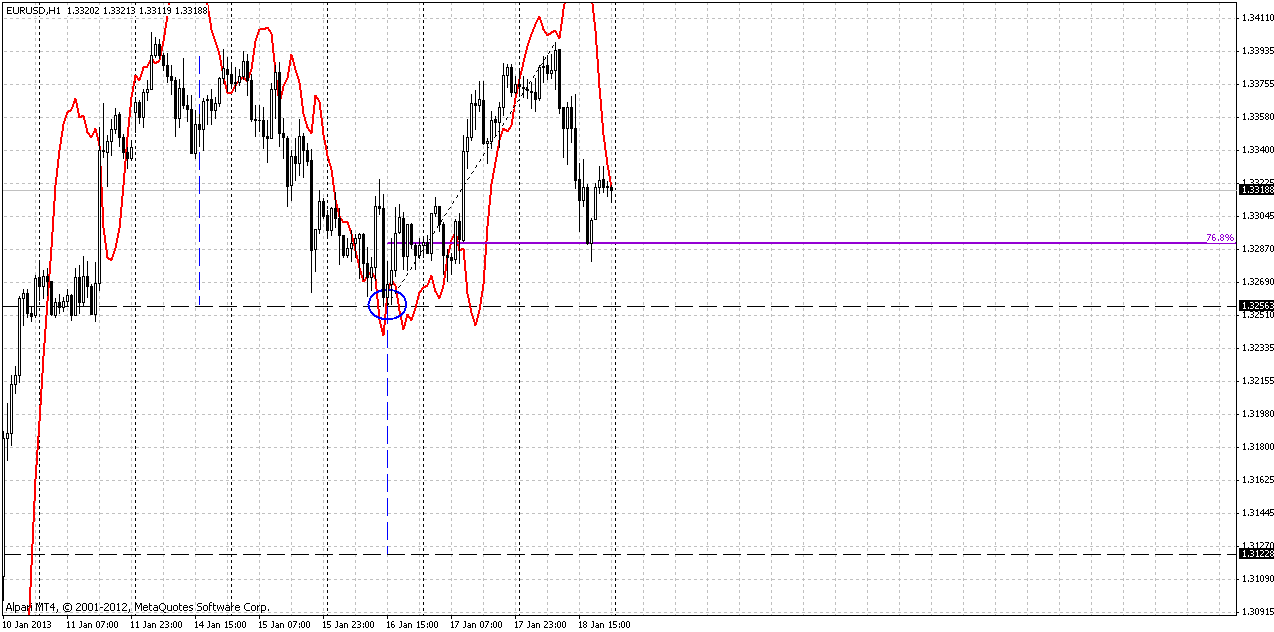
Hourly chart tells us how to combine two contradictive patterns right at the start of the week. Recall that on Friday we’ve discussed the possibility of Double Top pattern here. However, this pattern will be confirmed only if market will show true break through 1.3256 low – other words will cancel Butterfly “Sell”. Market now stands at deep 76.8% Fib support that is typical for Butterfly. Lasc candle here has formed bearish stop grabber, that suggest possible move below previous low around 76.8% support, but it doesn’t mean that market will not be able to safe Butterfly. Hence, first point that we have to do – control trend on hourly chart. If it will turn bullish and erase stop grabber, if you’re bullish you can try to enter Long with stops below 1.3256. If stop grabber will work – we need to control two things – market should not take out 1.3256 and turn trend bullish after it will form some new low compares to 1.3280. Then also, if trend will turn bullish we can try to enter long as well.
Speaking shortly, we can count on bullish continuation until 1.3256 is alive and when hourly trend will turn bullish. If any of these events will fail – do not enter Long.
If market will move below 1.3256 – that probably could lead to deeper move down. According to Double Top pattern price could reach 1.3120 area. Here is major risk – is to not be trapped by possible W&R of 1.3256 – we need true breakout. In this case we can start to think about short entry. May be this sounds a bit complicated but what we could expect, market is not very simple substance...
Conclusion:
In a big picture bias holds bullish, but price action does not show the real power. To get more confidence with bullish intentions I prefer to see some acceleration above 1.35 area, since behavior on congener GBP pair worries me a bit.
On Monday our task is to understand will it be still upward splash by Butterfly pattern or market will turn to deeper retracement. For that purpose we need control two major things on hourly chart – trend and 1.3256 low.
The technical portion of Sive's analysis owes a great deal to Joe DiNapoli's methods, and uses a number of Joe's proprietary indicators. Please note that Sive's analysis is his own view of the market and is not endorsed by Joe DiNapoli or any related companies.
Currently monthly chart carries nothing new compares to previous week. Trend holds bullish and price has no barriers ahead – next resistance level is 1.3834 and monthly overbought. At the same time we have to pay attention to 1.3486 level. This level is significant by two reasons. It coincides with 50% resistance and second - this level is a kind of quality test for current upward move, since this is a high of most recent swing down. We know that when market forms swing up that is greater than previous swing down – this might be an indication of reversal. Particularly by that mean – 1.3486 is significant. That is what about current swing up...
Generally speaking upward move looks not as impressive as previous one in 2010. Currently we do not see any explosive thrusts, long candles – just gradual, calm and choppy move. It looks more like just a retracement rather reversal and new upside trend. You may appeal to MACD trend, since it’s bullish, however price has not formed higher high yet – usual feature of uptrend. Hence, we still in kind of limbo here.

Weekly
So, previous week had relatively tight range, but still there was a significant moment – market has touched 0.618 target of AB=CD pattern and MPR1. In fact, any pullback from here will be reasonable, until it will be small. Theoretically, as we’ve said above, next resistance area is 1.3486, but it will catch AB=CD development between 0.618 and 1.0 targets. I do not know, how market will deal with it. Ultimately, we have strong resistance around major 5/8 Fib level that as we can see now – is weekly Agreement and overbought as well. All these moments are correct, but we’ve discussed already some suspicions in weekly analysis, and here I do not like couple of moments. First is – slow CD leg that is a bit curious, especially when BC leg is just 0.382 retracement.

Second – take a look at weekly GBP chart – very bearish price action. Trend has turned bearish, W&R and breakout of support line. Reasonable argument that GBP and EUR are not the same, still such divergence with congener currency should not be unconsidered.

Current growth on EUR looks a bit artificial, because fundamentally I do not see many outclass points in favor of EU, statistics is poor, no turning solutions on crisis. Is the only thing that could fed it – fiscall cliff? That’s very precarious foundation... I don’t want to say that this growth will not continue, but not all so clear as I want it to see.
Daily
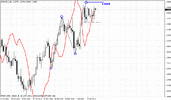
In the beginning of daily view, I would like to take a look at contracted daily chart. It carries nothing new – just lets us a bit clearer understand big picture. We see that upward channel has dominated and market has broken long-term bear trend. We have significant tradable low in blue circle, since it holds upward channel. Still, now market has reached long-term natural resistance line. To get the confidence with bullish intentions we need some confirmation – upward breakout above 1.3480-1.35 area. In this case weekly AB=CD will hold and next level is 1.3833.

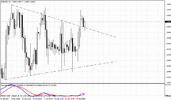
Shorter chart shows that market is coiling under solid resistance, recent AB=CD has not been completed – our Friday’s suspicions have panned out. Now price action reminds pennant. On coming week we could get great assistance from pivots. Take a look – market will open right around WPP and upper and lower borders coincide with WPR1 and WPS1 correspondingly. Unfortunately I can’t extract more from daily time frame.

4-hour
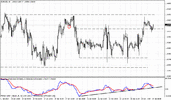
4-hour chart seems significant for bulls. Here we have Butterfly “Sell” in progress that simulteniously could accomplish daily AB=CD pattern. 1.3256 is crucial low for upward scenario – this is Butterfly invalidation point, WPS1 and support of previous consolidation. If market will fail here, it at once will break daily pennant. This will be not welcome price action for bulls.

1-hour
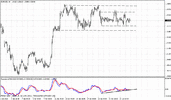
Hourly chart tells us how to combine two contradictive patterns right at the start of the week. Recall that on Friday we’ve discussed the possibility of Double Top pattern here. However, this pattern will be confirmed only if market will show true break through 1.3256 low – other words will cancel Butterfly “Sell”. Market now stands at deep 76.8% Fib support that is typical for Butterfly. Lasc candle here has formed bearish stop grabber, that suggest possible move below previous low around 76.8% support, but it doesn’t mean that market will not be able to safe Butterfly. Hence, first point that we have to do – control trend on hourly chart. If it will turn bullish and erase stop grabber, if you’re bullish you can try to enter Long with stops below 1.3256. If stop grabber will work – we need to control two things – market should not take out 1.3256 and turn trend bullish after it will form some new low compares to 1.3280. Then also, if trend will turn bullish we can try to enter long as well.
Speaking shortly, we can count on bullish continuation until 1.3256 is alive and when hourly trend will turn bullish. If any of these events will fail – do not enter Long.
If market will move below 1.3256 – that probably could lead to deeper move down. According to Double Top pattern price could reach 1.3120 area. Here is major risk – is to not be trapped by possible W&R of 1.3256 – we need true breakout. In this case we can start to think about short entry. May be this sounds a bit complicated but what we could expect, market is not very simple substance...

Conclusion:
In a big picture bias holds bullish, but price action does not show the real power. To get more confidence with bullish intentions I prefer to see some acceleration above 1.35 area, since behavior on congener GBP pair worries me a bit.
On Monday our task is to understand will it be still upward splash by Butterfly pattern or market will turn to deeper retracement. For that purpose we need control two major things on hourly chart – trend and 1.3256 low.
The technical portion of Sive's analysis owes a great deal to Joe DiNapoli's methods, and uses a number of Joe's proprietary indicators. Please note that Sive's analysis is his own view of the market and is not endorsed by Joe DiNapoli or any related companies.
