Sive Morten
Special Consultant to the FPA
- Messages
- 18,781
Fundamentals
(Reuters) - The dollar edged down on Friday as investors were underwhelmed by the limited scope of executive actions and the lack of concrete policy reforms in the inauguration speech of newly sworn-in U.S. President Donald Trump.
Investors had been looking to Trump's first address as president to highlight his plans for fiscal spending, tax cuts and regulatory reforms. Instead, Trump focused his remarks on his "America first" policies that were short on specific proposals.
"To the extent you could read into that, you might think markets were expecting something more optimistic and they heard a little bit of pessimism, a little negativity," said Chris Zaccarelli, chief investment officer at Cornerstone Financial Partners in Huntersville, North Carolina. "The market is waiting to take its cues from actual policies as opposed to potential or proposed policies."
The dollar index, which tracks the greenback against six major currencies, was little moved immediately following Trump's remarks, but trudged downward as investors unpacked the speech and saw news of the executive actions.
"Trump’s speech focused on protectionism and the markets rejected the idea that protectionism is going to be the new president’s central focus because protectionism means trade wars, which is not good for the (dollar)," said Kathy Lien, managing director of BK Asset Management.
The dollar index fell 0.3 percent. It has risen about 3 percent since Trump's Nov. 8 election victory, but has shed about 1.3 percent so far in January on growing concerns about Trump's protectionist rhetoric and recent comments about his dissatisfaction with the strong dollar.
Analysts also noted the protests in Washington in which about 90 people were arrested as prompting investor uncertainty.
The dollar fell against the euro, Japanese yen and British pound, touching session lows against each at around 3 p.m. The dollar was lower against each currency for the week as well
The Mexican peso briefly trimmed early gains during Trump's speech, but strengthened again after the president did not detail measures that could specifically affect Mexico. The peso rose 1.8 percent against the dollar, its largest one-day percentage gain since November.
The peso has weakened significantly in the new year, touching a new all-time low of 22.03 pesos per dollar on Jan. 11.
Are investors misreading Trump on trade?
by Fathom Consulting
Arguably, US economic prospects are more positive than they have been in a long while. Throughout his election campaign, Donald Trump set out plans to reflate the US economy. Current market pricing suggests that investors have taken him at his word: these expectations have caused the US dollar to rally, and US Treasury yields to jump. US equities have also risen, particularly domestically-focused stocks. Are investors too sanguine about the outlook for the US economy? Have they misread Donald Trump’s intentions, especially on trade?

It appears that one of the items near the top of Mr Trump’s agenda when he takes office this Friday is to renegotiate the US trade relationship with China. The stakes are high: US exporters could lose access to the world’s second largest economy; and US consumers might be deprived of the hundreds of billions of dollars’ worth of goods that they buy from China each year.
One group of stakeholders that would arguably stand to lose most from a full-blown trade war are US firms that sell directly into China. If Donald Trump were to slap tariffs on imports from China, one might assume that China would respond by restricting access to its market for US multinationals.
In order to investigate how likely investors view such an outcome, Fathom has created an index that tracks the share prices of 25 US-listed firms that derive a significant share of their revenues from China. This index, which we call the China Exposure Index (CEI), weights firms by their revenue exposure to China and compares their share price movements to the relevant S&P 500 sector benchmark.
Surprisingly, our CEI shows that US firms that do business in China have outperformed their peers since the election. Are investors oblivious to the risks of a trade war with China? Or are they confident that Donald Trump will strike a deal with China, increasing access to the Chinese market for US firms? We think that the latter is more likely.
COT Report
Speculators reduced long bets on the U.S. dollar for a second straight week, as investors continued to pare back overextended positions on the greenback and worried about U.S. President Donald Trump's trade and
currency policies.
The value of the dollar's net long position was $24.44 billion in the week ended Jan. 17, from $24.95 billion the
previous week, according to data from the Commodity Futures Trading Commission released on Friday and calculations by Reuters.
After a sharp rally following Trump's victory in November that saw a 3 percent surge for the month, the dollar has come back down to earth, undermined by uncertainty surrounding the new president's policies, specifically a stimulus plan that was promised during his campaign.
The dollar had rallied the last two months on the back of Trump's campaign promises of fiscal stimulus and tax cuts, but that rally ran out of steam in the run-up to Trump's inauguration. For the month of January, the dollar index has fallen 1.3 percent so far, on track for its weakest monthly performance since March last year.
"If the dollar continues to weaken, we're rapidly running out of room and dollar bulls may be forced into a full-fledged capitulation, which has yet to take place at current levels," said John Hardy, head of forex strategy at Saxo Bank, in Copenhagen.
"If the dollar firms, on the other hand, the gains could come quickly as frustrated bulls have been without a case, ironically since the Fed's rate hike in December, which marked the end of the most recent dollar advance," he added.
The Reuters calculation for the aggregate U.S. dollar position is derived from net positions of International Monetary Market speculators in the yen, euro, British pound, Swiss franc and Canadian and Australian dollars.
Speaking on EUR directly, in last two month we see that net short position has reduced while open interest mostly remains the same. It means that some part of short positions was replaced by longs. At the same time price has turned up just 2 weeks ago, and probably this shorts-by-longs-replacement has low volumes. That's being said, current CFTC data mostly supports retracement that we have on EUR, but at the same time doesn't lead to conclusion that this is new bull trend yet.

Technical
Monthly
So, markets' preparation for D. Trump speech in result was in vain, just empty bubble. Nothing was said, no clarity was brought to investors. It seems that right now investors will have to search their own solution and betting on further direction without external hints from new president administration, at least until next Fed meeting... As a result, two weeks of preparation has ended with no result. Reaction on Trump speech was anemic.
Right now January is just inside month and makes no impact on overall long-term picture. We know that fundamental background mostly looks bearish for EUR - potentially more hawkish Fed policy, ECB QE prolongation, coming elections in many EU countries, bringing more uncertainty. After GB, separatistic sentiment start to appear in other countries of EU, as Italy, France, Netherlands, Spain that are not satisfied with Brussels domination in governing EU.
So as New year starts, we have new yearly pivots numbers.
Yearly Pivot (YPP) stands at 1.0828 area, YPR1 = 1.1305, YPS1 = 1.0040. Last one has major importancy for us. It is interesting that 2017 YPS1 coincides with parity.
The only new pattern that we could watch here is possible bearish grabber as January has touched MACDP line. Now we need to wait what close price we will get. This will be weaker type of grabber, but still, on monthly chart it also could be important.
On a way down, guys, EUR has passed through all major Fib levels. Last one was at 1.12 area and now we do not have any other below current market. Also price has dropped below 1.27 extension of this big butterfly. Thus, on monthly chart the only logical destination point stands at parity - 1.618 butterfly extension, chanell trend line support and YPS1.
Among other patterns that we have, we could mention bearish dynamic pressure. But mostly it has completed it's target as 1.05 lows has been taken out.
Also take a look at different behavior near low border of channel. Previously when market has touched it - it shows immediate upside pullback, it was V-shape reversal. Right now behavior is absolutely different, price just hangs on the border and shows no upside action. Any tight consolidation near trendline could become a sign of coming breakout.
Thus, based on monthly chart we could make two major conclusions. First is - real bullish trend will be re-established only if EUR will erase reversal candle and overcome its top above 1.16. Our next target on Monthly chart is parity - 1.618 Butterfly extension, YPS1 and trendline support.
In general guys, we think that steps that already have been announced by ECB and Fed should be enough to push EUR right to parity during "price-in" process, when market will "anticipate" them. But further dynamic will depend on real action from Fed, Trump administration and ECB. How they will fulfill their promises and obligations. Any surprising hawkish measures could push EUR even below parity, while step out from pormises could lead to appearing of reverse H&S pattern on monthly/weekly charts.
In shorter-term perspectives, as we've come to conlcusion that EUR could show deeper upside retracement, our attention is attracted by YPP, that stands at 1.0830 area. This is , in turn, logical destination for short-term upside retracement, as we said earlier:

Weekly
Today we probably have to postpone discussion of weekly targets, since it seems that market will spend some more time in retracement, before it will turn to new extension leg down. Thus, right now we will talk mostly about 3-4 weeks consolidation and price action relatively to this consolidation rather than on big targets of our butterfly pattern.
Trend has turned bullish on weekly, pice is not at OB/OS. Our grabber pattern has beend erased by upside price action last week. Speaking in two words - it seems that EUR will continue upward action to next resistance around 1.0830 area. On a way up it also will test YPP. Take a look that bottom of current consoldation around 1.03-1.04 lows was formed by dojies, a kind of high wave pattern and market was standing in its range almost for month or so. But yesterday, price finally broke it up. It means that market has chosen short-term direction and keeps chances on upside continuation a bit more. Although this fact absolutely doesn't change larger picture.
With big picture on weekly chart we have 2 major patterns - butterfly and inner AB-CD pattern. Now market shows reaction on 1.0 extension target.
Final destination 1.618 point coincides with 1.618 butterfly target. Although we have multiple targets inside 1.0-1.05 area, ther are all minor ones. Recall, that we have daily 1.0230 extension. Also, if you will take a careful look, you could recognize another smaller butterfly inside right wing here. It also has target at 1.02 and 1.013.
But, guys, if EUR will be on a road to parity, all these intermediate targets will be hit very fast one by one.
Also, it is not very probable that market will stuck around 1.27 butterfly and will not go to parity. By two reasons - first is, pshychological pressure, second - when price will hit 1.27, it will be between 1.0 and 1.618 extensions of AB-CD pattern and this position is very unstable, market gravitates to some target... That's why parity probably should be hit.
And after that most interesting thing will come. Take a look that butterfly could become part of large reverse H&S pattern. But whether it will be formed or not will depend on fundamental factors, D. Trump ficsal policy, US economy data and Fed reaction. Thus, we have more or less single road to parity, but later, around it we will get a crossroads...If there will be something bearish that wasn't priced in yet - EUR could drop even further. If not - H&S will start to form...

Daily
On daily chart price action looks choppy and sloppy that is typical for retracement mode. As we've estimated 2 weeks ago EUR has broken market mechanics in favor of 2-leg double sized upside retracement, and still follows it.
The major background and reason for this retracement is information vacuum. Market was ready to stay on bear trend and push price lower, right to parity, but sudden question on perspectives of Trump financial policy has chilled them out a bit and forced to take a pause and wait for some clarity. But this clarity has not come niether on speech 2 weeks ago, nor during inauguration speech. And this is mostly negative for dollar in short term. That's why this retracement stands under way. At the same time it explains low activity and choppy action, because this is just a time of indecision and expectation, this is like drifting boat with engines off, while captain is choosing the direction and watching maps.
Technical picture also mostly looks supportive for further upside action. Price stands above MPP. K-resistance was tested once and after minor bounce up price has returned back inside it. EUR is not at OB right now. Trend stands bullish. Thus, here we see no signs yet that could point on inability to reach 1.0830 resistance area:

Intraday
On 4-hour we have rather constant picture - the same butterfly and inner AB=CD pattern. Nearest destination point is 1.0735, that probably should be reached on monday. 1.618 extension stands right around 1.0830 target and this could be an answer how retracement will be fisnished.

To complete first target @ 1.0730 EUR probably will form another minor butterfly hourly chart. Also there will be WPR1 area:

Conclusion:
Although we do not see any menace to our long-term view from current upside action - it's scale is too small to make impact on long-term view, market probably will creep a bit higher. As major reason of current upside retracement is lack of clarity on US administration steps in financial sphere - market will wait it until they will come. Thus, there is no suprise that EUR will spend some some time in retracement and could reach 1.0830 target.
The technical portion of Sive's analysis owes a great deal to Joe DiNapoli's methods, and uses a number of Joe's proprietary indicators. Please note that Sive's analysis is his own view of the market and is not endorsed by Joe DiNapoli or any related companies.
(Reuters) - The dollar edged down on Friday as investors were underwhelmed by the limited scope of executive actions and the lack of concrete policy reforms in the inauguration speech of newly sworn-in U.S. President Donald Trump.
Investors had been looking to Trump's first address as president to highlight his plans for fiscal spending, tax cuts and regulatory reforms. Instead, Trump focused his remarks on his "America first" policies that were short on specific proposals.
"To the extent you could read into that, you might think markets were expecting something more optimistic and they heard a little bit of pessimism, a little negativity," said Chris Zaccarelli, chief investment officer at Cornerstone Financial Partners in Huntersville, North Carolina. "The market is waiting to take its cues from actual policies as opposed to potential or proposed policies."
The dollar index, which tracks the greenback against six major currencies, was little moved immediately following Trump's remarks, but trudged downward as investors unpacked the speech and saw news of the executive actions.
"Trump’s speech focused on protectionism and the markets rejected the idea that protectionism is going to be the new president’s central focus because protectionism means trade wars, which is not good for the (dollar)," said Kathy Lien, managing director of BK Asset Management.
The dollar index fell 0.3 percent. It has risen about 3 percent since Trump's Nov. 8 election victory, but has shed about 1.3 percent so far in January on growing concerns about Trump's protectionist rhetoric and recent comments about his dissatisfaction with the strong dollar.
Analysts also noted the protests in Washington in which about 90 people were arrested as prompting investor uncertainty.
The dollar fell against the euro, Japanese yen and British pound, touching session lows against each at around 3 p.m. The dollar was lower against each currency for the week as well
The Mexican peso briefly trimmed early gains during Trump's speech, but strengthened again after the president did not detail measures that could specifically affect Mexico. The peso rose 1.8 percent against the dollar, its largest one-day percentage gain since November.
The peso has weakened significantly in the new year, touching a new all-time low of 22.03 pesos per dollar on Jan. 11.
Are investors misreading Trump on trade?
by Fathom Consulting
Arguably, US economic prospects are more positive than they have been in a long while. Throughout his election campaign, Donald Trump set out plans to reflate the US economy. Current market pricing suggests that investors have taken him at his word: these expectations have caused the US dollar to rally, and US Treasury yields to jump. US equities have also risen, particularly domestically-focused stocks. Are investors too sanguine about the outlook for the US economy? Have they misread Donald Trump’s intentions, especially on trade?
It appears that one of the items near the top of Mr Trump’s agenda when he takes office this Friday is to renegotiate the US trade relationship with China. The stakes are high: US exporters could lose access to the world’s second largest economy; and US consumers might be deprived of the hundreds of billions of dollars’ worth of goods that they buy from China each year.
One group of stakeholders that would arguably stand to lose most from a full-blown trade war are US firms that sell directly into China. If Donald Trump were to slap tariffs on imports from China, one might assume that China would respond by restricting access to its market for US multinationals.
In order to investigate how likely investors view such an outcome, Fathom has created an index that tracks the share prices of 25 US-listed firms that derive a significant share of their revenues from China. This index, which we call the China Exposure Index (CEI), weights firms by their revenue exposure to China and compares their share price movements to the relevant S&P 500 sector benchmark.
Surprisingly, our CEI shows that US firms that do business in China have outperformed their peers since the election. Are investors oblivious to the risks of a trade war with China? Or are they confident that Donald Trump will strike a deal with China, increasing access to the Chinese market for US firms? We think that the latter is more likely.
COT Report
Speculators reduced long bets on the U.S. dollar for a second straight week, as investors continued to pare back overextended positions on the greenback and worried about U.S. President Donald Trump's trade and
currency policies.
The value of the dollar's net long position was $24.44 billion in the week ended Jan. 17, from $24.95 billion the
previous week, according to data from the Commodity Futures Trading Commission released on Friday and calculations by Reuters.
After a sharp rally following Trump's victory in November that saw a 3 percent surge for the month, the dollar has come back down to earth, undermined by uncertainty surrounding the new president's policies, specifically a stimulus plan that was promised during his campaign.
The dollar had rallied the last two months on the back of Trump's campaign promises of fiscal stimulus and tax cuts, but that rally ran out of steam in the run-up to Trump's inauguration. For the month of January, the dollar index has fallen 1.3 percent so far, on track for its weakest monthly performance since March last year.
"If the dollar continues to weaken, we're rapidly running out of room and dollar bulls may be forced into a full-fledged capitulation, which has yet to take place at current levels," said John Hardy, head of forex strategy at Saxo Bank, in Copenhagen.
"If the dollar firms, on the other hand, the gains could come quickly as frustrated bulls have been without a case, ironically since the Fed's rate hike in December, which marked the end of the most recent dollar advance," he added.
The Reuters calculation for the aggregate U.S. dollar position is derived from net positions of International Monetary Market speculators in the yen, euro, British pound, Swiss franc and Canadian and Australian dollars.
Speaking on EUR directly, in last two month we see that net short position has reduced while open interest mostly remains the same. It means that some part of short positions was replaced by longs. At the same time price has turned up just 2 weeks ago, and probably this shorts-by-longs-replacement has low volumes. That's being said, current CFTC data mostly supports retracement that we have on EUR, but at the same time doesn't lead to conclusion that this is new bull trend yet.
Technical
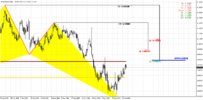
Monthly
So, markets' preparation for D. Trump speech in result was in vain, just empty bubble. Nothing was said, no clarity was brought to investors. It seems that right now investors will have to search their own solution and betting on further direction without external hints from new president administration, at least until next Fed meeting... As a result, two weeks of preparation has ended with no result. Reaction on Trump speech was anemic.
Right now January is just inside month and makes no impact on overall long-term picture. We know that fundamental background mostly looks bearish for EUR - potentially more hawkish Fed policy, ECB QE prolongation, coming elections in many EU countries, bringing more uncertainty. After GB, separatistic sentiment start to appear in other countries of EU, as Italy, France, Netherlands, Spain that are not satisfied with Brussels domination in governing EU.
So as New year starts, we have new yearly pivots numbers.
Yearly Pivot (YPP) stands at 1.0828 area, YPR1 = 1.1305, YPS1 = 1.0040. Last one has major importancy for us. It is interesting that 2017 YPS1 coincides with parity.
The only new pattern that we could watch here is possible bearish grabber as January has touched MACDP line. Now we need to wait what close price we will get. This will be weaker type of grabber, but still, on monthly chart it also could be important.
On a way down, guys, EUR has passed through all major Fib levels. Last one was at 1.12 area and now we do not have any other below current market. Also price has dropped below 1.27 extension of this big butterfly. Thus, on monthly chart the only logical destination point stands at parity - 1.618 butterfly extension, chanell trend line support and YPS1.
Among other patterns that we have, we could mention bearish dynamic pressure. But mostly it has completed it's target as 1.05 lows has been taken out.
Also take a look at different behavior near low border of channel. Previously when market has touched it - it shows immediate upside pullback, it was V-shape reversal. Right now behavior is absolutely different, price just hangs on the border and shows no upside action. Any tight consolidation near trendline could become a sign of coming breakout.
Thus, based on monthly chart we could make two major conclusions. First is - real bullish trend will be re-established only if EUR will erase reversal candle and overcome its top above 1.16. Our next target on Monthly chart is parity - 1.618 Butterfly extension, YPS1 and trendline support.
In general guys, we think that steps that already have been announced by ECB and Fed should be enough to push EUR right to parity during "price-in" process, when market will "anticipate" them. But further dynamic will depend on real action from Fed, Trump administration and ECB. How they will fulfill their promises and obligations. Any surprising hawkish measures could push EUR even below parity, while step out from pormises could lead to appearing of reverse H&S pattern on monthly/weekly charts.
In shorter-term perspectives, as we've come to conlcusion that EUR could show deeper upside retracement, our attention is attracted by YPP, that stands at 1.0830 area. This is , in turn, logical destination for short-term upside retracement, as we said earlier:
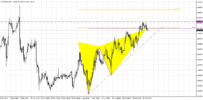
Weekly
Today we probably have to postpone discussion of weekly targets, since it seems that market will spend some more time in retracement, before it will turn to new extension leg down. Thus, right now we will talk mostly about 3-4 weeks consolidation and price action relatively to this consolidation rather than on big targets of our butterfly pattern.
Trend has turned bullish on weekly, pice is not at OB/OS. Our grabber pattern has beend erased by upside price action last week. Speaking in two words - it seems that EUR will continue upward action to next resistance around 1.0830 area. On a way up it also will test YPP. Take a look that bottom of current consoldation around 1.03-1.04 lows was formed by dojies, a kind of high wave pattern and market was standing in its range almost for month or so. But yesterday, price finally broke it up. It means that market has chosen short-term direction and keeps chances on upside continuation a bit more. Although this fact absolutely doesn't change larger picture.
With big picture on weekly chart we have 2 major patterns - butterfly and inner AB-CD pattern. Now market shows reaction on 1.0 extension target.
Final destination 1.618 point coincides with 1.618 butterfly target. Although we have multiple targets inside 1.0-1.05 area, ther are all minor ones. Recall, that we have daily 1.0230 extension. Also, if you will take a careful look, you could recognize another smaller butterfly inside right wing here. It also has target at 1.02 and 1.013.
But, guys, if EUR will be on a road to parity, all these intermediate targets will be hit very fast one by one.
Also, it is not very probable that market will stuck around 1.27 butterfly and will not go to parity. By two reasons - first is, pshychological pressure, second - when price will hit 1.27, it will be between 1.0 and 1.618 extensions of AB-CD pattern and this position is very unstable, market gravitates to some target... That's why parity probably should be hit.
And after that most interesting thing will come. Take a look that butterfly could become part of large reverse H&S pattern. But whether it will be formed or not will depend on fundamental factors, D. Trump ficsal policy, US economy data and Fed reaction. Thus, we have more or less single road to parity, but later, around it we will get a crossroads...If there will be something bearish that wasn't priced in yet - EUR could drop even further. If not - H&S will start to form...
Daily
On daily chart price action looks choppy and sloppy that is typical for retracement mode. As we've estimated 2 weeks ago EUR has broken market mechanics in favor of 2-leg double sized upside retracement, and still follows it.
The major background and reason for this retracement is information vacuum. Market was ready to stay on bear trend and push price lower, right to parity, but sudden question on perspectives of Trump financial policy has chilled them out a bit and forced to take a pause and wait for some clarity. But this clarity has not come niether on speech 2 weeks ago, nor during inauguration speech. And this is mostly negative for dollar in short term. That's why this retracement stands under way. At the same time it explains low activity and choppy action, because this is just a time of indecision and expectation, this is like drifting boat with engines off, while captain is choosing the direction and watching maps.
Technical picture also mostly looks supportive for further upside action. Price stands above MPP. K-resistance was tested once and after minor bounce up price has returned back inside it. EUR is not at OB right now. Trend stands bullish. Thus, here we see no signs yet that could point on inability to reach 1.0830 resistance area:
Intraday
On 4-hour we have rather constant picture - the same butterfly and inner AB=CD pattern. Nearest destination point is 1.0735, that probably should be reached on monday. 1.618 extension stands right around 1.0830 target and this could be an answer how retracement will be fisnished.
To complete first target @ 1.0730 EUR probably will form another minor butterfly hourly chart. Also there will be WPR1 area:
Conclusion:
Although we do not see any menace to our long-term view from current upside action - it's scale is too small to make impact on long-term view, market probably will creep a bit higher. As major reason of current upside retracement is lack of clarity on US administration steps in financial sphere - market will wait it until they will come. Thus, there is no suprise that EUR will spend some some time in retracement and could reach 1.0830 target.
The technical portion of Sive's analysis owes a great deal to Joe DiNapoli's methods, and uses a number of Joe's proprietary indicators. Please note that Sive's analysis is his own view of the market and is not endorsed by Joe DiNapoli or any related companies.