Sive Morten
Special Consultant to the FPA
- Messages
- 18,715
Fundamentals
(Reuters) The dollar slid against the yen and some currencies on Friday in choppy trading on the view that the much stronger-than-expected U.S. employment payrolls report will not persuade the Federal Reserve just yet to raise interest rates again this year.
The greenback did rise after the U.S. jobs data, reversing losses against the yen and climbing to two-week highs against the euro and a five-week peak versus the Swiss franc. But gains against the yen evaporated and the dollar traded mostly lower on the day.
The dollar, however, remained higher against the euro and Swiss franc, but fell versus the Australian, Canadian, and New Zealand currencies.
Data showed that non-farm payrolls increased by 287,000 jobs last month, the largest gain since last October. May's payroll count was revised down to only 11,000 from the previously reported 38,000.
"It will likely require continued evidence of positive economic data in the months to come, including solid NFP (non-farm payroll) numbers, in order to convince the Fed that a rate hike would be appropriate," said James Chen, currency strategist, at Forex.com in New Jersey.
Fed funds futures, based on the CME Group's FedWatch, have not priced in a rate increase this year and for much of 2017. The futures data has priced in just a 28.2 percent chance that the Fed will increase rates at the June 2017 meeting.
In late trading, the dollar fell 0.4 percent against the yen to 100.46 yen, not far from the post-Brexit low of 99 yen.
"The psychological 100.00 yen mark has long been seen by traders as the key 'line-in-the-sand' in terms of the potential risk of Japanese intervention," said Forex.com's Chen.
The euro, meanwhile, was slightly lower at $1.1050. It earlier fell to $1.1003, a two-week low, after the jobs data.
The dollar gained 0.4 percent against the Swiss franc to 0.9826 franc. The greenback earlier rose to a five-week high of 0.9867 franc following the jobs data.
Sterling rose 0.3 percent against the dollar to $1.2951, surprisingly resilient after an upbeat U.S. jobs number.
There should be significant downside risk for sterling next week, however, with the Bank of England's monetary policy announcement.
Kathy Lien, managing director of FX strategy at BK Asset Management in New York said BoE Governor Mark Carney could use the meeting next week to prepare for further easing.
"So even though sterling/dollar appears to be forming a base, this is far from a bottom," she added.
Strong UK second quarter no more than a statistical curiosity
by Fathom Consulting
Owing to exceptionally strong data in April, we estimate that the UK economy grew by 0.6% in Q2 of this year. But the turmoil since last month’s EU referendum means that Q2 GDP data are likely to be little more than a statistical curiosity. This morning’s consumer confidence survey made for bleak reading, which is likely to feed through to consumer behaviour, and falling investment from firms. Our central view remains that the UK will narrowly escape a recession, but only if sterling continues to fall, cushioning the blow.

We estimate that the UK economy grew by 0.6% in the second quarter of this year. This is somewhat better-than-expected, with forecasts from the beginning of the quarter pointing to near economic stagnation. Robust data for both services and production output in April look to have driven growth, with signs of a slowdown through May and June.
A very different tone for Q3
In our view, the turmoil since last month’s EU referendum means that Q2 GDP data are likely to be little more than a statistical curiosity. Indeed, survey based evidence points to a sharp drop in consumer confidence, with results from market researcher GfK suggesting that the UK has suffered the largest drop in consumer confidence since December 1994. As the first chart highlights, its headline index has fallen sharply between the survey conducted before the referendum (when a vote to ‘Remain’ seemed the most likely outcome), and the survey conducted on 29 June — the results of which were published today.
Within this, expectations about the general economic situation, personal finances, and purchases of big ticket items over the next twelve months all fell. Interestingly, confidence of UK households in their own financial situation, though still elevated, has fallen by more than at any time since the 2008-2009 recession.

Some uncertainty to subside
Some of the uncertainty reflected in the results of this survey, which was conducted on 29 June, is likely to be associated with the UK’s fragile political situation. Prime Minister David Cameron had resigned the previous morning and the Labour Party had begun efforts to oust its leader, Jeremy Corbyn. Since then, candidates for the new Conservative Prime Minister have been whittled down to Home Secretary Theresa May and Energy Minister Andrea Leadsom, with a final decision to be made by early September. Accordingly, uncertainty surrounding the political situation may begin to dissipate within a few weeks. However, uncertainty about the terms on which the UK exits the EU – or even if it exits at all – will remain for months, if not years.
Looking ahead
Under our central scenario, we assume that the UK narrowly avoids recession, with a weaker currency cushioning the blow from reduced consumer expenditure. Survey based evidence also points to a drastic reduction in the number of job adverts since the UK’s referendum, reflecting defensive behaviour by corporates. With the future of the UK economy highly uncertain, investment is likely to be severely reduced until businesses have a clearer picture of what lies ahead.

COT Report
Today guys, I think we can change our habit to talk mostly on european currencies and take a look at something else, for example on CAD. Mostly because we've talked about EUR and GBP too much recently and almost didn't talk on other currencies. Besides, CAD shows not bad short-term setup.
COT data does not show anything really special. Speculative position slightly bearish, open interest stands at average levels, nothing really important. So, from CFTC data we do not see any barriers as for upside action as for downside one:

Technical
Monthly
Here we're returning back to our old discussion of large picture. Market still stands in retracement after reaching all time AB=CD target. On a way down market has reached strong support area, consists of K-support, former top and YPP. On a first touch CAD has formed nicely looking bullish engulifng pattern.
So, this pattern in particular is our background for possible trade. But first - take a look at Crude oil chart. Price has completed harmonic upside swing, weekly trend has turned bearish and here we could count at least on minor retracement to ~43$ level. This will be enough to complete our CAD setup.

Usually when market forms engulfing pattern - it's target equals to its bar length, and action by itself take shape of some AB=CD pattern. Engulfing could become starting point of some greater action, but now we're mostly interested in minimal target:

Weekly
Here we see how situation with monthly engulfing pattern develops. Price has moved above MPP. Also, if you remember our last research - we've spoken on possible DRPO "Buy" pattern here. Well, actually we've got formal execution of DRPO conditions - thrust down, close above 3x3, below and then above again - this shape doesn't perfectly match to DRPO. Usually DRPO has equal bottoms, or even second bottome slightly lower, while here we have second bottom too high. It means that this action down was not an attempt to continue move lower, but mostly just a retracement after started upside action.
Thus, we probably could treat it as DRPO look-alike pattern, but may be it will work... Anyway DRPO has more extended target (around 1.36) but we will trade the closer one. First resistance here stands at 1.3311 area, trend is bullish on weekly chart by MACD:

Daily
Here we have definite patterns that point on target. As we've said - engulfing pattern very often takes the shape of AB=CD on lower time frames. So, we see it on daily chart. AB=CD target stands @ 1.3378, slightly higher than weekly Fib level.
At the same time, CD leg could take a shape of butterfly, 1.27 extension also stands in the same area. Here we also have minor grabbers that suggest upward contination.
Finally, butterly inner AB=CD has target around 1.33 area. Thus, all three patterns' targets stand very close to each other and create some kind of agreement with weekly Fib level:

Hourly
This picture shows that if market will show minor retracement down - 1.30 area is level where we could search for buy signals. This is a combination of WPP and Fib level. As market is not at overbought on daily chart - retracement should not be too deep.
Besides, current action up is already CD leg continuation, because loonie already has made a retracement after daily 0.618 AB-CD target been hit. Thus, too deep retracement here will be a bit irrational:

Conclusion:
Our analysis mostly is based on monthly retracement and dedicated to using it for tactical trading. Currently we expect that CAD could reach 1.33-1.3350 area. Long term perspectives is a bit blur right now, since to make a decision we need to see breakout of major levels on Crude oil, that we do not have by far.
The technical portion of Sive's analysis owes a great deal to Joe DiNapoli's methods, and uses a number of Joe's proprietary indicators. Please note that Sive's analysis is his own view of the market and is not endorsed by Joe DiNapoli or any related companies.
(Reuters) The dollar slid against the yen and some currencies on Friday in choppy trading on the view that the much stronger-than-expected U.S. employment payrolls report will not persuade the Federal Reserve just yet to raise interest rates again this year.
The greenback did rise after the U.S. jobs data, reversing losses against the yen and climbing to two-week highs against the euro and a five-week peak versus the Swiss franc. But gains against the yen evaporated and the dollar traded mostly lower on the day.
The dollar, however, remained higher against the euro and Swiss franc, but fell versus the Australian, Canadian, and New Zealand currencies.
Data showed that non-farm payrolls increased by 287,000 jobs last month, the largest gain since last October. May's payroll count was revised down to only 11,000 from the previously reported 38,000.
"It will likely require continued evidence of positive economic data in the months to come, including solid NFP (non-farm payroll) numbers, in order to convince the Fed that a rate hike would be appropriate," said James Chen, currency strategist, at Forex.com in New Jersey.
Fed funds futures, based on the CME Group's FedWatch, have not priced in a rate increase this year and for much of 2017. The futures data has priced in just a 28.2 percent chance that the Fed will increase rates at the June 2017 meeting.
In late trading, the dollar fell 0.4 percent against the yen to 100.46 yen, not far from the post-Brexit low of 99 yen.
"The psychological 100.00 yen mark has long been seen by traders as the key 'line-in-the-sand' in terms of the potential risk of Japanese intervention," said Forex.com's Chen.
The euro, meanwhile, was slightly lower at $1.1050. It earlier fell to $1.1003, a two-week low, after the jobs data.
The dollar gained 0.4 percent against the Swiss franc to 0.9826 franc. The greenback earlier rose to a five-week high of 0.9867 franc following the jobs data.
Sterling rose 0.3 percent against the dollar to $1.2951, surprisingly resilient after an upbeat U.S. jobs number.
There should be significant downside risk for sterling next week, however, with the Bank of England's monetary policy announcement.
Kathy Lien, managing director of FX strategy at BK Asset Management in New York said BoE Governor Mark Carney could use the meeting next week to prepare for further easing.
"So even though sterling/dollar appears to be forming a base, this is far from a bottom," she added.
Strong UK second quarter no more than a statistical curiosity
by Fathom Consulting
Owing to exceptionally strong data in April, we estimate that the UK economy grew by 0.6% in Q2 of this year. But the turmoil since last month’s EU referendum means that Q2 GDP data are likely to be little more than a statistical curiosity. This morning’s consumer confidence survey made for bleak reading, which is likely to feed through to consumer behaviour, and falling investment from firms. Our central view remains that the UK will narrowly escape a recession, but only if sterling continues to fall, cushioning the blow.
We estimate that the UK economy grew by 0.6% in the second quarter of this year. This is somewhat better-than-expected, with forecasts from the beginning of the quarter pointing to near economic stagnation. Robust data for both services and production output in April look to have driven growth, with signs of a slowdown through May and June.
A very different tone for Q3
In our view, the turmoil since last month’s EU referendum means that Q2 GDP data are likely to be little more than a statistical curiosity. Indeed, survey based evidence points to a sharp drop in consumer confidence, with results from market researcher GfK suggesting that the UK has suffered the largest drop in consumer confidence since December 1994. As the first chart highlights, its headline index has fallen sharply between the survey conducted before the referendum (when a vote to ‘Remain’ seemed the most likely outcome), and the survey conducted on 29 June — the results of which were published today.
Within this, expectations about the general economic situation, personal finances, and purchases of big ticket items over the next twelve months all fell. Interestingly, confidence of UK households in their own financial situation, though still elevated, has fallen by more than at any time since the 2008-2009 recession.
Some uncertainty to subside
Some of the uncertainty reflected in the results of this survey, which was conducted on 29 June, is likely to be associated with the UK’s fragile political situation. Prime Minister David Cameron had resigned the previous morning and the Labour Party had begun efforts to oust its leader, Jeremy Corbyn. Since then, candidates for the new Conservative Prime Minister have been whittled down to Home Secretary Theresa May and Energy Minister Andrea Leadsom, with a final decision to be made by early September. Accordingly, uncertainty surrounding the political situation may begin to dissipate within a few weeks. However, uncertainty about the terms on which the UK exits the EU – or even if it exits at all – will remain for months, if not years.
Looking ahead
Under our central scenario, we assume that the UK narrowly avoids recession, with a weaker currency cushioning the blow from reduced consumer expenditure. Survey based evidence also points to a drastic reduction in the number of job adverts since the UK’s referendum, reflecting defensive behaviour by corporates. With the future of the UK economy highly uncertain, investment is likely to be severely reduced until businesses have a clearer picture of what lies ahead.
COT Report
Today guys, I think we can change our habit to talk mostly on european currencies and take a look at something else, for example on CAD. Mostly because we've talked about EUR and GBP too much recently and almost didn't talk on other currencies. Besides, CAD shows not bad short-term setup.
COT data does not show anything really special. Speculative position slightly bearish, open interest stands at average levels, nothing really important. So, from CFTC data we do not see any barriers as for upside action as for downside one:
Technical
Monthly
Here we're returning back to our old discussion of large picture. Market still stands in retracement after reaching all time AB=CD target. On a way down market has reached strong support area, consists of K-support, former top and YPP. On a first touch CAD has formed nicely looking bullish engulifng pattern.
So, this pattern in particular is our background for possible trade. But first - take a look at Crude oil chart. Price has completed harmonic upside swing, weekly trend has turned bearish and here we could count at least on minor retracement to ~43$ level. This will be enough to complete our CAD setup.
Usually when market forms engulfing pattern - it's target equals to its bar length, and action by itself take shape of some AB=CD pattern. Engulfing could become starting point of some greater action, but now we're mostly interested in minimal target:
Weekly
Here we see how situation with monthly engulfing pattern develops. Price has moved above MPP. Also, if you remember our last research - we've spoken on possible DRPO "Buy" pattern here. Well, actually we've got formal execution of DRPO conditions - thrust down, close above 3x3, below and then above again - this shape doesn't perfectly match to DRPO. Usually DRPO has equal bottoms, or even second bottome slightly lower, while here we have second bottom too high. It means that this action down was not an attempt to continue move lower, but mostly just a retracement after started upside action.
Thus, we probably could treat it as DRPO look-alike pattern, but may be it will work... Anyway DRPO has more extended target (around 1.36) but we will trade the closer one. First resistance here stands at 1.3311 area, trend is bullish on weekly chart by MACD:
Daily
Here we have definite patterns that point on target. As we've said - engulfing pattern very often takes the shape of AB=CD on lower time frames. So, we see it on daily chart. AB=CD target stands @ 1.3378, slightly higher than weekly Fib level.
At the same time, CD leg could take a shape of butterfly, 1.27 extension also stands in the same area. Here we also have minor grabbers that suggest upward contination.
Finally, butterly inner AB=CD has target around 1.33 area. Thus, all three patterns' targets stand very close to each other and create some kind of agreement with weekly Fib level:
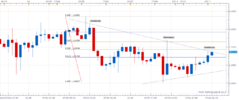
Hourly
This picture shows that if market will show minor retracement down - 1.30 area is level where we could search for buy signals. This is a combination of WPP and Fib level. As market is not at overbought on daily chart - retracement should not be too deep.
Besides, current action up is already CD leg continuation, because loonie already has made a retracement after daily 0.618 AB-CD target been hit. Thus, too deep retracement here will be a bit irrational:
Conclusion:
Our analysis mostly is based on monthly retracement and dedicated to using it for tactical trading. Currently we expect that CAD could reach 1.33-1.3350 area. Long term perspectives is a bit blur right now, since to make a decision we need to see breakout of major levels on Crude oil, that we do not have by far.
The technical portion of Sive's analysis owes a great deal to Joe DiNapoli's methods, and uses a number of Joe's proprietary indicators. Please note that Sive's analysis is his own view of the market and is not endorsed by Joe DiNapoli or any related companies.