Sive Morten
Special Consultant to the FPA
- Messages
- 18,673
Monthly
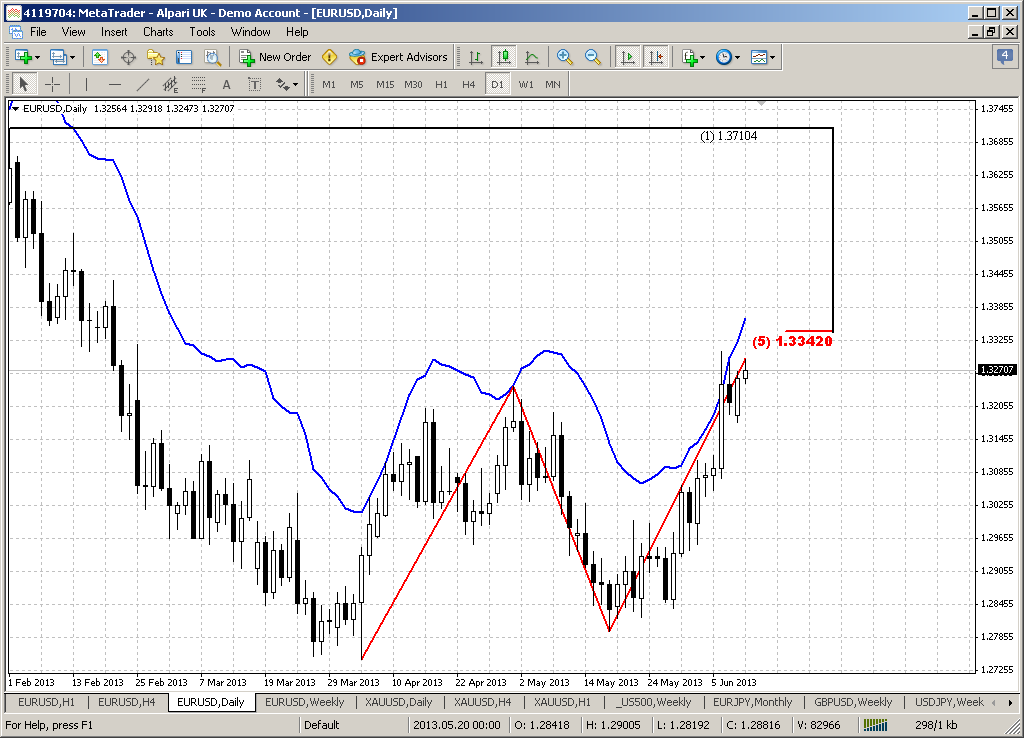
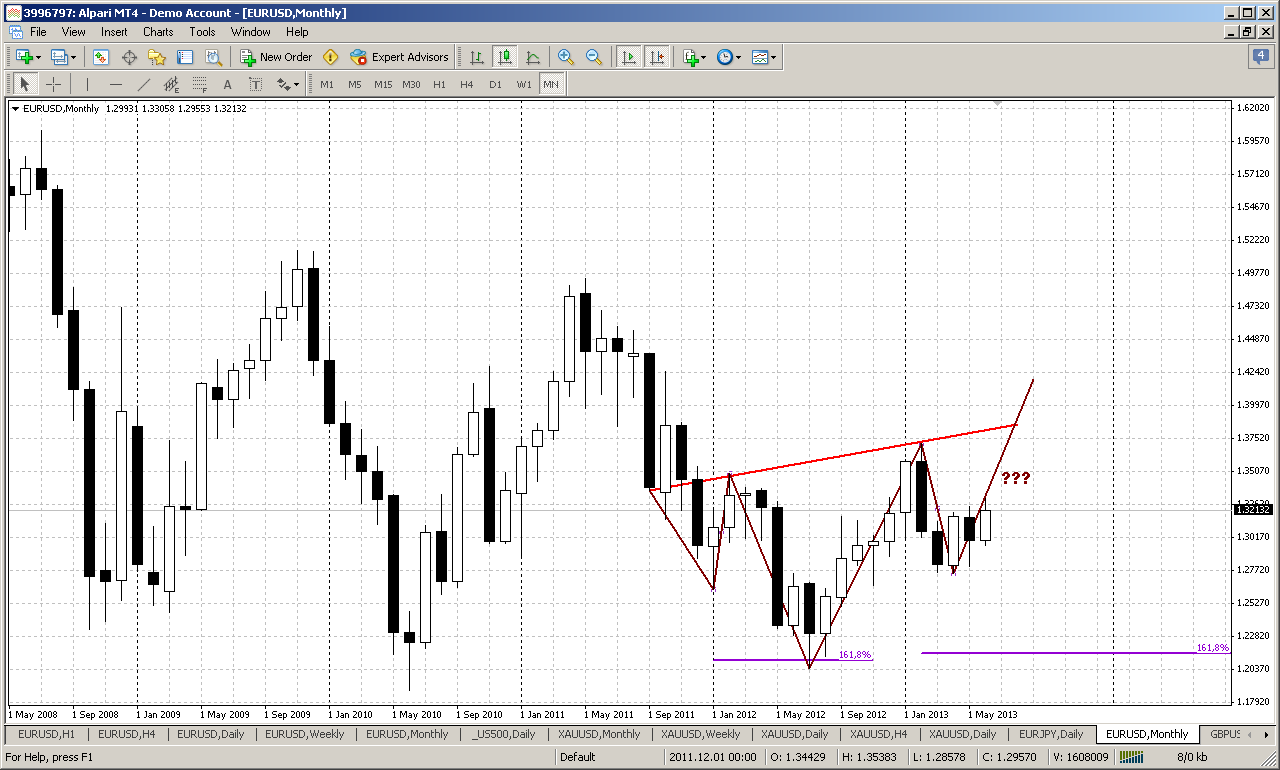
Since the start of June we see pretty nice upward action. Market already has exceeded the highs of May. At the same time on big picture there is no drastical changes. Market is still forming bearish flag pattern and upward action stands inside of it. It is too far till the moment where we can say that bullish trend is back. Probably we could say that only if price will exceed previous highs around 1.3730 or at least will return right back to 50% resisatnce around 1.35 area.
Conversely bearish continuation needs to show shallower confirmations – will be enough, if market will break flag down and move below yearly pivot point. Perspectives of this potential action are really impressive. First road will be to 1.2150- 1.2330 Yearly pivot support 1 and all time 50% support. But next is 1.1650 – take a look, may be you also will find potential left wing of butterfly “Buy” here...
Current bounce up has taken place right from yearly pivot support. This is really long-term support and it rather strong, especially since it coincides with 50% Fib support, and market can’t still pass through it. In fact, moving below yearly pivot will give market the direction for the rest of the year – that’s why this level is significant.
Despite how bearish current price looks, we have one moment that rather contradictive and let us understand why we call current level as crucial. Take a look at second monthly chart.
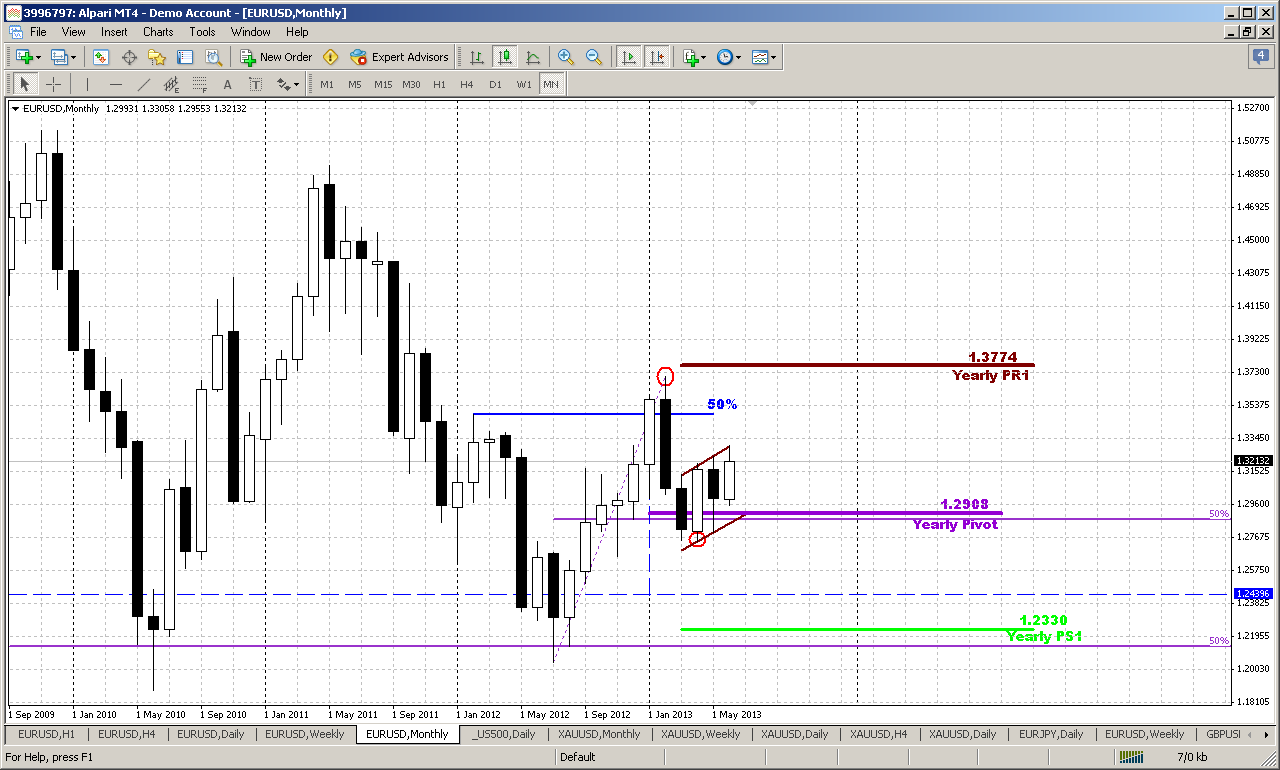
Yes, this indeed could be reverse H&S pattern right at all time 50% support area, that market has touched in August of 2012. Although this pattern has appeared not quite after solid bearish trend, since EUR, in fact stands in wide range since 2007-2008, but it has very nice harmony – head stands precisely at 1.618 of both shoulders. As we treat weekly action as H&S, although it stands in the middle of some price action, we also can treat this pattern as reverse H&S. The classical confirmation of this pattern will be at neckline breakout around 1.3750. But even before that, the way how market will deal with current bearish flag will be very important. Upward breakout could become a first bell of further continuation.
Weekly
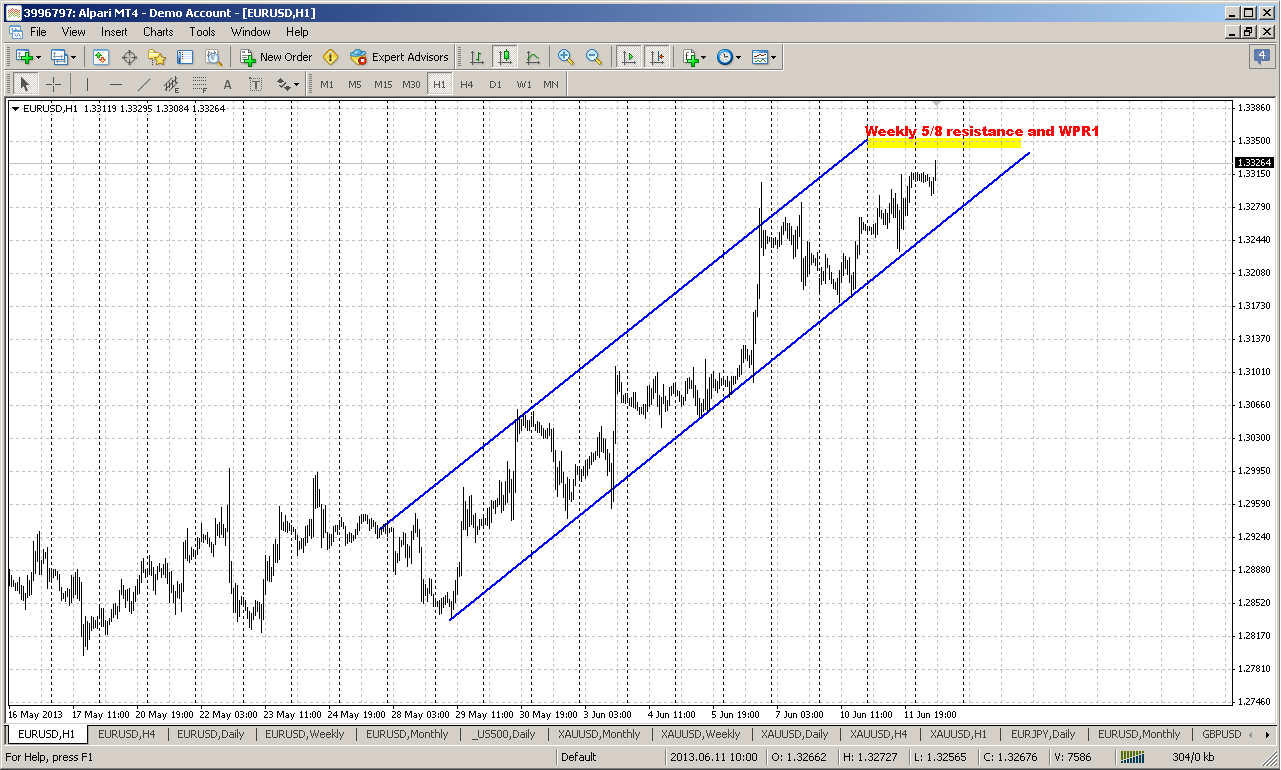
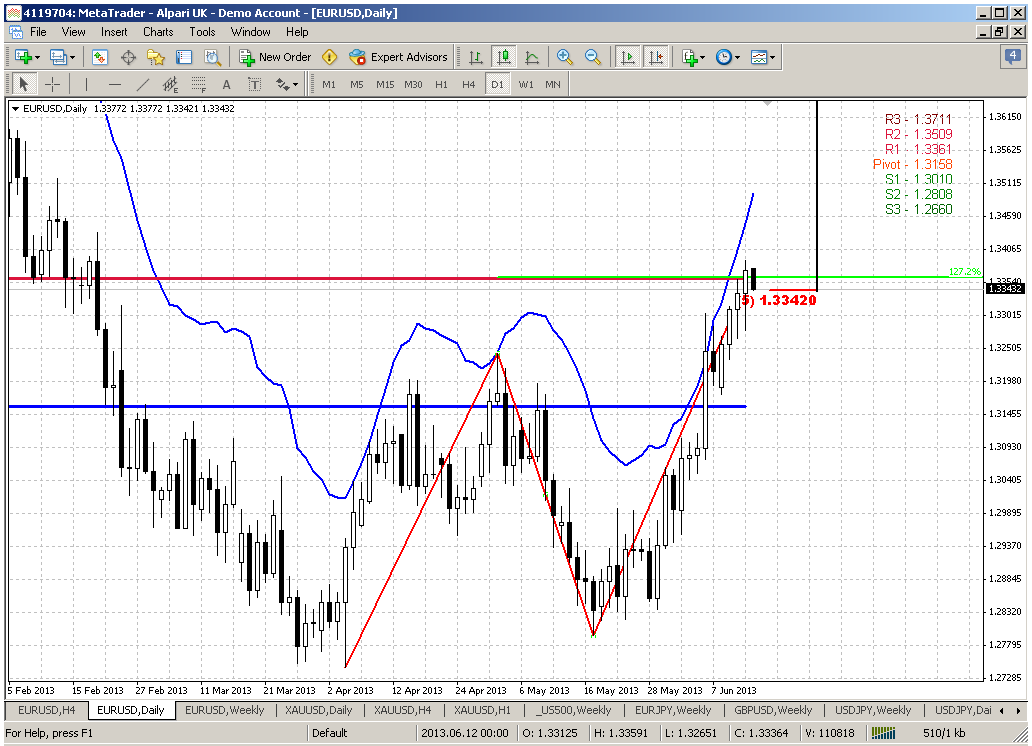
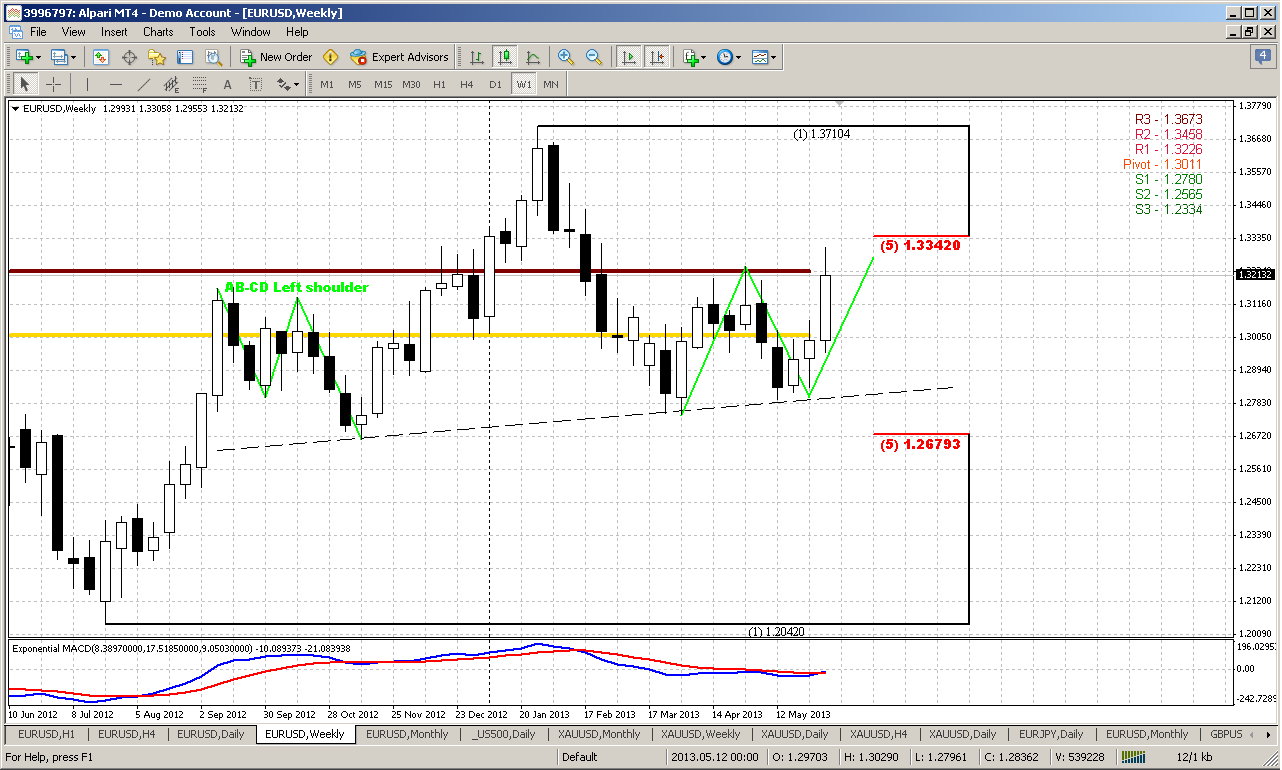
The weekly time frame has it’s own truth and problems, since here we have another pattern that stands opposite to monthly potential reverse H&S and price stands at strong resistance at the top of right shoulder. So, maximum retracement that is acceptable for H&S pattern has happened. This is AB=CD type of action. Any upward continuation will mean the breaking of H&S harmony. I do not want to say that if market will coil around for 1-2 weeks with shy exceeding of current highs – that’s OK. I’m talking about real upward continuation above 1.3350 area. Even if we will take a look at this situation without any relation to H&S. Market stands at 5/8 Agreement right at MPR1. If this is just a retracement, MPR1 should hold it. Move above it will tell us that this is not just a bounce within a bear trend, this is something different. As you can see as price action on monthly time frame as depend on how market will response on this area. But market has just reached this level. To understand what will really happen here – we have to wait a bit and see how market will resonse on it. Thus, we can’t currently take any medium-term direction with conidence and build daily trading plan on it. Instead of that we probably should to trade some short-term setups here and there, until we will see more clarity. That is what we probably will try to do in the beginning of the next week.
Daily
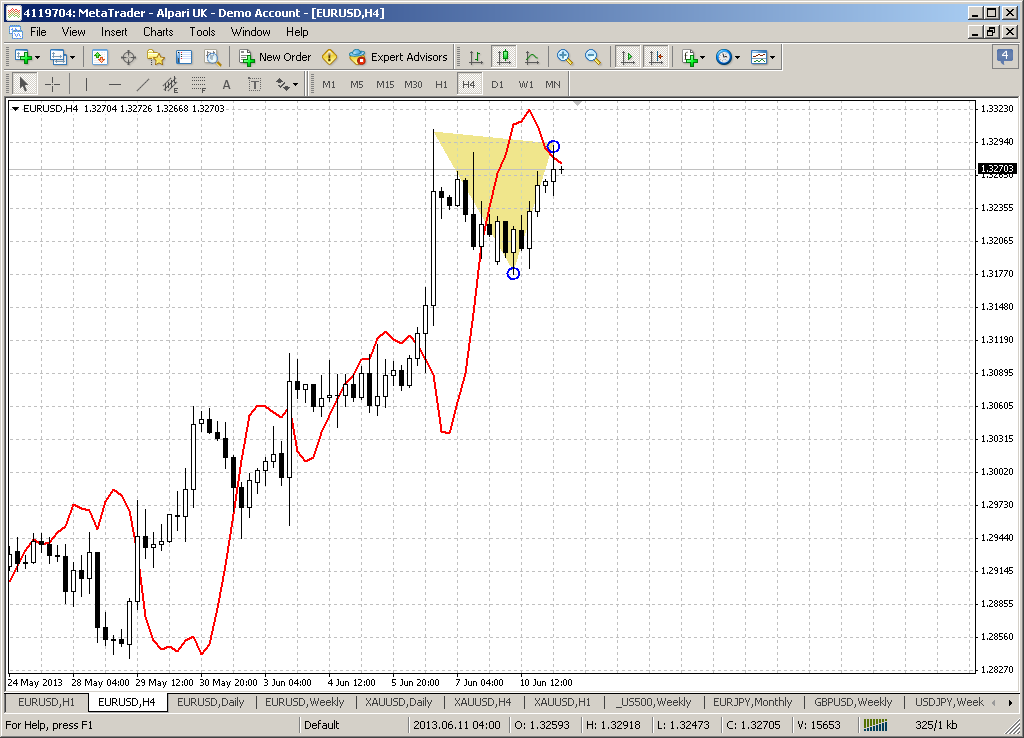
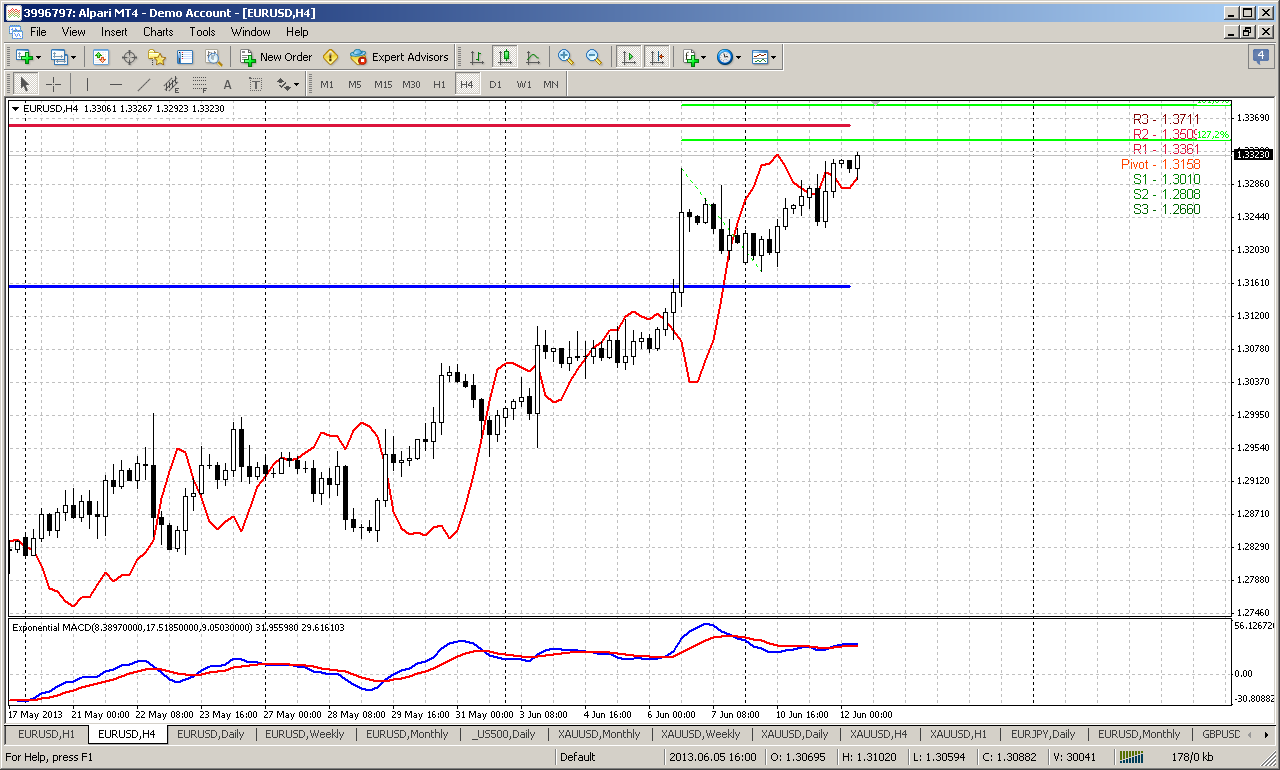
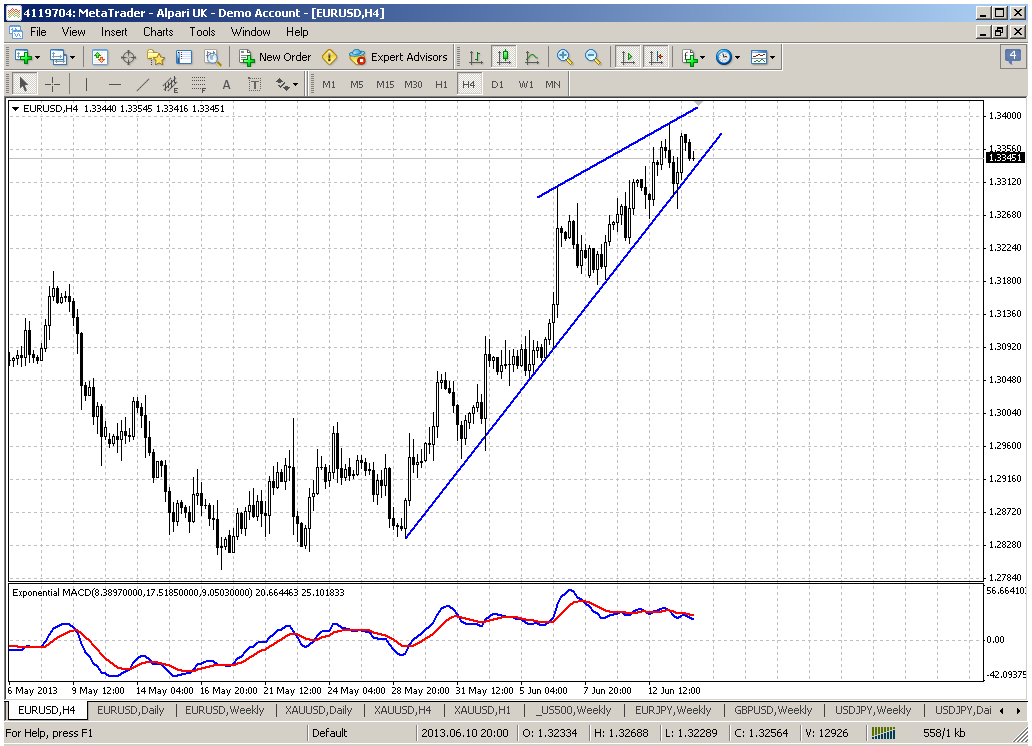
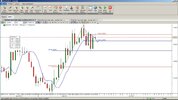
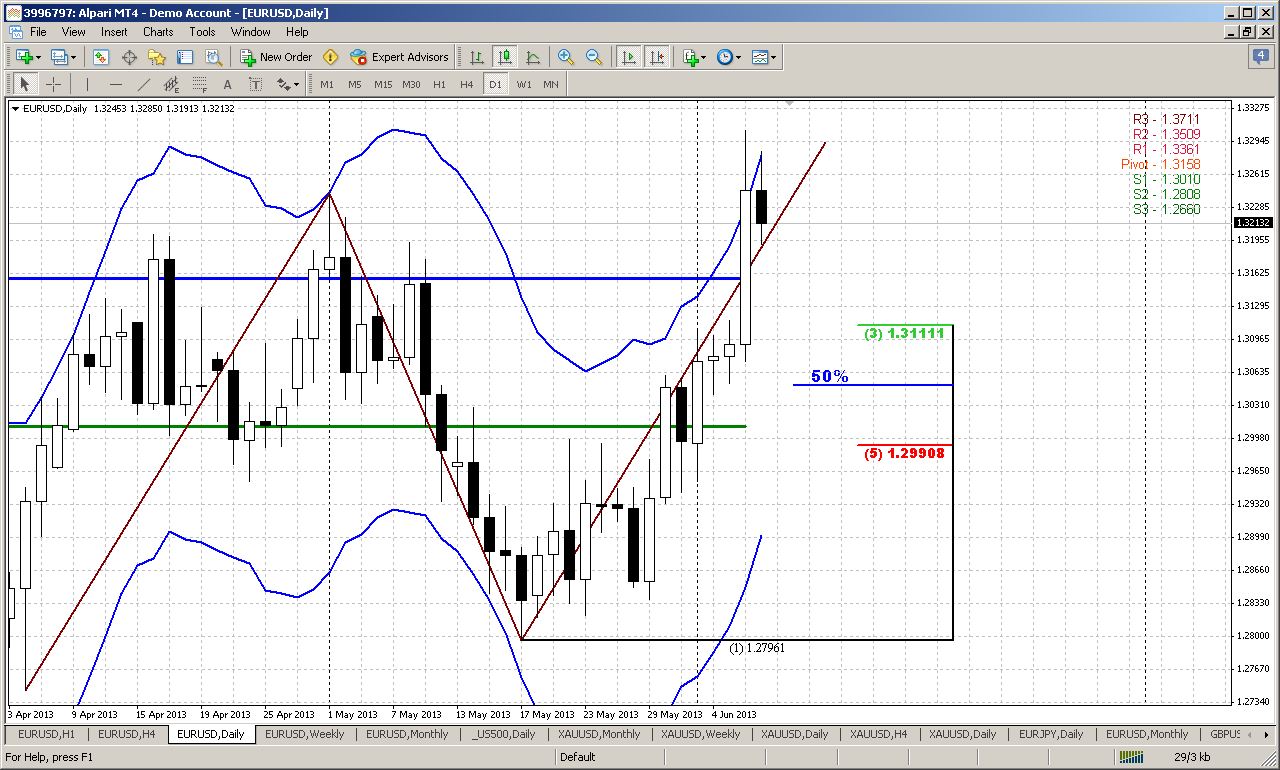
On daily time frame we have short-term bearish setup that is based on DiNapoli direction pattern and according DiNapoli framework “Direction overrules trend”. Trend is bullish here, as well as on weekly time frame. Setup consists of combination of strong resistance and overbought condition. This dreadful cocktail prevents market from immediate upward continuation. It does not mean the end of the trend, this is some kind of market’s temporary fatigue when it needs some rest. Usually it leads to downward retracement.
Even if we will take a look at current market excluding Stretch pattern, we will find a lot of other reasons to not enter long at least. Here we are at MPR1, AB-CD target, 5/8 daily resistance and daily overbought. It seems that it is not the time to enter long, although all trends are bullish.
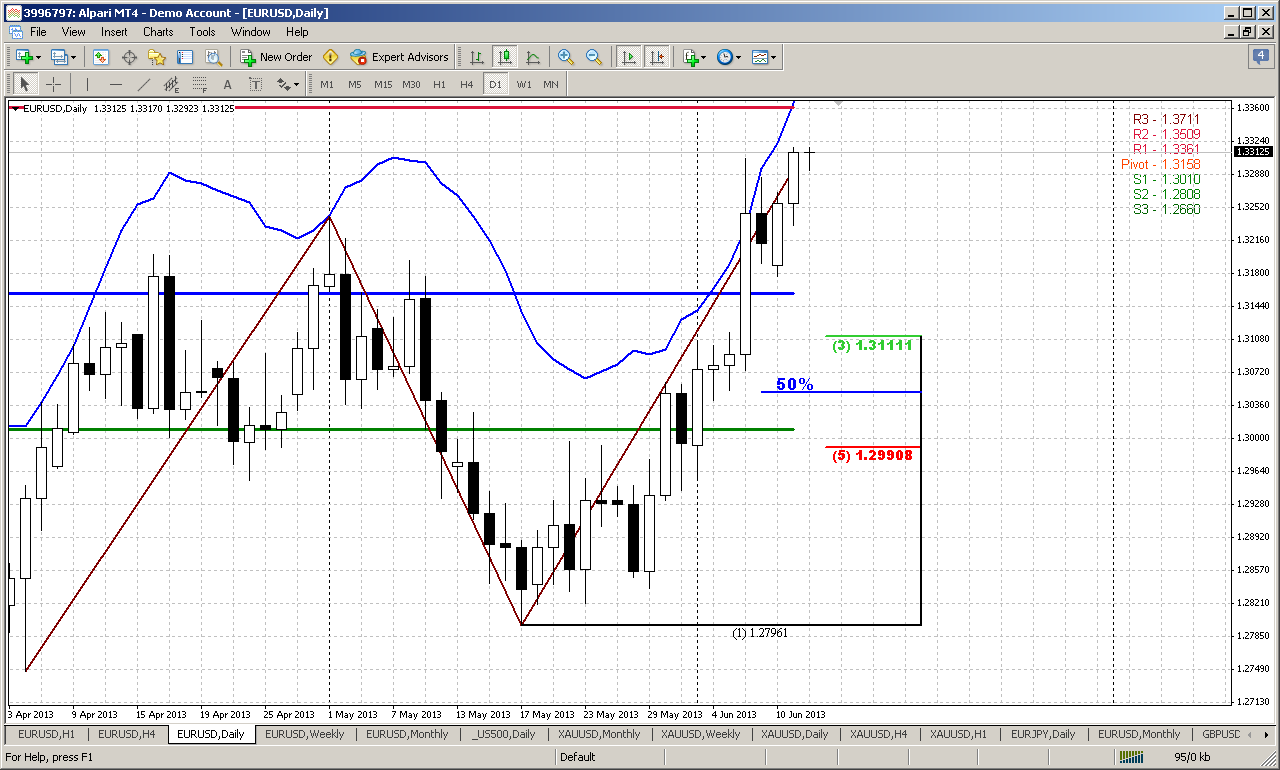
But what targets market could reach by this retracement? Based on Stretch pattern the target will be dynamic and theoretically it should be the middle between indicator blue bands. Currently this is somewhere around 1.3090 area. Based on AB-CD market can show any retracement, but since price has accelerated right to AB-CD target very often market shows 50%-61,8% retracement. For EUR 50% is more common as we already have seen many times. Pivot points assume retracement either to 1.3160 area where WPP stands or to WPS1 around 1.3010 – this is also between 50% and 61,8% Fib support.
So, as you can see – a lot of different destination points. As we do not have any patterns yet that can point the target with more precision, let’s be focused on major 3/8 level around 1.3110.
60-min
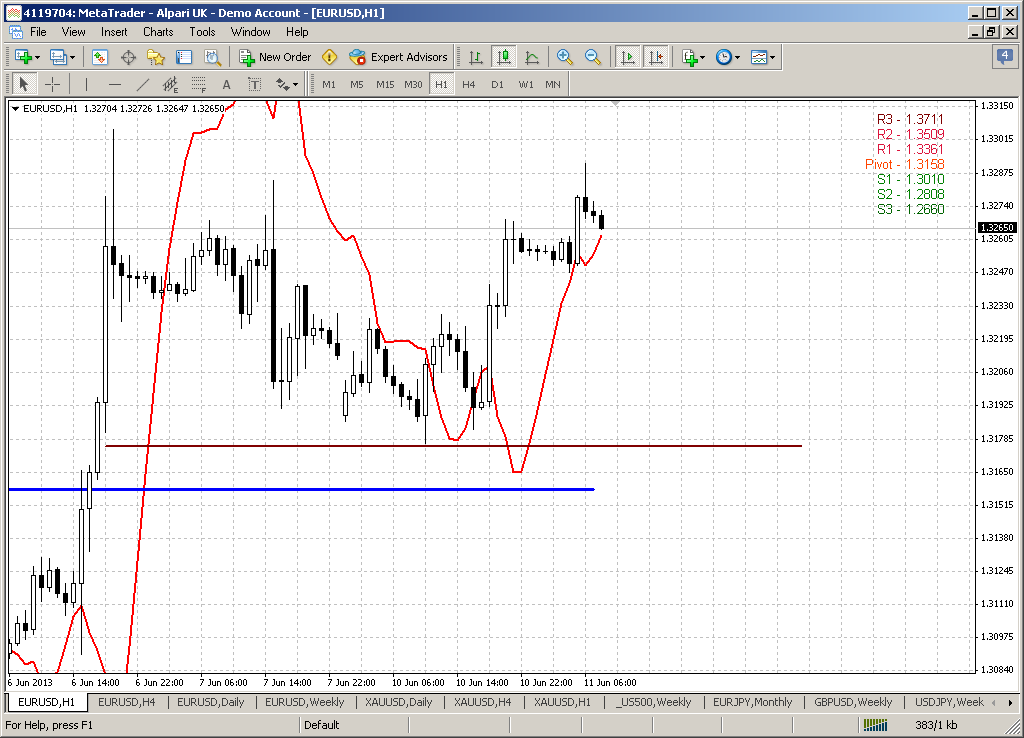
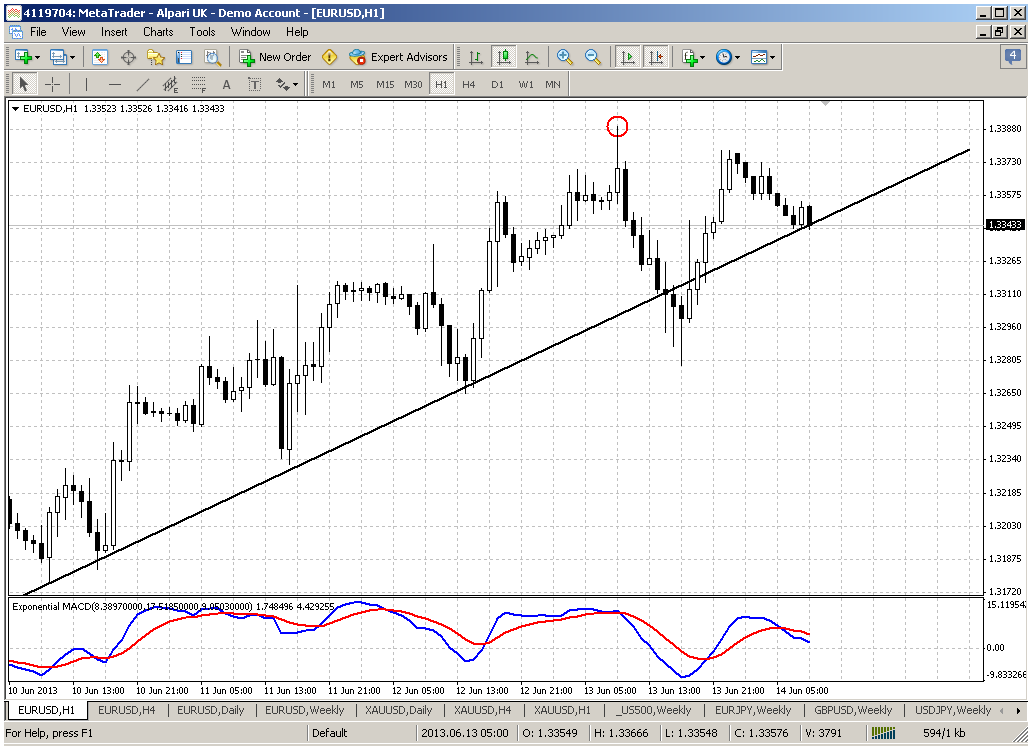
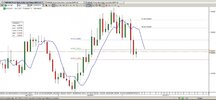
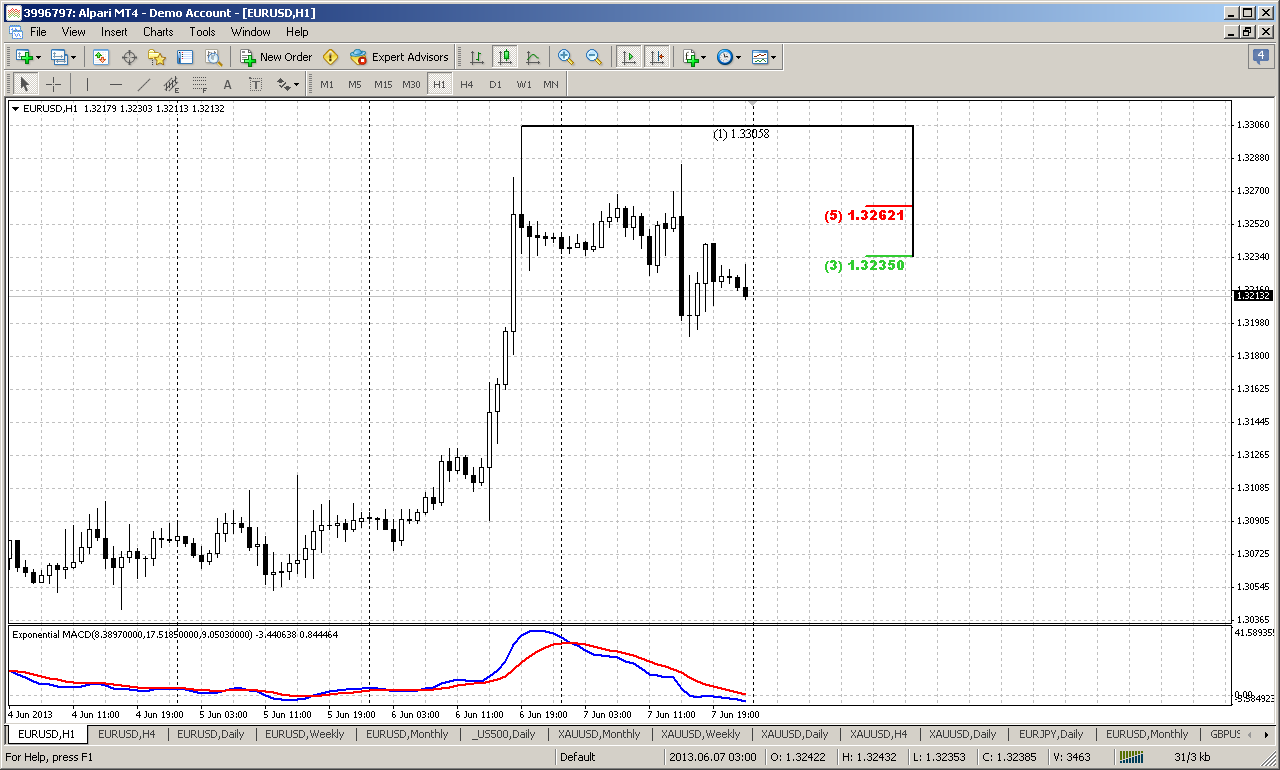
It would be perfect if market gives us some reversal pattern here, but unfortunately we do not have any right now. However, Stretch pattern suggests taking the retracement after trend shifting to bearish on lower time frame. Now we see that trend here and on 4-hour time frame has shifted to bearish. Hence we need to take short position at upward retracement. Currently market already has hit 3/8, but may it will show 5/8 as well. It will be perfect if this will be some pattern as well. The nearest target of this retracement is 1.31 area – major 3/8 support and previous consolidation on hourly chart.
Conclusion:
Speaking in 2 words, current moment is a time of expectation on big picture and trading of some short-term setup that market will deign to give us. This is mostly because market has reached significant level but didn’t show yet the attitude to it. That’s why we can’t make bet on any direction in long term. Also we do not have any long-term directional patterns. Situation will become clear soon, and we’ll get it, but time has not come yet.
That gives us no choices but stick with some short-term setups and patterns. On daily time frame we have “Stretch” that assumes short-term downward action with minimum target around 1.31 area. Let’s try to ride on it and later will take a look again how situation on big picture will change.
The technical portion of Sive's analysis owes a great deal to Joe DiNapoli's methods, and uses a number of Joe's proprietary indicators. Please note that Sive's analysis is his own view of the market and is not endorsed by Joe DiNapoli or any related companies.
Since the start of June we see pretty nice upward action. Market already has exceeded the highs of May. At the same time on big picture there is no drastical changes. Market is still forming bearish flag pattern and upward action stands inside of it. It is too far till the moment where we can say that bullish trend is back. Probably we could say that only if price will exceed previous highs around 1.3730 or at least will return right back to 50% resisatnce around 1.35 area.
Conversely bearish continuation needs to show shallower confirmations – will be enough, if market will break flag down and move below yearly pivot point. Perspectives of this potential action are really impressive. First road will be to 1.2150- 1.2330 Yearly pivot support 1 and all time 50% support. But next is 1.1650 – take a look, may be you also will find potential left wing of butterfly “Buy” here...
Current bounce up has taken place right from yearly pivot support. This is really long-term support and it rather strong, especially since it coincides with 50% Fib support, and market can’t still pass through it. In fact, moving below yearly pivot will give market the direction for the rest of the year – that’s why this level is significant.
Despite how bearish current price looks, we have one moment that rather contradictive and let us understand why we call current level as crucial. Take a look at second monthly chart.
Yes, this indeed could be reverse H&S pattern right at all time 50% support area, that market has touched in August of 2012. Although this pattern has appeared not quite after solid bearish trend, since EUR, in fact stands in wide range since 2007-2008, but it has very nice harmony – head stands precisely at 1.618 of both shoulders. As we treat weekly action as H&S, although it stands in the middle of some price action, we also can treat this pattern as reverse H&S. The classical confirmation of this pattern will be at neckline breakout around 1.3750. But even before that, the way how market will deal with current bearish flag will be very important. Upward breakout could become a first bell of further continuation.
Weekly
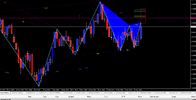
The weekly time frame has it’s own truth and problems, since here we have another pattern that stands opposite to monthly potential reverse H&S and price stands at strong resistance at the top of right shoulder. So, maximum retracement that is acceptable for H&S pattern has happened. This is AB=CD type of action. Any upward continuation will mean the breaking of H&S harmony. I do not want to say that if market will coil around for 1-2 weeks with shy exceeding of current highs – that’s OK. I’m talking about real upward continuation above 1.3350 area. Even if we will take a look at this situation without any relation to H&S. Market stands at 5/8 Agreement right at MPR1. If this is just a retracement, MPR1 should hold it. Move above it will tell us that this is not just a bounce within a bear trend, this is something different. As you can see as price action on monthly time frame as depend on how market will response on this area. But market has just reached this level. To understand what will really happen here – we have to wait a bit and see how market will resonse on it. Thus, we can’t currently take any medium-term direction with conidence and build daily trading plan on it. Instead of that we probably should to trade some short-term setups here and there, until we will see more clarity. That is what we probably will try to do in the beginning of the next week.
Daily
On daily time frame we have short-term bearish setup that is based on DiNapoli direction pattern and according DiNapoli framework “Direction overrules trend”. Trend is bullish here, as well as on weekly time frame. Setup consists of combination of strong resistance and overbought condition. This dreadful cocktail prevents market from immediate upward continuation. It does not mean the end of the trend, this is some kind of market’s temporary fatigue when it needs some rest. Usually it leads to downward retracement.
Even if we will take a look at current market excluding Stretch pattern, we will find a lot of other reasons to not enter long at least. Here we are at MPR1, AB-CD target, 5/8 daily resistance and daily overbought. It seems that it is not the time to enter long, although all trends are bullish.
But what targets market could reach by this retracement? Based on Stretch pattern the target will be dynamic and theoretically it should be the middle between indicator blue bands. Currently this is somewhere around 1.3090 area. Based on AB-CD market can show any retracement, but since price has accelerated right to AB-CD target very often market shows 50%-61,8% retracement. For EUR 50% is more common as we already have seen many times. Pivot points assume retracement either to 1.3160 area where WPP stands or to WPS1 around 1.3010 – this is also between 50% and 61,8% Fib support.
So, as you can see – a lot of different destination points. As we do not have any patterns yet that can point the target with more precision, let’s be focused on major 3/8 level around 1.3110.
60-min
It would be perfect if market gives us some reversal pattern here, but unfortunately we do not have any right now. However, Stretch pattern suggests taking the retracement after trend shifting to bearish on lower time frame. Now we see that trend here and on 4-hour time frame has shifted to bearish. Hence we need to take short position at upward retracement. Currently market already has hit 3/8, but may it will show 5/8 as well. It will be perfect if this will be some pattern as well. The nearest target of this retracement is 1.31 area – major 3/8 support and previous consolidation on hourly chart.
Conclusion:
Speaking in 2 words, current moment is a time of expectation on big picture and trading of some short-term setup that market will deign to give us. This is mostly because market has reached significant level but didn’t show yet the attitude to it. That’s why we can’t make bet on any direction in long term. Also we do not have any long-term directional patterns. Situation will become clear soon, and we’ll get it, but time has not come yet.
That gives us no choices but stick with some short-term setups and patterns. On daily time frame we have “Stretch” that assumes short-term downward action with minimum target around 1.31 area. Let’s try to ride on it and later will take a look again how situation on big picture will change.
The technical portion of Sive's analysis owes a great deal to Joe DiNapoli's methods, and uses a number of Joe's proprietary indicators. Please note that Sive's analysis is his own view of the market and is not endorsed by Joe DiNapoli or any related companies.