Sive Morten
Special Consultant to the FPA
- Messages
- 18,695
Monthly
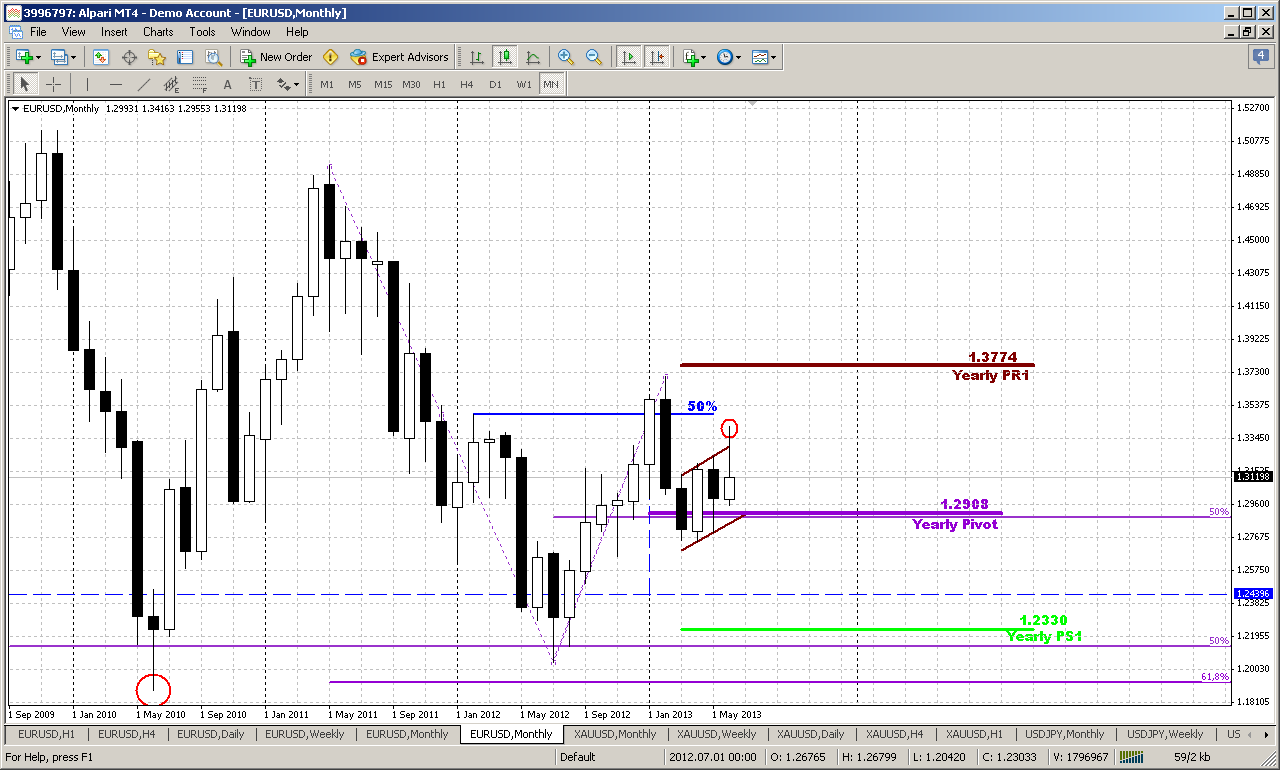
Action on lower time frames was so significant that even has made an imact on monthly time frame as well. Since this market move is based on fundamental data and mostly was triggered by Fed sentiment changing concerning US economy growth, QE program and inflation – we can’t treat it as occasional and short-term. Probably it will have some lasting impact on medium-term perspectives on EUR. Since previous EUR analysis we’ve made two weeks aho, I will remind you that by those moment, situation was unclear and we wasn’t able to estimate clearly – wether we should rely on possible AB-CD down here and weekly H&S pattern or start to preparation for solid upmove on potential reverse H&S pattern here, on monthly. And our conclusiong was – “it’s all about the flag”. Depending on breakout direction – further action will follow. And now we have significant moment here.
Till the end of June is only single week rest. Major events of June have taken place already and hardly market will show some drastical changes and unexpected reversal. Hence, there is a great probability that market will close somewhere around and inside flag body. What does this give us? Very significant bearish pattern – bullish trap or fake upward flag breakout. By classical school of technical analysis this should lead to oposite real breakout, i.e. downside. If this really will be the case, then minimum target will be area around Yearly Pivot support 1 and preavious lows 1.2150-1.23. But potentially this probably will trigger downward action by huge AB=CD pattern that has minor 0.618 target and will challenge 1.1875 lows around all time major 50% support. AS you can see, any big thing starts with small one. With this flag breakout failure we have bearish long-term context, I suppose.
Weekly
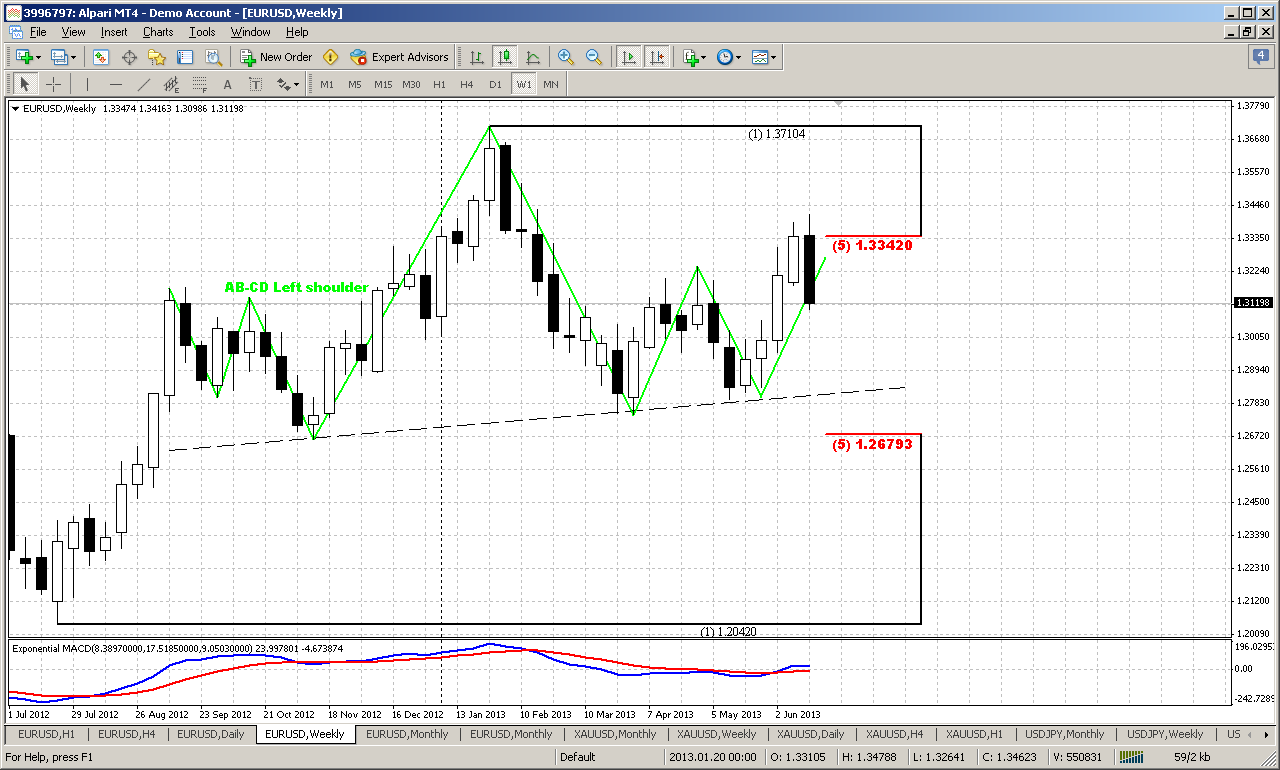
Here, guys you probably see everything by yourself. We’ve said many times that weekly time frame is a big scale and we have to wait a bit, since 50 or even 100 pips above resistance does not mean yet that level has been broken already. Now we have perfect bearish engulfing pattern right around 5/8 resistance. That is our foundation for trading by far. If we will take a look at this pattern wider we will see that it stands right at top of H&S pattern, could become a trigger for downward action and holds the harmony of this pattern. Take a look, left shoulder also has mirror AB-CD shape. This H&S pattern looks very attractive. The target of this pattern will challenge the lows of 1.18 area as well. You may object that this pattern is too obvious and I agree with you, but we do not intend to trade by using H&S rules – placing stops above the head, wait breakout of neckline and so on. We will use H&S only as our beacon for long term target but our trading foundation is engulfing pattern. It has significantly closer invalidation point and it is easier to trade it. Besides we will try to do our best still to minimize potential risks.
And finally think about this pattern in link with failure flag breakout on monthly chart. Appearing of bearish engulfing drastically reduces the odds of upward reversal and continuation. The target of this pattern stands round neckline of H&S. Usually market shows some retracement back inside the body of the pattern. We should catch it to enter short probably. And now is most interesting – I suggest that this retracement will take shape of our daily B&B “Buy”.
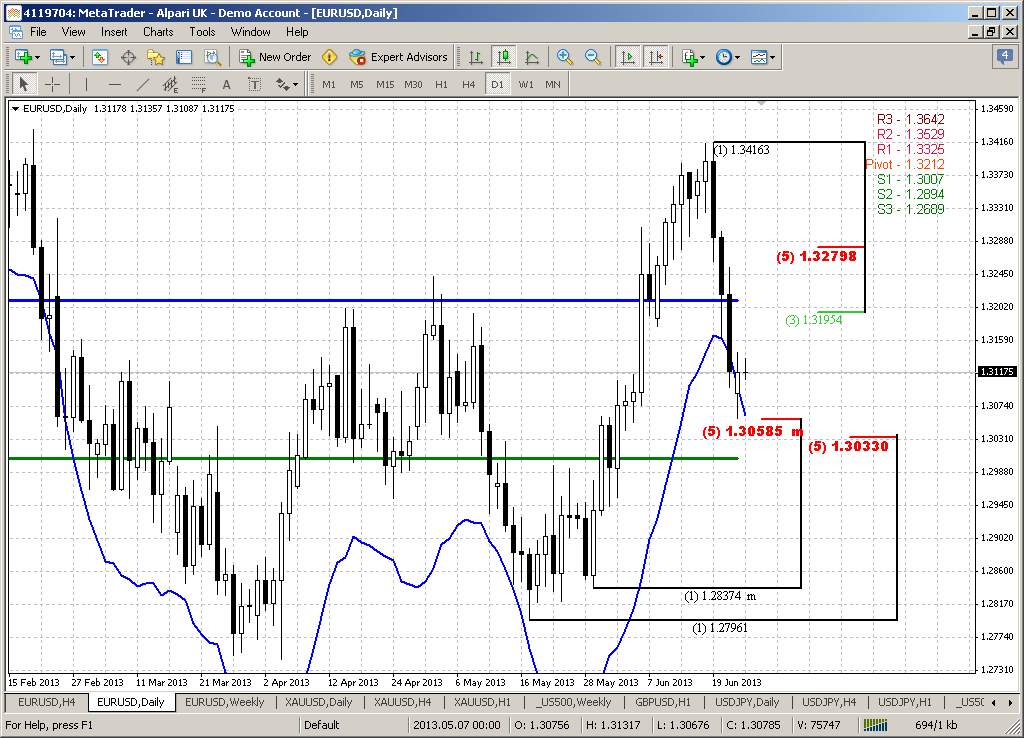
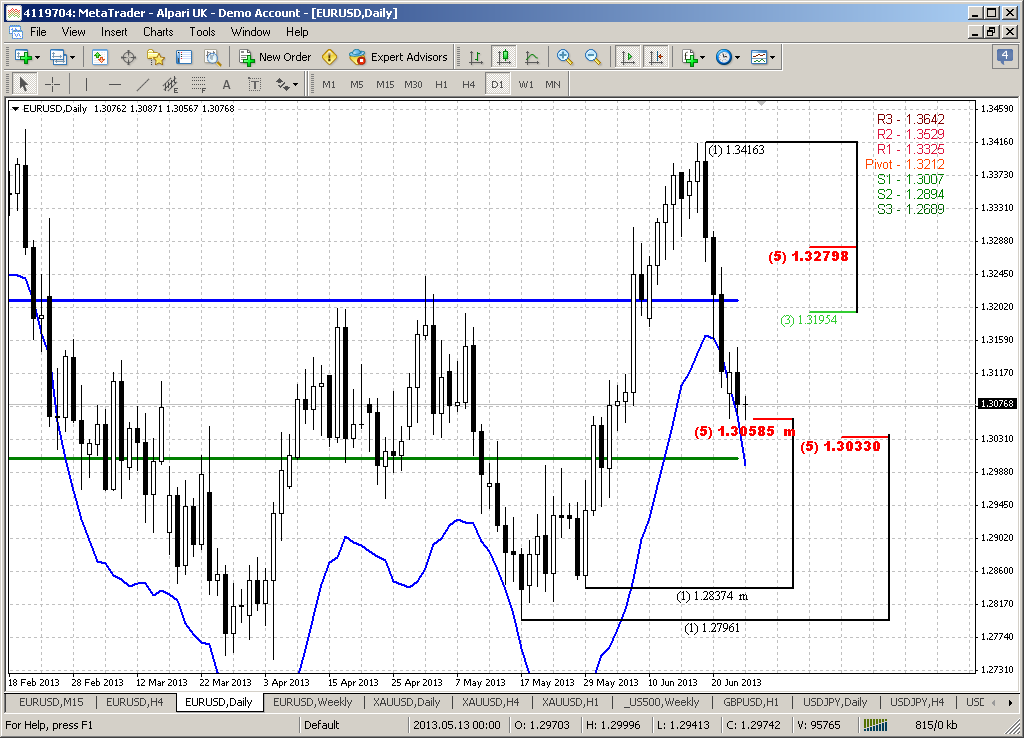
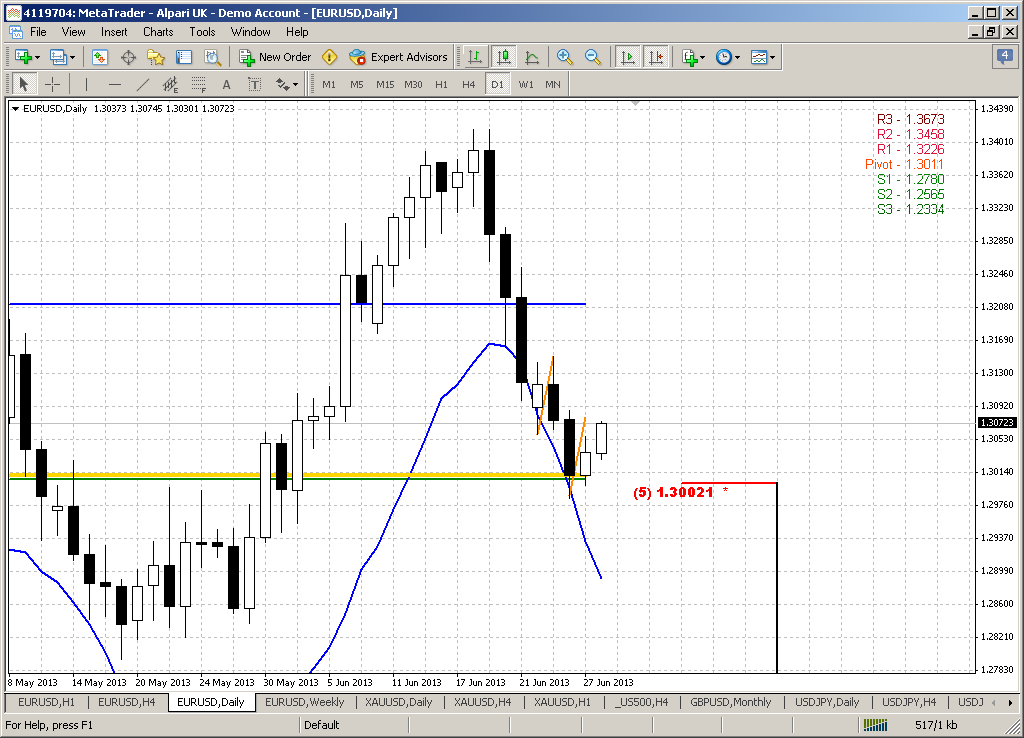
Daily
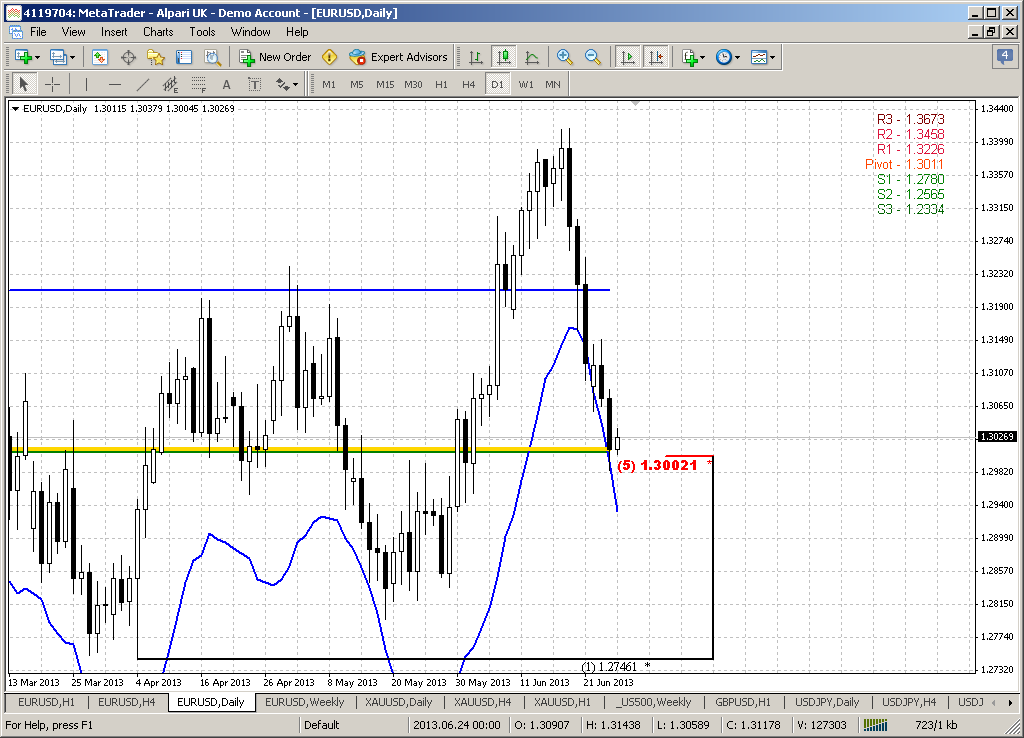
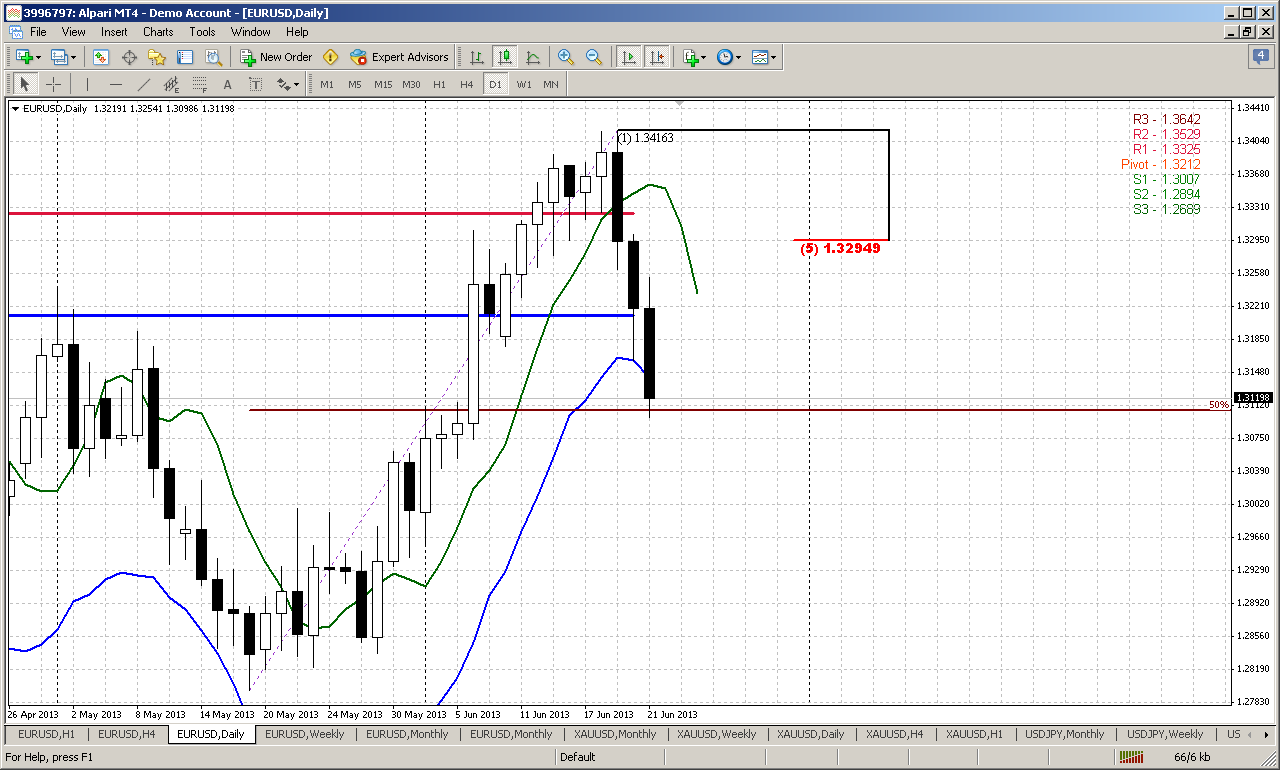
Here is completed setup for B&B “Buy” and take a look - again 50% retracement. This is just unbelievable how EUR likes it. So we have thrust up, crossing of 3x3 DMA (green line) and three closes below it. By third candle market has hit 50% major support. Market also stands at oversold now. Although initial plan of Friday was trying to take long on retracement, since market has started to show bounce up from support of similar quality, but this attempt has failed. That is the most difficult moment in trading B&B’s – estimate the level that will become a foundation for upward retracement. But now we have no alternatives, since that was third close below 3x3, and at least theoretically – market either has to start retracement by B&B setup or B&B will fail. This is sometimes happens, although rather rare. Theoretical minimum target of this pattern is 5/8 resistance – 1.3295. Still, I can’t exclude that market could reach only 50% resistance again by three reasons. First is – as we can see EUR likes 50% levels, second – we have a deal with weekly perfect bearish engulfing pattern and 61.8% could be too extended for this pattern and finally third – take careful look at current move down. It reminds me “three black crows” pattern. It is very rare and strong, although here it is not perfect, since second candle has too long lower shadow. May be market will reach 5/8 since it is oversold significantly, but keep an eye on price when it will hit 50% resistance. It makes sense to take some profit there. Now we need reversal pattern on intraday chart to understand where to take long position and where to place stop.
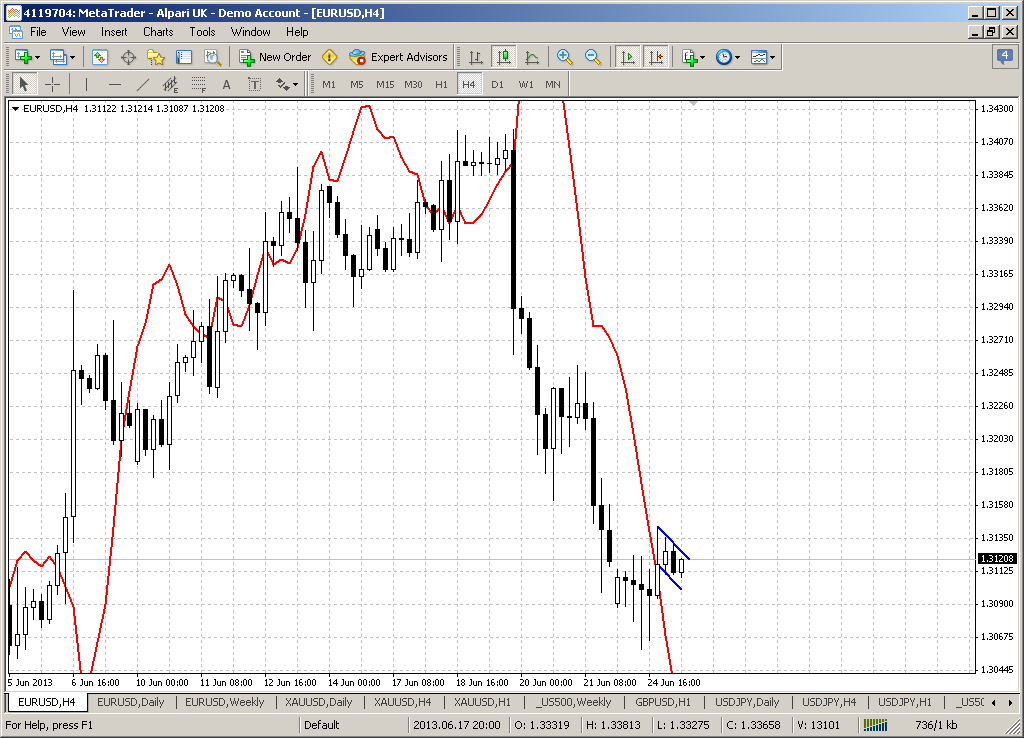
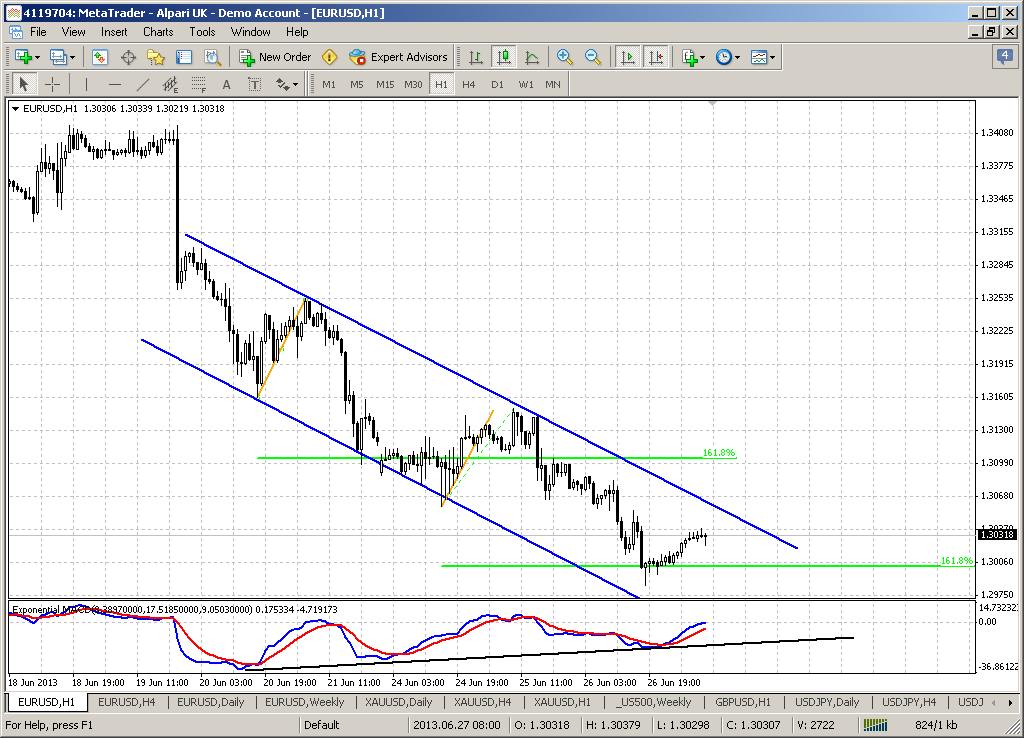
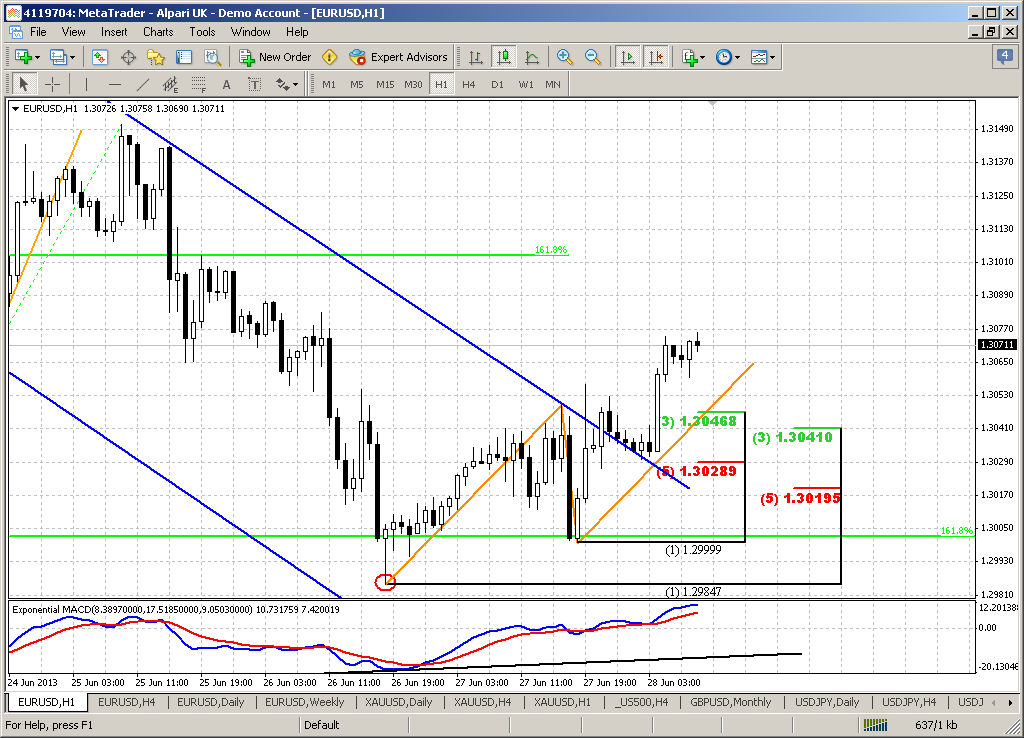
60-min
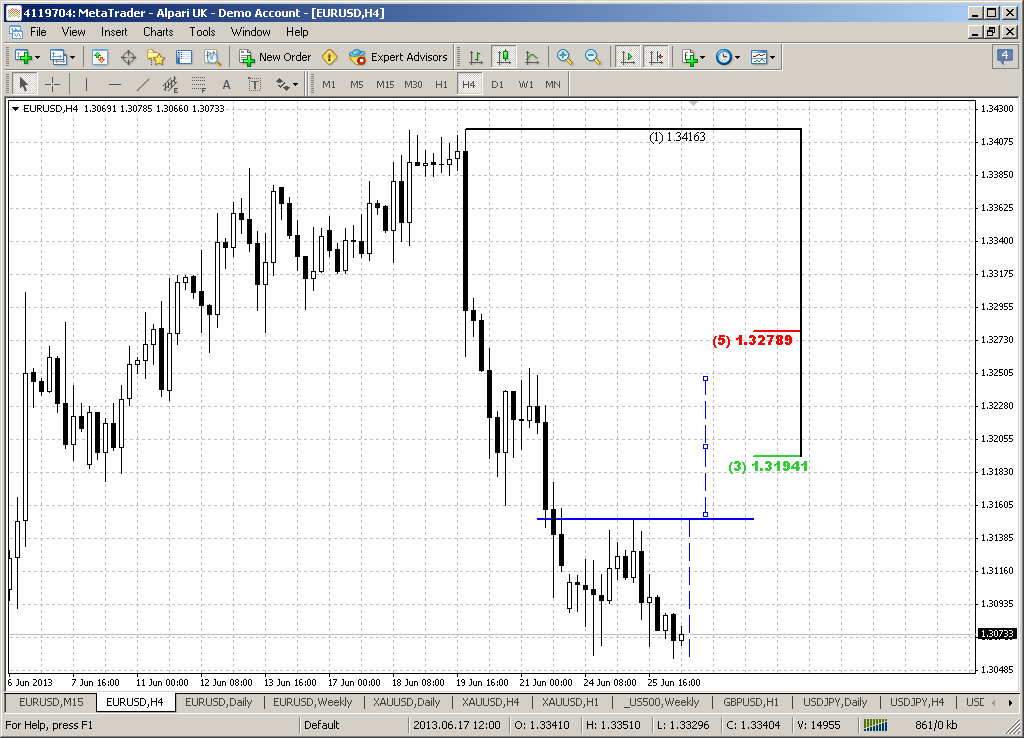
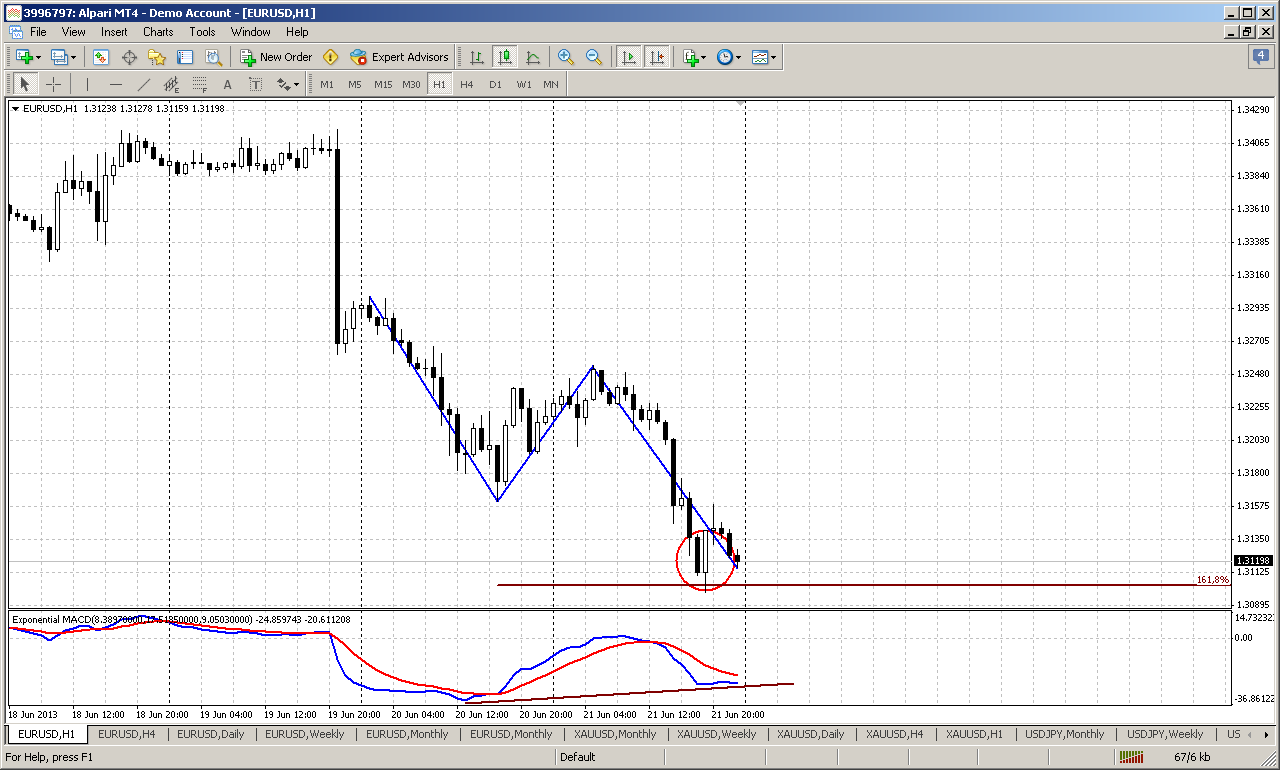
Well, there is a situation when it is not simple decision how to take position, but sometimes this happens. The problem is that we do not have solid reversal patterns. All that we have as confirmation of possible bounce up is perfect AB=CD, bullish MACD divergence that has not quite formed yet and bullish engulfing pattern right at target of AB-CD. Besides, currently price already shows some retracement inside of it’s body.
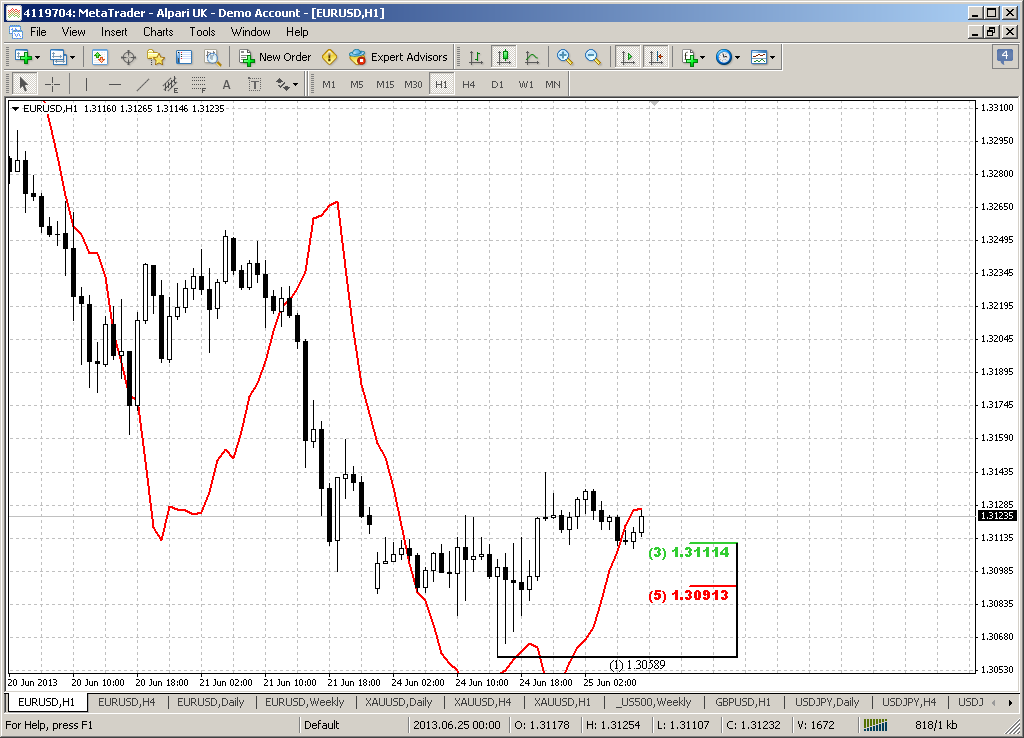
Here is agressive tactics by taking long position. It will give you perfect entry point but has greater probability of loss.We can try to take long position based on this engulfing. But where to place stop? Well, as EUR harmonic swing approximately equals 40 pips and low of engulfing is 1.3198 – stop should be placed somewhere around 1.3158. We can place tigher stop right below engulfing, but we can’t exclude possibility of DRPO “Buy” pattern here and it can show slightly lower lows – it could be seen better on 30-min chart. As market will start move higher – stop should be moved tighter.
Conservative tactics suggests waiting, when trend will shift to bullish here and then try to enter at retracement by using DiNapoli Minesweeper technic. We have described it in previous researches. If you will take a careful look at hourly chart, then you will see that current low stands at 1.618 extension of previous retracement up. It means that appearing of reversal H&S pattern is possible. It’s neckline stands at 50% resistance by the way around 1.3250 and it’s minimum target as mirror AB=CD to the upside coinsides with daily B&B target – 1.3295 area. That’s being said – that’s the riddle for you. But you can use combined entry as well.
Conclusion:
Current move down could have significant consecutives in long-term perspectives since it could become a trigger for long-term bear trend continuation and lead EUR to 1.18 area.
Shorter-term analysis points on possible reaching of previous lows around 1.28 area after bounce up, that could take a shape of daily B&B “Buy” setup. So, our medium-term trading plan is try to ride on B&B first, turn position down and join with downward party to 1.18 second.
The technical portion of Sive's analysis owes a great deal to Joe DiNapoli's methods, and uses a number of Joe's proprietary indicators. Please note that Sive's analysis is his own view of the market and is not endorsed by Joe DiNapoli or any related companies.
Action on lower time frames was so significant that even has made an imact on monthly time frame as well. Since this market move is based on fundamental data and mostly was triggered by Fed sentiment changing concerning US economy growth, QE program and inflation – we can’t treat it as occasional and short-term. Probably it will have some lasting impact on medium-term perspectives on EUR. Since previous EUR analysis we’ve made two weeks aho, I will remind you that by those moment, situation was unclear and we wasn’t able to estimate clearly – wether we should rely on possible AB-CD down here and weekly H&S pattern or start to preparation for solid upmove on potential reverse H&S pattern here, on monthly. And our conclusiong was – “it’s all about the flag”. Depending on breakout direction – further action will follow. And now we have significant moment here.
Till the end of June is only single week rest. Major events of June have taken place already and hardly market will show some drastical changes and unexpected reversal. Hence, there is a great probability that market will close somewhere around and inside flag body. What does this give us? Very significant bearish pattern – bullish trap or fake upward flag breakout. By classical school of technical analysis this should lead to oposite real breakout, i.e. downside. If this really will be the case, then minimum target will be area around Yearly Pivot support 1 and preavious lows 1.2150-1.23. But potentially this probably will trigger downward action by huge AB=CD pattern that has minor 0.618 target and will challenge 1.1875 lows around all time major 50% support. AS you can see, any big thing starts with small one. With this flag breakout failure we have bearish long-term context, I suppose.
Weekly
Here, guys you probably see everything by yourself. We’ve said many times that weekly time frame is a big scale and we have to wait a bit, since 50 or even 100 pips above resistance does not mean yet that level has been broken already. Now we have perfect bearish engulfing pattern right around 5/8 resistance. That is our foundation for trading by far. If we will take a look at this pattern wider we will see that it stands right at top of H&S pattern, could become a trigger for downward action and holds the harmony of this pattern. Take a look, left shoulder also has mirror AB-CD shape. This H&S pattern looks very attractive. The target of this pattern will challenge the lows of 1.18 area as well. You may object that this pattern is too obvious and I agree with you, but we do not intend to trade by using H&S rules – placing stops above the head, wait breakout of neckline and so on. We will use H&S only as our beacon for long term target but our trading foundation is engulfing pattern. It has significantly closer invalidation point and it is easier to trade it. Besides we will try to do our best still to minimize potential risks.
And finally think about this pattern in link with failure flag breakout on monthly chart. Appearing of bearish engulfing drastically reduces the odds of upward reversal and continuation. The target of this pattern stands round neckline of H&S. Usually market shows some retracement back inside the body of the pattern. We should catch it to enter short probably. And now is most interesting – I suggest that this retracement will take shape of our daily B&B “Buy”.
Daily
Here is completed setup for B&B “Buy” and take a look - again 50% retracement. This is just unbelievable how EUR likes it. So we have thrust up, crossing of 3x3 DMA (green line) and three closes below it. By third candle market has hit 50% major support. Market also stands at oversold now. Although initial plan of Friday was trying to take long on retracement, since market has started to show bounce up from support of similar quality, but this attempt has failed. That is the most difficult moment in trading B&B’s – estimate the level that will become a foundation for upward retracement. But now we have no alternatives, since that was third close below 3x3, and at least theoretically – market either has to start retracement by B&B setup or B&B will fail. This is sometimes happens, although rather rare. Theoretical minimum target of this pattern is 5/8 resistance – 1.3295. Still, I can’t exclude that market could reach only 50% resistance again by three reasons. First is – as we can see EUR likes 50% levels, second – we have a deal with weekly perfect bearish engulfing pattern and 61.8% could be too extended for this pattern and finally third – take careful look at current move down. It reminds me “three black crows” pattern. It is very rare and strong, although here it is not perfect, since second candle has too long lower shadow. May be market will reach 5/8 since it is oversold significantly, but keep an eye on price when it will hit 50% resistance. It makes sense to take some profit there. Now we need reversal pattern on intraday chart to understand where to take long position and where to place stop.
60-min
Well, there is a situation when it is not simple decision how to take position, but sometimes this happens. The problem is that we do not have solid reversal patterns. All that we have as confirmation of possible bounce up is perfect AB=CD, bullish MACD divergence that has not quite formed yet and bullish engulfing pattern right at target of AB-CD. Besides, currently price already shows some retracement inside of it’s body.
Here is agressive tactics by taking long position. It will give you perfect entry point but has greater probability of loss.We can try to take long position based on this engulfing. But where to place stop? Well, as EUR harmonic swing approximately equals 40 pips and low of engulfing is 1.3198 – stop should be placed somewhere around 1.3158. We can place tigher stop right below engulfing, but we can’t exclude possibility of DRPO “Buy” pattern here and it can show slightly lower lows – it could be seen better on 30-min chart. As market will start move higher – stop should be moved tighter.
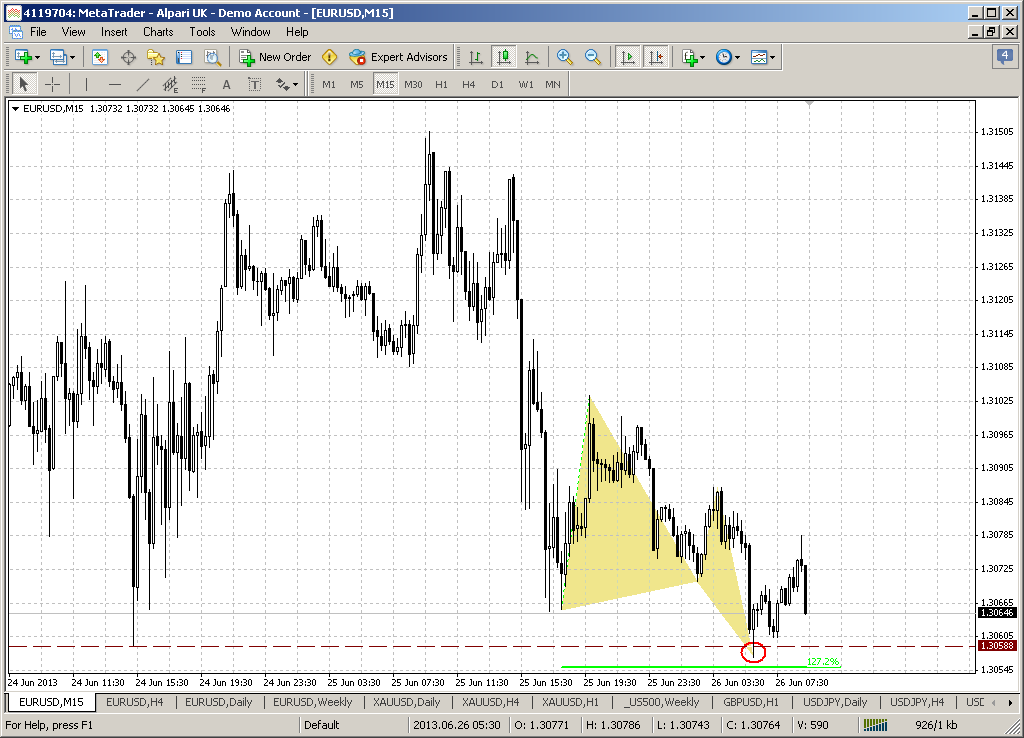
Conservative tactics suggests waiting, when trend will shift to bullish here and then try to enter at retracement by using DiNapoli Minesweeper technic. We have described it in previous researches. If you will take a careful look at hourly chart, then you will see that current low stands at 1.618 extension of previous retracement up. It means that appearing of reversal H&S pattern is possible. It’s neckline stands at 50% resistance by the way around 1.3250 and it’s minimum target as mirror AB=CD to the upside coinsides with daily B&B target – 1.3295 area. That’s being said – that’s the riddle for you. But you can use combined entry as well.
Conclusion:
Current move down could have significant consecutives in long-term perspectives since it could become a trigger for long-term bear trend continuation and lead EUR to 1.18 area.
Shorter-term analysis points on possible reaching of previous lows around 1.28 area after bounce up, that could take a shape of daily B&B “Buy” setup. So, our medium-term trading plan is try to ride on B&B first, turn position down and join with downward party to 1.18 second.
The technical portion of Sive's analysis owes a great deal to Joe DiNapoli's methods, and uses a number of Joe's proprietary indicators. Please note that Sive's analysis is his own view of the market and is not endorsed by Joe DiNapoli or any related companies.