Sive Morten
Special Consultant to the FPA
- Messages
- 18,760
Fundamentals
Reuters reports the dollar index ended little changed on Friday as it stayed on track for a record eighth month of gains on improving U.S. data and comments from Federal Reserve officials that bolstered bets for a interest rate rise later this year.
This measure of the greenback against the euro, yen and four other currencies was set to mark its longest streak of monthly gains since the greenback was floated as a fiat currency in 1971. February's gain of about 0.52 percent, however, was the smallest of the eight months.
The dollar overcame earlier month-end selling that followed a rally on Thursday, as more evidence suggested the U.S. economy will expand in the coming months.
"The trend is still in place to support the dollar," said Eric Viloria, currency strategist at Wells Fargo Securities in New York.
The government said on Friday it downgraded fourth-quarter U.S. gross domestic product growth to a 2.2 percent annual pace from an initial estimate of 2.6 percent. Economists polled by Reuters forecast a revision down to 2.1 percent.
better-than-expected reading coincided with encouraging U.S. pending home sales and consumer sentiment figures, though a surprise drop in a private index on U.S. Midwest business activity to its weakest since July 2009 revived some worries about slowing U.S. growth.
Amid this backdrop of moderate economic expansion, the Federal Reserve has shown it would be "patient" on ending its near-zero interest rate policy. Fed Chair Janet Yellen reiterated this stance at her semiannual testimony before Congress this week.
Other top U.S. central bank officials signaled the Fed's path towards normalizing monetary policy remains on track for later this year, but the pace of rate increases will likely be gradual as inflation has been stuck below the Fed's 2 percent target.
CFTC data shows decreasing of open interest. Probably investors have closed some positions on Greece uncertainty. On previous week CFTC shows contraction as long as short positions. At the same time long positions shows solid long-term drop and right now speculative shorts stand for 214’901 vs. longs of 41’400. Thus, our ratio stands at 83,84% and in general stands at numbers when market will need some pause or pullback to reduce this number.
Open interest:
 Shorts:
 Longs:

So, guys, each week brings its own concerns and tensions. Thus, in financial sphere it is not quite clear what will happen around Greece. After brave rhetoric before election Syriza has met with reality after elections and now they understand that they have to search for compromises on debt problem. Otherwise it could lead to negative consequences for economy. At the same time Greek people and government understand that after joining EU they were deprived of financial independence and do not control financial system of the country since they can’t print money and regulate liquidity. It seems that there is some red line exists in Greek patience, Greeks demand equity and if they will see that EU bureaucrats do not want to hear anything – this could provoke drastical steps, although chances of this event are not significant. Right now parties have come to agreement, but this agreement mostly tactical and Greece continues to think on strategical exit from difficult economical situation. Obviously it is not a solution - increase short-term burden every time to support short-term liquidity.
In geopolicy situation is far from prosperity. At first glance we see some chill out in Ukraine, but many experts think that this is temporal. At the same time, US tends to create a circle of instability around Russia, since Nulland has started round trip across Russian Asian borders to Armenia, Azerbaijan, Georgia and Turkmenistan. Recent statements from leaders of these countries and observation of experts suggests that main target of this trip is start the same process in these countries that were made in Ukraine. Thus opposition significantly activated in Armenia. As you know, Armenia has old conflict with Azerbaijan on Nagorny Karabakh. In Kazakhstan were appointed President’s early elections. That’s just few issues and probably we will know more in nearest time.
Meantime, despite on complex situation our analysis mostly will be technical on current week.
Technicals
Monthly
So dynamic in last few weeks was mostly flat and accelerated only yesterday. February yet is inside month but January was dreadful month for EUR. We have plunge that we haven’t seen since 2008 crisis. Now euro stands at the eve of most interesting action. I do not know what we will get later, but monthly chart looks very cool. You, guys, probably see everything by yourself already. Yes, EUR has passed through YPP and YPS1 with a blink of an eye – it needs just 3 weeks to pass through yearly barrier. But right now currency stands at rock hard support area – monthly oversold, major 5/8 Fib level, AB=CD target and 1.27 extension target. It should be upside retracement, guys!!! It needs absolutely unprecedented power to push EUR lower. It is interesting that all four recent legs down have approximately the same length. So, it seems that EUR is also at the peak of harmonic swing.
At the same time after retracement (if it will happen of cause) downward action will continue. EUR has dropped to 1.27 butterfly target too fast. Odds suggest continuation to 1.618 extension. By the way, the same suggestion we could make based on AB-CD. CD leg is also too fast. But where does it stand? Right – at 1.0 point, parity. Bingo… This will be next destination point when and if market will pass through 1.11-1.12 area. Also we need to say that we knew about 1.11-1.12 and we have discussed it here and even pointed on it as possible “long-term” target. But it has appeared that it is not “long-term”. That’s why we’re talking of scale increasing on EUR. Right now EUR passes for week distances that previously it has passed for months. The cornerstone for EUR perspective will remain US fundamental data. Recently data mostly was supportive for US dollar appreciation. Meantime, market obviously is overextended to the downside and needs technical retracement. This is also confirmed by CFTC speculative ratio. Thus, we should be very sensitive to any sign of retracement or reversal patterns on lower time frames.

Weekly
Potentially weekly chart could give us DRPO “Buy” as conditions for upside retracement exist as technically as from speculative positions point of view. Meantime market could move 100 pips lower to 1.1030 area, because monthly butterfly target stands slightly lower compares to current price level. This in turn, could lead to appearing of perfect weekly DRPO “Buy” pattern.
On previous weeks market has failed to return back above YPS1 and MPP. Here I’ve chosen minimum target of 50% resistance from most recent thrust down. This level also will be accompanied by weekly overbought. Let’s initially focus on this level of 1.20 area as potential target. Currently it is difficult to find reasons for stronger upside action, but thrust itself is suitable for DRPO right from beginning, I mean 1.39 area. And theoretically it is possible that retracement could be even to 1.30 area. It will not be straight of cause, but technically there is now flaws in context that could point that this is impossible. Still, let’s move step by step and first will watch for 1.20. Even this level is very significant target.

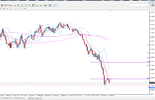
Daily
Trend on daily chart has turned bearish. This picture shows how precisely market could reach 1.1030 area. Market could form 1.27 Butterfly “buy”. Although it has even lower target, but for weekly chart this is acceptable variation. Currently it is difficult to suggest how market will behave around MPS1, but probably it will be possible to show some spike down to reach butterfly target. So, our context is becoming clear: market at rock hard monthly support, speculative positions bearishly overextended a bit, weekly chart could form DRPO pattern and daily butterfly could become a pattern that particularly will be final pattern of weekly DRPO.

4-Hour
As we think that right wing of butterfly already stands in progress – EUR should not show too deep upside bounce. Still, we have new MPP for March and we know that market in most cases tries to test it within a month. Thus, if upside retracement will happen – we hope that it will stop around 1.13 area. This is solid resistance that includes K-resistance, MPP and WPR1. Also this will be lower border of previous consolidation. In fact, currently we have twofold setup. Scalp traders could try to trade market down to butterfly target around 1.10. While daily traders should wait when setup of weekly DRPO “Buy” and daily butterfly will be completed.

Conclusion:
Right now it is very difficult to understand how geopolitical and inner economical situation will impact on EUR. There are too many uncertainty and variables. Thus, on current week we mostly focus on technical picture. Thus long-term chart shows that market is approaching to rock hard support around 1.10-1.12, CFTC data tells that short positions are too big and this creates background for upside retracement on EUR.
Weekly chart suggests 1.20 as minimum target of this bounce if DRPO “Buy” pattern will be formed, while daily chart points how exactly it could be formed – by appearing of Butterfly “Buy” pattern. Overall context looks pretty logical and finalized. This gives us more confidence on success.
The technical portion of Sive's analysis owes a great deal to Joe DiNapoli's methods, and uses a number of Joe's proprietary indicators. Please note that Sive's analysis is his own view of the market and is not endorsed by Joe DiNapoli or any related companies.
Reuters reports the dollar index ended little changed on Friday as it stayed on track for a record eighth month of gains on improving U.S. data and comments from Federal Reserve officials that bolstered bets for a interest rate rise later this year.
This measure of the greenback against the euro, yen and four other currencies was set to mark its longest streak of monthly gains since the greenback was floated as a fiat currency in 1971. February's gain of about 0.52 percent, however, was the smallest of the eight months.
The dollar overcame earlier month-end selling that followed a rally on Thursday, as more evidence suggested the U.S. economy will expand in the coming months.
"The trend is still in place to support the dollar," said Eric Viloria, currency strategist at Wells Fargo Securities in New York.
The government said on Friday it downgraded fourth-quarter U.S. gross domestic product growth to a 2.2 percent annual pace from an initial estimate of 2.6 percent. Economists polled by Reuters forecast a revision down to 2.1 percent.
better-than-expected reading coincided with encouraging U.S. pending home sales and consumer sentiment figures, though a surprise drop in a private index on U.S. Midwest business activity to its weakest since July 2009 revived some worries about slowing U.S. growth.
Amid this backdrop of moderate economic expansion, the Federal Reserve has shown it would be "patient" on ending its near-zero interest rate policy. Fed Chair Janet Yellen reiterated this stance at her semiannual testimony before Congress this week.
Other top U.S. central bank officials signaled the Fed's path towards normalizing monetary policy remains on track for later this year, but the pace of rate increases will likely be gradual as inflation has been stuck below the Fed's 2 percent target.
CFTC data shows decreasing of open interest. Probably investors have closed some positions on Greece uncertainty. On previous week CFTC shows contraction as long as short positions. At the same time long positions shows solid long-term drop and right now speculative shorts stand for 214’901 vs. longs of 41’400. Thus, our ratio stands at 83,84% and in general stands at numbers when market will need some pause or pullback to reduce this number.
Open interest:
So, guys, each week brings its own concerns and tensions. Thus, in financial sphere it is not quite clear what will happen around Greece. After brave rhetoric before election Syriza has met with reality after elections and now they understand that they have to search for compromises on debt problem. Otherwise it could lead to negative consequences for economy. At the same time Greek people and government understand that after joining EU they were deprived of financial independence and do not control financial system of the country since they can’t print money and regulate liquidity. It seems that there is some red line exists in Greek patience, Greeks demand equity and if they will see that EU bureaucrats do not want to hear anything – this could provoke drastical steps, although chances of this event are not significant. Right now parties have come to agreement, but this agreement mostly tactical and Greece continues to think on strategical exit from difficult economical situation. Obviously it is not a solution - increase short-term burden every time to support short-term liquidity.
In geopolicy situation is far from prosperity. At first glance we see some chill out in Ukraine, but many experts think that this is temporal. At the same time, US tends to create a circle of instability around Russia, since Nulland has started round trip across Russian Asian borders to Armenia, Azerbaijan, Georgia and Turkmenistan. Recent statements from leaders of these countries and observation of experts suggests that main target of this trip is start the same process in these countries that were made in Ukraine. Thus opposition significantly activated in Armenia. As you know, Armenia has old conflict with Azerbaijan on Nagorny Karabakh. In Kazakhstan were appointed President’s early elections. That’s just few issues and probably we will know more in nearest time.
Meantime, despite on complex situation our analysis mostly will be technical on current week.
Technicals
Monthly
So dynamic in last few weeks was mostly flat and accelerated only yesterday. February yet is inside month but January was dreadful month for EUR. We have plunge that we haven’t seen since 2008 crisis. Now euro stands at the eve of most interesting action. I do not know what we will get later, but monthly chart looks very cool. You, guys, probably see everything by yourself already. Yes, EUR has passed through YPP and YPS1 with a blink of an eye – it needs just 3 weeks to pass through yearly barrier. But right now currency stands at rock hard support area – monthly oversold, major 5/8 Fib level, AB=CD target and 1.27 extension target. It should be upside retracement, guys!!! It needs absolutely unprecedented power to push EUR lower. It is interesting that all four recent legs down have approximately the same length. So, it seems that EUR is also at the peak of harmonic swing.
At the same time after retracement (if it will happen of cause) downward action will continue. EUR has dropped to 1.27 butterfly target too fast. Odds suggest continuation to 1.618 extension. By the way, the same suggestion we could make based on AB-CD. CD leg is also too fast. But where does it stand? Right – at 1.0 point, parity. Bingo… This will be next destination point when and if market will pass through 1.11-1.12 area. Also we need to say that we knew about 1.11-1.12 and we have discussed it here and even pointed on it as possible “long-term” target. But it has appeared that it is not “long-term”. That’s why we’re talking of scale increasing on EUR. Right now EUR passes for week distances that previously it has passed for months. The cornerstone for EUR perspective will remain US fundamental data. Recently data mostly was supportive for US dollar appreciation. Meantime, market obviously is overextended to the downside and needs technical retracement. This is also confirmed by CFTC speculative ratio. Thus, we should be very sensitive to any sign of retracement or reversal patterns on lower time frames.
Weekly
Potentially weekly chart could give us DRPO “Buy” as conditions for upside retracement exist as technically as from speculative positions point of view. Meantime market could move 100 pips lower to 1.1030 area, because monthly butterfly target stands slightly lower compares to current price level. This in turn, could lead to appearing of perfect weekly DRPO “Buy” pattern.
On previous weeks market has failed to return back above YPS1 and MPP. Here I’ve chosen minimum target of 50% resistance from most recent thrust down. This level also will be accompanied by weekly overbought. Let’s initially focus on this level of 1.20 area as potential target. Currently it is difficult to find reasons for stronger upside action, but thrust itself is suitable for DRPO right from beginning, I mean 1.39 area. And theoretically it is possible that retracement could be even to 1.30 area. It will not be straight of cause, but technically there is now flaws in context that could point that this is impossible. Still, let’s move step by step and first will watch for 1.20. Even this level is very significant target.
Daily
Trend on daily chart has turned bearish. This picture shows how precisely market could reach 1.1030 area. Market could form 1.27 Butterfly “buy”. Although it has even lower target, but for weekly chart this is acceptable variation. Currently it is difficult to suggest how market will behave around MPS1, but probably it will be possible to show some spike down to reach butterfly target. So, our context is becoming clear: market at rock hard monthly support, speculative positions bearishly overextended a bit, weekly chart could form DRPO pattern and daily butterfly could become a pattern that particularly will be final pattern of weekly DRPO.
4-Hour
As we think that right wing of butterfly already stands in progress – EUR should not show too deep upside bounce. Still, we have new MPP for March and we know that market in most cases tries to test it within a month. Thus, if upside retracement will happen – we hope that it will stop around 1.13 area. This is solid resistance that includes K-resistance, MPP and WPR1. Also this will be lower border of previous consolidation. In fact, currently we have twofold setup. Scalp traders could try to trade market down to butterfly target around 1.10. While daily traders should wait when setup of weekly DRPO “Buy” and daily butterfly will be completed.
Conclusion:
Right now it is very difficult to understand how geopolitical and inner economical situation will impact on EUR. There are too many uncertainty and variables. Thus, on current week we mostly focus on technical picture. Thus long-term chart shows that market is approaching to rock hard support around 1.10-1.12, CFTC data tells that short positions are too big and this creates background for upside retracement on EUR.
Weekly chart suggests 1.20 as minimum target of this bounce if DRPO “Buy” pattern will be formed, while daily chart points how exactly it could be formed – by appearing of Butterfly “Buy” pattern. Overall context looks pretty logical and finalized. This gives us more confidence on success.
The technical portion of Sive's analysis owes a great deal to Joe DiNapoli's methods, and uses a number of Joe's proprietary indicators. Please note that Sive's analysis is his own view of the market and is not endorsed by Joe DiNapoli or any related companies.
Last edited: