Sive Morten
Special Consultant to the FPA
- Messages
- 18,754
Fundamentals
Today we again will take a look at GBP and start from Fanthom Consulting fresh research on UK economy:
Previous detailed research is here:
https://www.forexpeacearmy.com/community/threads/forex-pro-weekly-february-29-04-2016.44314/
Reshuffling the Deck Chairs
On Wednesday, UK Chancellor George Osborne laid out his plans to reshuffle a considerable amount of planned expenditure and receipts as he struggles to hit just one of his fiscal targets. The backdrop is a significant deterioration in expected receipts, which the OBR blames almost equally on a combination of weaker growth and weaker inflation. The net result is that projected borrowing is significantly higher before fiscal year 2019/20, at which point it falls dramatically to return a small surplus.

As part of Wednesday’s Budget, the OBR revised down its forecasts for GDP growth in every year out to 2020, by an average of 0.3 percentage points per year. The Chancellor chose to blame much of these downward revisions on a weaker global outlook – citing China in particular – and financial market wobbles. This came as no surprise. As our regular readers will be aware, the causes of the UK’s ongoing slowdown are much closer to home in our view.

Crucially, the OBR once again chose not to make any material change to its long-term productivity growth assumptions. The failure to do so means that revenue forecasts, already revised down in Wednesday’s Budget, are likely to be cut again in future.

Chancellor Osborne resists the temptation to pull another rabbit out of the hat
Three years ago, faced with the prospect of a ‘triple-dip’ recession, Chancellor Osborne launched the Mortgage Guarantee Scheme, or ‘Help to Buy 2’. In austere times, as a means of stimulating demand against stagnant productivity, it was almost perfect. It was powerful (it worked through the housing market), and yet it was cheap (as far as the government was concerned, it was all ‘off balance sheet’). It was, in short, a true ‘rabbit out of the hat’ moment.
On Wednesday, thankfully, Chancellor Osborne resisted the temptation to repeat his magic trick. There was no attempt to stimulate the housing market still further. Indeed, the Chancellor subtly opted to add a further restraint on the Buy-to-Let sector by closing a loop-hole. ‘Large investors’, or groups of small investors who join together, will now be unable to avoid the increase in stamp duty on new purchases that takes effect next month.
An entirely cosmetic reshuffle
The next chart sets out changes in public borrowing that, according to the OBR, would have occurred purely because of changes in the economic outlook, before any of Wednesday’s new policy measures are taken into account. It shows that the public finances have benefitted from a material flattening of the short-end of the sterling curve – since the Autumn Statement, the anticipated timing of the first hike in Bank Rate has been pushed back almost three years. But the beneficial effects of lower yields are dwarfed by a substantial deterioration in expected receipts. Our own calculations suggest that around one half of the deterioration reflects weaker expected growth, and one half weaker expected inflation.

Our final chart sets out the impact of Wednesday’s policy announcements. Particularly eye catching is the projected turnaround in the impact of policy measures between fiscal years 2018/19 and 2019/20. It is precisely at this point that the government balance is expected to turn from a £21.4 billion deficit into a £10.4 billion surplus, thereby satisfying one of Chancellor Osborne’s three fiscal rules. Some of the improvement is attributed to so-called ‘scorecard’ policy changes, including a range of corporate tax avoidance measures expected to raise an additional £9.4 billion over the course of the parliament.

But critically, we estimate that around half of the total adjustment is a consequence of entirely cosmetic ‘reshuffling’. Examples include the deferral of large-company corporate tax payments by two years, artificially inflating receipts in fiscal years 2019/20 and 2020/2021, and the bringing forward of some capital investment projects. Taken together, these measures increase the deficit by some £11.6 billion in fiscal years 2017/18 and 2018/19 but then decrease it by £11.3 billion in fiscal years 2019/20 and 2020/21.
Now let's take a look at CFTC data. It shows very interesting progress. Last time we saw classical turning - open interest dropped simultaneously with contraction of net-short position. And this has happened on upside retracement. This combination told on contraction of short position.
On current week - net short position has increased while open interest again has dropped but not as significant as last week. This has happened due massive closing of long positions. As last week traders were closing shorts mostly - this week turn has come to long ones. At the same time we have to say that traders have not opened shorts either. This leads us to conclusion that upside retracement should come to an end very soon.

Technicals
Monthly
Although last weekly research we also have dedicated to GBP, but we haven't taken a look at it within a week. Thus, today we will do this.
As market has stand in upside retracement - this barely made any impact on monthly chart. Some upward bounce but its scale insignificant for this time frame. Besides we do not have visible reasons and technical supports in area where this upside bounce has started – no AB-CD extensions, Fib levels, pivots etc. That’s why we treat this move as retracement yet and stand with our previous analysis on downward continuation in long-term perspective. As a result, pound was not able to hold above broken YPS1 and dropped below it again, as below important 1.40 lows, marked by red arrow on chart.
Long Term Forecast on GBP rate
Our long term analysis suggests first appearing of new high on 4th wave at ~1.76 level and then starting of last 5th wave down. First condition was accomplished and we’ve got new high, but it was a bit lower – not 1.76 but 1.72. This was and is all time support/resistance area. Now we stand in final part of our journey. According to our 2013 analysis market should reach lows at 1.35 area. Let’s see what additional information we have right now."
Trend is bearish here, but GBP is not at oversold. So, GBP picture right now looks simple. Market has broken all meaningful supports on a way down. IT has started from Yearly Pivot, then major 5/8, Yearly PS1 and former low (marked by arrow). Now the only destination is previous lows, and then our first long-term target around 1.30. Here we have to make some notes.
First, is - lows will not survive, despite how long they will hold price. Mostly because AB-CD target stands right below it. If even market will not drop further - it will wash out lows. There is really high probability for this.
Second - It is interesting, that if we would take 2.11 level as our "A" point - 100% AB=CD target (next one) will stand precisely around 0.8 level and will coincide with Fanthom Consulting analysis. Interesting... Right now by our AB-CD 100% target stands around 1.05....
That's being said monthly chart still suggests further downward action to previous lows around 1.35 first. This upside action has shy relation to monthly chart and we should search reasons and probable destination of this move on lower time frames. What we do know here - this bounce could give us excellent chance to take short position until overall bearish setup holds here.

Weekly
On previous week we've made following comments:
"So, here we see the reason for bounce us. It's butterfly completion point and weekly oversold. Trend has turned bullish. Last time we've foreseen this possibility but come to conclusion that retracement up should be mild, because, as you can see - major AB=CD target around 1.33 has not been met yet.
Upside action has started with nicely looking engulfing or piercing in the cloud pattern whatever you like more. Overbought resistance stands at 1.4830 right now. Also market has touched MPR1.
On coming week we probably will see - whether this retracement will over or it turn to larger scale retracement. Since CFTC data shows that current action mostly is supported by short covering, so it should exhaust fast. This also will be answer - what we have a deal with."
Right now CFTC data mostly suggests that upside retracement is over. GBP was not able to break through MPR1 and turned down. It means that odds stand in favor of downward continuation. Major reason for that still is uncompleted AB-CD target.

Daily
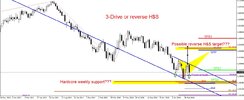
Now guys, we're coming to most interesting part of research. Last time we've said that market should reach 1.46 area and touch neckline of potential H&S pattern to keep valid chances on further upside continuation. We also said that any deep drop before reaching of neckline will be unnatural and suggests breaking of bullish setup. I suggest you to read again this part of last week analysis to recall, why we've come to this conclusion.
Currently, it is not simple task to recognize irrational behavior, because visually - everything is OK. We see nice H&S shape and GBP stands on the bottom of potential right shoulder, right? Right, but not quite.
In really we have reasons to think that recent drop is not a right shoulder, but failure to complete the head and H&S pattern is already failed. The core of understanding stands in upside AB-CD pattern.

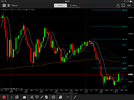
4-hour
So here is the chart. As you can see - on Monday GBP already was above minor 0.618 target of AB-CD pattern. It has exceeded it on a fast rally on Friday. CD leg was extremely fast and suggests further continuation to AB=CD target and, in turn, to neckline of H&S around 1.46. Market mostly was stopped by overbought and MPR1 on daily chart.
By these reasons we said - "well, we could accept minor bounce down, but not too deep". Our targets of downward retracement were WPP and then K-support around 1.4260 area. This should be enough to hold bullish market on minor retracement.
But, right on last Monday we've got fast collapse and breakout through both areas. This action has proved that something is wrong with H&S pattern. Now also know that this action is supported by sentiment due recent CFTC data. Thus, it means that current action probably is a continuation of long-term bear trend.
Also this conclusion is confirmed by inability to move through MPR1.

Still, could we become wrong? The major argument is daily chart - take a look price still stands around the bottom of left shoulder, keeping the harmony of H&S pattern. What if H&S is still valid and it just has a bit skewed shape? Well, we can't exclude this totally, of cause. Hence we need to protect our short entry as strong as possible.
Take a look that recent drop is a good thrust down. I also plot here 3x3 DMA and give you a hint on possible DRPO "buy" pattern. (B&B is not possible any more). If we're wrong with bearish continuation - market probably could use this DRPO to start move up again.
Hourly
That's why if we will decide to take short position - it should be high protected. We could achieve this by using strong resistance area. Take position and then move to breakeven as soon as possible. Strong levels give you higher chances on respect by market at first touch. Hence with this bounce we could move our stops to breakeven.
Right now 1.4230 is the one that could be suitable for this purpose. Take a look - WPP, K-resistance, AB-CD target (Agreement) and potential butterfly target.

If you have bullish view - then you can use DRPO "buy" for taking long position, or, say, GBP could form Butterfly "buy" pattern on 4-hour chart, (DRPO very often takes the shape of butterfly) that you also could use for long entry. But, guys - be careful. Personally I do not like this recent drop...
Conclusion:
Recent action barely impacts long-term perspectives for GBP. Mostly it stands in relation to daily and intraday picture and is tactical. That's why our task here is to get answer on potential depth of upside retracement and what shape it will take. Right now we suggest that H&S has lost chances to succeed and odds stand in favor further downward continuation.
The technical portion of Sive's analysis owes a great deal to Joe DiNapoli's methods, and uses a number of Joe's proprietary indicators. Please note that Sive's analysis is his own view of the market and is not endorsed by Joe DiNapoli or any related companies.
Today we again will take a look at GBP and start from Fanthom Consulting fresh research on UK economy:
Previous detailed research is here:
https://www.forexpeacearmy.com/community/threads/forex-pro-weekly-february-29-04-2016.44314/
Reshuffling the Deck Chairs
On Wednesday, UK Chancellor George Osborne laid out his plans to reshuffle a considerable amount of planned expenditure and receipts as he struggles to hit just one of his fiscal targets. The backdrop is a significant deterioration in expected receipts, which the OBR blames almost equally on a combination of weaker growth and weaker inflation. The net result is that projected borrowing is significantly higher before fiscal year 2019/20, at which point it falls dramatically to return a small surplus.
As part of Wednesday’s Budget, the OBR revised down its forecasts for GDP growth in every year out to 2020, by an average of 0.3 percentage points per year. The Chancellor chose to blame much of these downward revisions on a weaker global outlook – citing China in particular – and financial market wobbles. This came as no surprise. As our regular readers will be aware, the causes of the UK’s ongoing slowdown are much closer to home in our view.
Crucially, the OBR once again chose not to make any material change to its long-term productivity growth assumptions. The failure to do so means that revenue forecasts, already revised down in Wednesday’s Budget, are likely to be cut again in future.
Chancellor Osborne resists the temptation to pull another rabbit out of the hat
Three years ago, faced with the prospect of a ‘triple-dip’ recession, Chancellor Osborne launched the Mortgage Guarantee Scheme, or ‘Help to Buy 2’. In austere times, as a means of stimulating demand against stagnant productivity, it was almost perfect. It was powerful (it worked through the housing market), and yet it was cheap (as far as the government was concerned, it was all ‘off balance sheet’). It was, in short, a true ‘rabbit out of the hat’ moment.
On Wednesday, thankfully, Chancellor Osborne resisted the temptation to repeat his magic trick. There was no attempt to stimulate the housing market still further. Indeed, the Chancellor subtly opted to add a further restraint on the Buy-to-Let sector by closing a loop-hole. ‘Large investors’, or groups of small investors who join together, will now be unable to avoid the increase in stamp duty on new purchases that takes effect next month.
An entirely cosmetic reshuffle
The next chart sets out changes in public borrowing that, according to the OBR, would have occurred purely because of changes in the economic outlook, before any of Wednesday’s new policy measures are taken into account. It shows that the public finances have benefitted from a material flattening of the short-end of the sterling curve – since the Autumn Statement, the anticipated timing of the first hike in Bank Rate has been pushed back almost three years. But the beneficial effects of lower yields are dwarfed by a substantial deterioration in expected receipts. Our own calculations suggest that around one half of the deterioration reflects weaker expected growth, and one half weaker expected inflation.
Our final chart sets out the impact of Wednesday’s policy announcements. Particularly eye catching is the projected turnaround in the impact of policy measures between fiscal years 2018/19 and 2019/20. It is precisely at this point that the government balance is expected to turn from a £21.4 billion deficit into a £10.4 billion surplus, thereby satisfying one of Chancellor Osborne’s three fiscal rules. Some of the improvement is attributed to so-called ‘scorecard’ policy changes, including a range of corporate tax avoidance measures expected to raise an additional £9.4 billion over the course of the parliament.
But critically, we estimate that around half of the total adjustment is a consequence of entirely cosmetic ‘reshuffling’. Examples include the deferral of large-company corporate tax payments by two years, artificially inflating receipts in fiscal years 2019/20 and 2020/2021, and the bringing forward of some capital investment projects. Taken together, these measures increase the deficit by some £11.6 billion in fiscal years 2017/18 and 2018/19 but then decrease it by £11.3 billion in fiscal years 2019/20 and 2020/21.
Now let's take a look at CFTC data. It shows very interesting progress. Last time we saw classical turning - open interest dropped simultaneously with contraction of net-short position. And this has happened on upside retracement. This combination told on contraction of short position.
On current week - net short position has increased while open interest again has dropped but not as significant as last week. This has happened due massive closing of long positions. As last week traders were closing shorts mostly - this week turn has come to long ones. At the same time we have to say that traders have not opened shorts either. This leads us to conclusion that upside retracement should come to an end very soon.
Technicals
Monthly
Although last weekly research we also have dedicated to GBP, but we haven't taken a look at it within a week. Thus, today we will do this.
As market has stand in upside retracement - this barely made any impact on monthly chart. Some upward bounce but its scale insignificant for this time frame. Besides we do not have visible reasons and technical supports in area where this upside bounce has started – no AB-CD extensions, Fib levels, pivots etc. That’s why we treat this move as retracement yet and stand with our previous analysis on downward continuation in long-term perspective. As a result, pound was not able to hold above broken YPS1 and dropped below it again, as below important 1.40 lows, marked by red arrow on chart.
Long Term Forecast on GBP rate
Our long term analysis suggests first appearing of new high on 4th wave at ~1.76 level and then starting of last 5th wave down. First condition was accomplished and we’ve got new high, but it was a bit lower – not 1.76 but 1.72. This was and is all time support/resistance area. Now we stand in final part of our journey. According to our 2013 analysis market should reach lows at 1.35 area. Let’s see what additional information we have right now."
Trend is bearish here, but GBP is not at oversold. So, GBP picture right now looks simple. Market has broken all meaningful supports on a way down. IT has started from Yearly Pivot, then major 5/8, Yearly PS1 and former low (marked by arrow). Now the only destination is previous lows, and then our first long-term target around 1.30. Here we have to make some notes.
First, is - lows will not survive, despite how long they will hold price. Mostly because AB-CD target stands right below it. If even market will not drop further - it will wash out lows. There is really high probability for this.
Second - It is interesting, that if we would take 2.11 level as our "A" point - 100% AB=CD target (next one) will stand precisely around 0.8 level and will coincide with Fanthom Consulting analysis. Interesting... Right now by our AB-CD 100% target stands around 1.05....
That's being said monthly chart still suggests further downward action to previous lows around 1.35 first. This upside action has shy relation to monthly chart and we should search reasons and probable destination of this move on lower time frames. What we do know here - this bounce could give us excellent chance to take short position until overall bearish setup holds here.
Weekly
On previous week we've made following comments:
"So, here we see the reason for bounce us. It's butterfly completion point and weekly oversold. Trend has turned bullish. Last time we've foreseen this possibility but come to conclusion that retracement up should be mild, because, as you can see - major AB=CD target around 1.33 has not been met yet.
Upside action has started with nicely looking engulfing or piercing in the cloud pattern whatever you like more. Overbought resistance stands at 1.4830 right now. Also market has touched MPR1.
On coming week we probably will see - whether this retracement will over or it turn to larger scale retracement. Since CFTC data shows that current action mostly is supported by short covering, so it should exhaust fast. This also will be answer - what we have a deal with."
Right now CFTC data mostly suggests that upside retracement is over. GBP was not able to break through MPR1 and turned down. It means that odds stand in favor of downward continuation. Major reason for that still is uncompleted AB-CD target.
Daily
Now guys, we're coming to most interesting part of research. Last time we've said that market should reach 1.46 area and touch neckline of potential H&S pattern to keep valid chances on further upside continuation. We also said that any deep drop before reaching of neckline will be unnatural and suggests breaking of bullish setup. I suggest you to read again this part of last week analysis to recall, why we've come to this conclusion.
Currently, it is not simple task to recognize irrational behavior, because visually - everything is OK. We see nice H&S shape and GBP stands on the bottom of potential right shoulder, right? Right, but not quite.
In really we have reasons to think that recent drop is not a right shoulder, but failure to complete the head and H&S pattern is already failed. The core of understanding stands in upside AB-CD pattern.
4-hour
So here is the chart. As you can see - on Monday GBP already was above minor 0.618 target of AB-CD pattern. It has exceeded it on a fast rally on Friday. CD leg was extremely fast and suggests further continuation to AB=CD target and, in turn, to neckline of H&S around 1.46. Market mostly was stopped by overbought and MPR1 on daily chart.
By these reasons we said - "well, we could accept minor bounce down, but not too deep". Our targets of downward retracement were WPP and then K-support around 1.4260 area. This should be enough to hold bullish market on minor retracement.
But, right on last Monday we've got fast collapse and breakout through both areas. This action has proved that something is wrong with H&S pattern. Now also know that this action is supported by sentiment due recent CFTC data. Thus, it means that current action probably is a continuation of long-term bear trend.
Also this conclusion is confirmed by inability to move through MPR1.
Still, could we become wrong? The major argument is daily chart - take a look price still stands around the bottom of left shoulder, keeping the harmony of H&S pattern. What if H&S is still valid and it just has a bit skewed shape? Well, we can't exclude this totally, of cause. Hence we need to protect our short entry as strong as possible.
Take a look that recent drop is a good thrust down. I also plot here 3x3 DMA and give you a hint on possible DRPO "buy" pattern. (B&B is not possible any more). If we're wrong with bearish continuation - market probably could use this DRPO to start move up again.
Hourly
That's why if we will decide to take short position - it should be high protected. We could achieve this by using strong resistance area. Take position and then move to breakeven as soon as possible. Strong levels give you higher chances on respect by market at first touch. Hence with this bounce we could move our stops to breakeven.
Right now 1.4230 is the one that could be suitable for this purpose. Take a look - WPP, K-resistance, AB-CD target (Agreement) and potential butterfly target.
If you have bullish view - then you can use DRPO "buy" for taking long position, or, say, GBP could form Butterfly "buy" pattern on 4-hour chart, (DRPO very often takes the shape of butterfly) that you also could use for long entry. But, guys - be careful. Personally I do not like this recent drop...
Conclusion:
Recent action barely impacts long-term perspectives for GBP. Mostly it stands in relation to daily and intraday picture and is tactical. That's why our task here is to get answer on potential depth of upside retracement and what shape it will take. Right now we suggest that H&S has lost chances to succeed and odds stand in favor further downward continuation.
The technical portion of Sive's analysis owes a great deal to Joe DiNapoli's methods, and uses a number of Joe's proprietary indicators. Please note that Sive's analysis is his own view of the market and is not endorsed by Joe DiNapoli or any related companies.

") ))
))