Sive Morten
Special Consultant to the FPA
- Messages
- 18,771
Fundamentals
Reuters reports dollar index slipped on Friday, putting it on track to fall for a fifth week, the longest stretch of declines in four years, as disappointing data on domestic factory activity and consumer sentiment stirred doubts about the U.S. economic growth.
Earlier, this measure of the greenback against a group of currencies including the euro and yen bounced from a four-month low as buying emerged with lower European bond yields, and as traders booked profits on this week's gains in other currencies against the greenback.
"The dollar is oversold. The data weren't all that great, but the story is people still see the Federal Reserve raising interest rates later this year," said Kathy Lien, managing director at BK Asset Management in New York.
The euro was up 0.2 percent to $1.1431, a tad below a three-month high of $1.1445 on Thursday and about 9 percent higher than a 12-year low of $1.0457 reached on March 16. That was the day the European Central Bank embarked on its 1.1 trillion euro bond-buying program, to which President Mario Draghi reiterated his commitment on Thursday.
The euro's rebound was partly helped by improved euro zone data and rising inflation expectations.
On the other hand, dollar bulls have been disappointed by a recent spate of U.S. data. First-quarter growth has been lacklustre and there has been little evidence of a rebound in the second quarter.
On Friday, data on New York state manufacturing and readings on industrial output fell short of expectations, while a private gauge on U.S. consumer sentiment unexpectedly fell to its lowest in seven months in early May.
This down shift in the U.S. economy has helped stem a recent global bond market rout, which has narrowed the yield gap between Bunds and U.S. Treasuries and helped revive the euro.
The gap between 10-year Bunds and Treasuries narrowed to 153 basis points, from around 180 bps about a month ago, making the euro more attractive to investors.
CFTC data shows Speculators further pared back positive bets on the U.S. dollar in the latest period, pushing the currency's net long position to the lowest in nine months, according to Reuters calculations and data from the Commodity Futures Trading Commission released on Friday.
The value of the dollar's net long position fell to $29.11 billion in the week ended May 12, from $32.25 billion the previous week. Net longs on the dollar declined for a seventh straight week. It was also the fifth straight week that longs on the dollar came in below $40 billion. The dollar has been weakened by a slew of soft U.S. economic data. Net short positions on the euro, meanwhile, fell for a sixth straight week, totaling 178,976 contracts, down from 190,127 previously. The decline in the negative bets on the euro was helped by the dollar's woes and easing concerns about deflation in the euro zone.
But here we also see that Open interest has decreased for ~ 37K contracts. It tells that upside action on EUR mostly is driven by short covering. Still this action has a lot of resources, since there are large short positions and EUR still could show significant rally if this covering will continue. At the same time we need to keep an eye on whether this covering will trigger long position growth or not…

So, right now Greece stands in focus of EU economy and latest news suggest that Greece's government could ask for an emergency meeting of euro zone finance ministers at the end of the month, the government spokesman said on Thursday, referring to the end-May date by which it hopes to have a deal with its lenders on reforms.
Greece will make sure it pays upcoming debt obligations but a deal to address its liquidity needs must be struck soon, Gabriel Sakellaridis told a news conference.
At the same time investors stand far from any euphoria. The chances Greece will leave the euro zone are slightly less than one in four, according to a Reuters poll of traders, but if Athens defaults on a 750 million-euro debt repayment to the IMF on Tuesday the likelihood will increase.
That 23 percent median compares with the 40 percent probability traders gave a couple of weeks ago, when more than half of them said Greece could stay in the bloc even if it defaults on repayments.
"The default and the Grexit are two very different things," said a trader at a large dealer. "They can default or partially default, but they will not leave the euro zone.
"If they fail to pay the IMF tomorrow … the euro could rise by 10-15 percent, but whatever happens in the coming days … they will not leave euro zone."
Greece is running out of money to keep paying wages and pensions, raising concern about whether it will be able to make the IMF repayment. But European Union officials still expect it to.
The country is in the midst of negotiating a new cash-for-reform deal with its euro zone partners to help end an era of austerity that has weakened economic growth.
"There has to be a solution to keep Greece in the system, otherwise Greece will have a huge problem" a trader said.
Greece gross domestic product numbers, to be released on Friday, are expected to show the economy shrank 0.5 percent on a quarterly basis in the first three months of the year.
The poll also showed that banks will borrow 95.0 billion euros at the European Central Bank's weekly tender, similar to the 95.2 billion euros maturing on Tuesday.
Technicals
Monthly
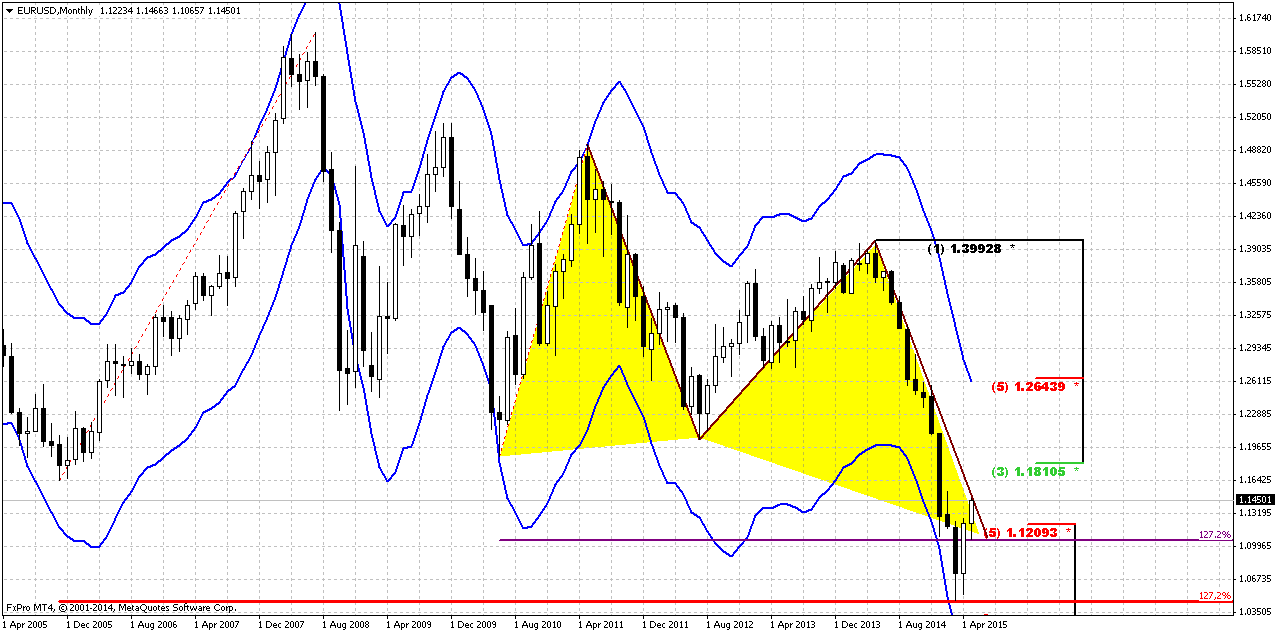
As we have estimated previously 1.05 is 1.27 extension of huge upside swing in 2005-2008 that also has created awful butterfly pattern. Recent action does not quite look like normal butterfly wing, but extension is valid and 1.05 is precisely 1.27 ratio. At the same time we have here another supportive targets, as most recent AB=CD, oversold and 1.27 of recent butterfly.
Now think what do we have – market at 1.27 butterfly target and oversold, CFTC data shows overextension of shorts positions. Recent data has led to dovish forecast on US rates, while EU recent data conversely was mostly positive, as well as earnings reports of EU companies. This smells like solid upside retracement. CFTC data also points on more active short covering positions.
April has closed and confirmed nicely looking bullish engulfing pattern. We know that most probable target of this pattern is length of the bars counted upside. This will give us approximately 3/8 Fib resistance 1.1810 area. Could we call this situation as “Stretch”? By features probably yes, since market is oversold at support, but by letter not quite, since 1.12 level mostly was broken and the area where market stopped was not a Fib level. Still, applying here Stretch target (middle between OB and OS bands) we will get an area of 50% resistance of most recent swing down around 1.22 area.
Another very important moment here is recent thrust down itself. Take a look – it is perfect for DiNapoli directional pattern, say, B&B “Sell”, or even DRPO… but B&B seems more probable. You can imagine what B&B means on monthly chart – large swings, definite direction of trading for weeks. Retracement up has no limitation from monthly overbought level. We think that we need to be focus mostly on B&B from 1.22 area, just because market is oversold. That’s why 3/8 level could not hold upside retracement. In 1.22 area also stand previous lows.
Still, our next long-term target stands the same – parity as 1.618 completion point of recent butterfly. Currently we should treat this bounce up, even to 1.22 area, only as retracement within bear trend. Yes, tactically fundamentals have become weaker in US, and open door for pause in bearish trend, but overall picture has not changed drastically yet.
Weekly
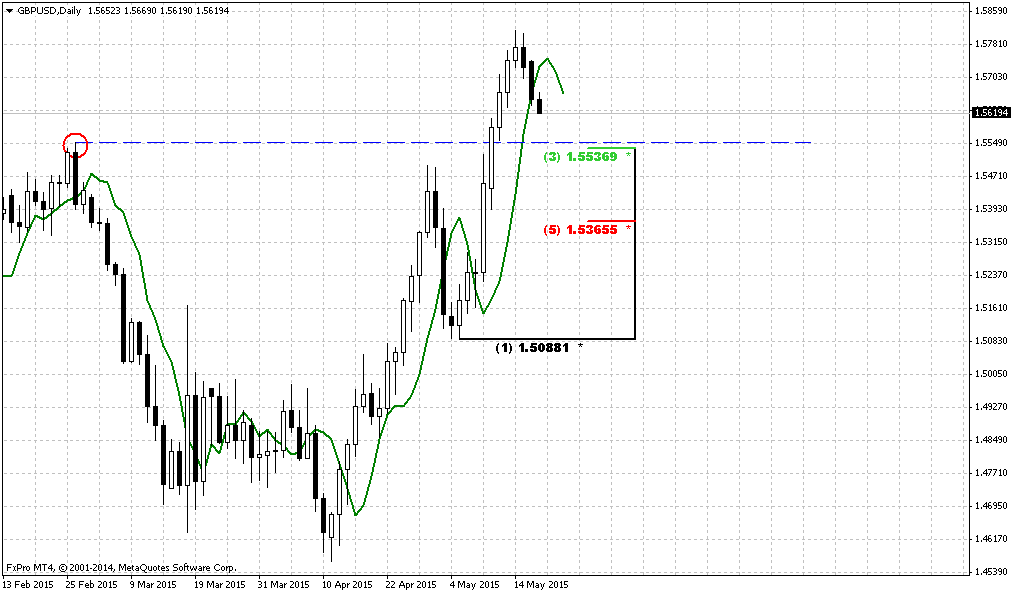
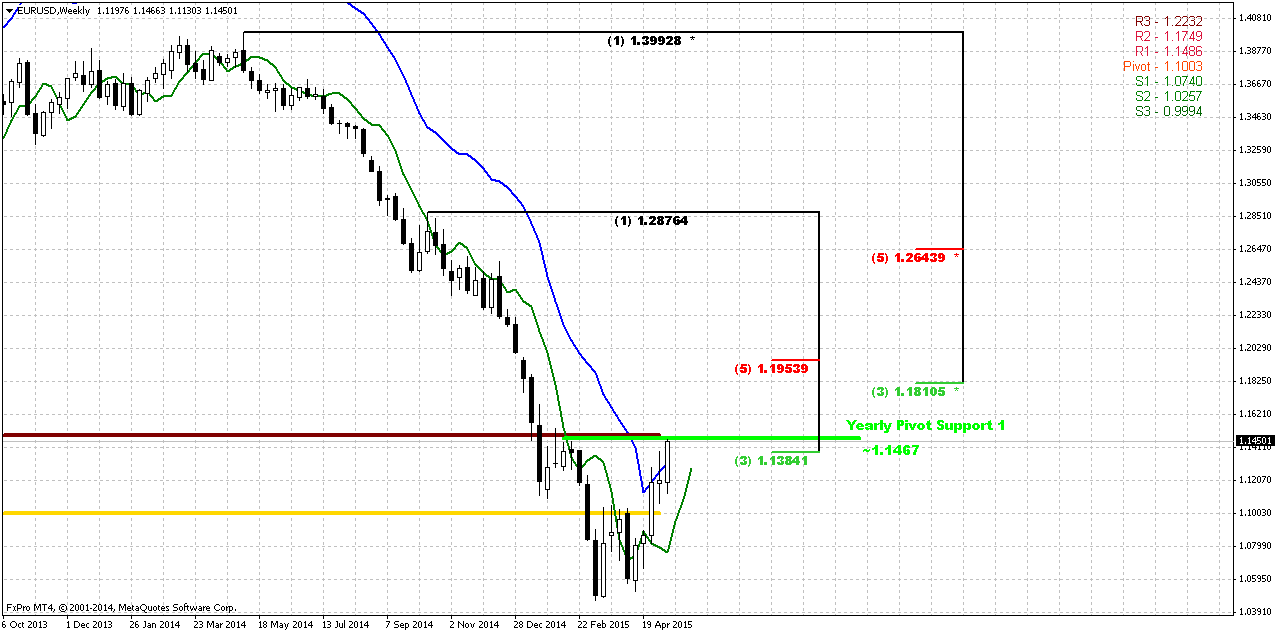
Trend is bullish on weekly chart and as we’ve estimated last week ¬we have confirmed DRPO “Buy” in place. Still our suggestion was correct and market was not able to move significantly higher due existence of strong resistance cluster around 1.14-1.15 area that includes Fib level, MPR1, broken YPS1 and Overbought. Second one coincides with monthly level around 1.18-1.20. Weekly chart shows that it will be also K-area. And this area approximately coincides with 50% level of DPRO thrust that is the target of this pattern. So, as monthly picture as weekly one point on high probability of reaching 1.18-1.20 area in medium term perspective. But action to this area should start after retracement down. This retracement, in turn, will be major object of our attention since we’re looking chance for taking long position here.
On Friday market finally has reached this resistance area. We were waiting almost 2 weeks for it. As monthly pattern as Double REPO here assumes further upward continuation. Particularly speaking, minimum target of DRPO is 50% level of its thrust, i.e. ~ 1.1650. Currently we worry to promise something definite, after absolutely explosive action on GBP when retracement that we’ve expected didn’t come. But, based on technical picture here, chances suggest appearing of retracement rather than just upside continuation. Besides, any position taking process should be reasonable. Do we want to go long at weekly overbought and strong resistance area? I guess not…
Daily
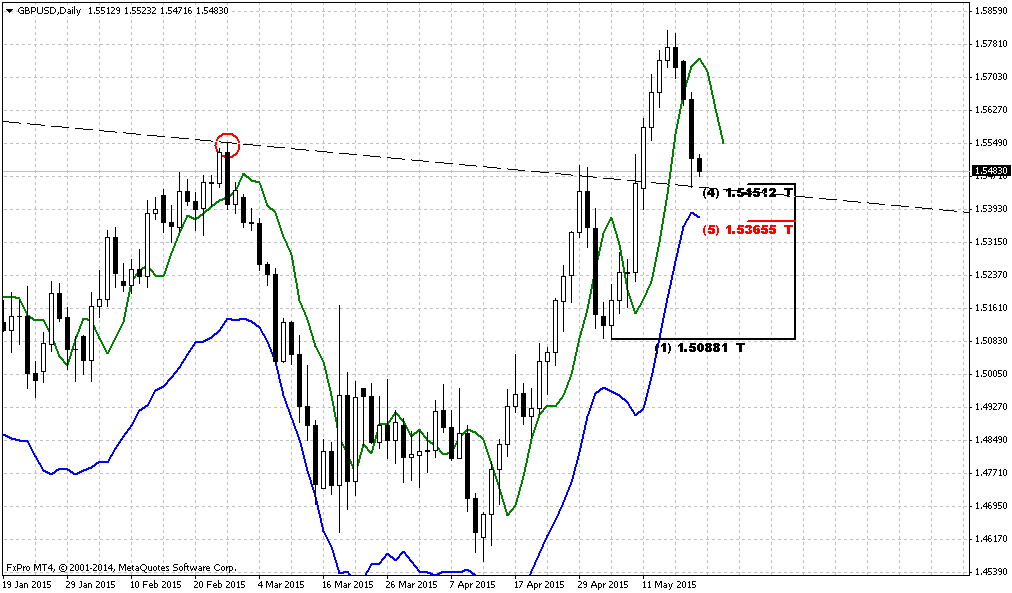
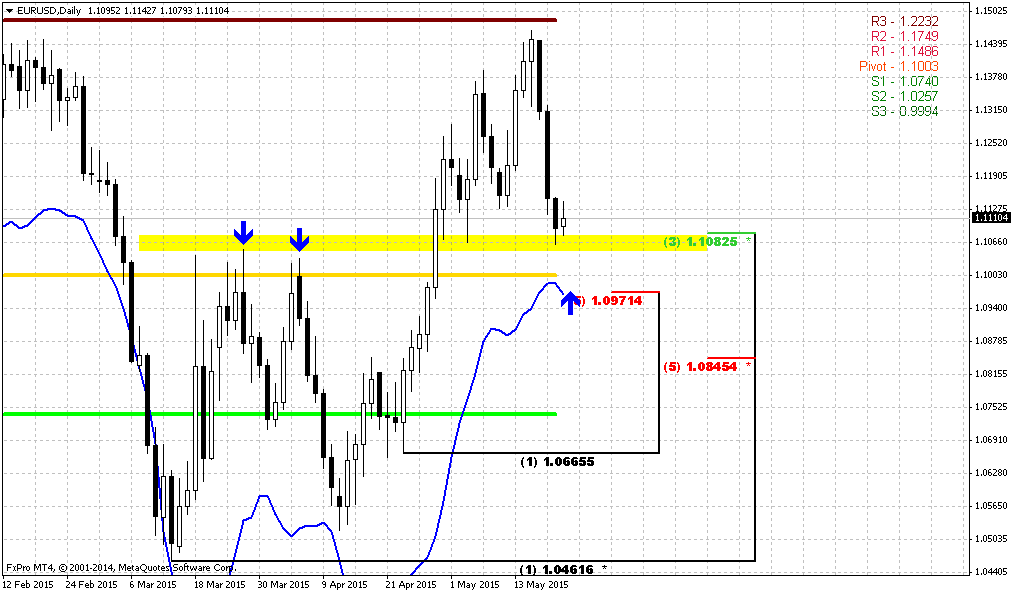
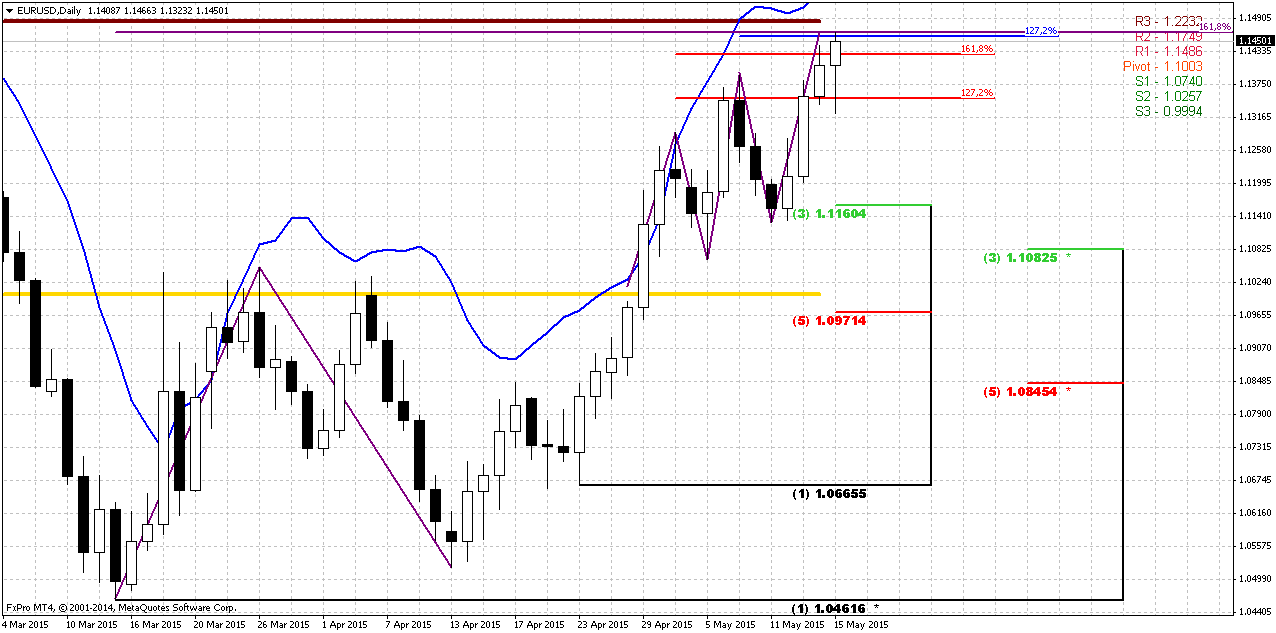
Finally, guys, EUR has completed our trading plan for the week and reached major daily target level. It includes AB-CD 1.618 extension, MPR1 and finalize 3-Drive “Sell” pattern. Also we should remember that this level is also weekly Fib resistance, overbought and former YPR1 ~1.1467. It means that here should be relatively safe to go short. If even we will be wrong and market will continue move higher without meaningful retracement down to MPP, some minor downward bounce probably should happen and this will let us to move stops to breakeven.
Daily picture matches well to big EUR puzzle. On monthly we have bullish engulfing and expect retracement back inside the body of it before upward action will start. On weekly market is overbought at Fib resistance and despite that we have DRPO “Buy” there – chances on pullback are significant and finally, on daily – appearing of 3-Drive and completion major AB=CD makes retracement very probable.
Thus, monthly engulfing and weekly DRPO (although they are the same pattern in fact) give us confidence with upside continuation while daily patterns and weekly overbought @ Fib resistance let us count on pullback that we should use for long entry. It’s very good picture. Most probable pullback target is the same and we’ve talked about it – MPP around 1.10 area. It has not been tested yet and it approximately matches 50% level of upside action and EUR likes 50% levels…
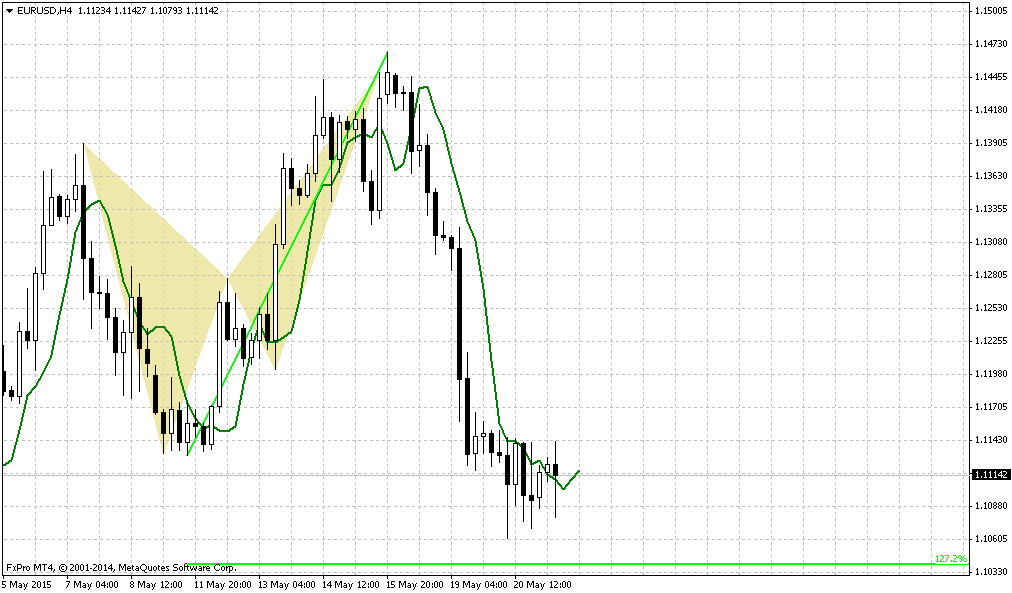
1-Hour
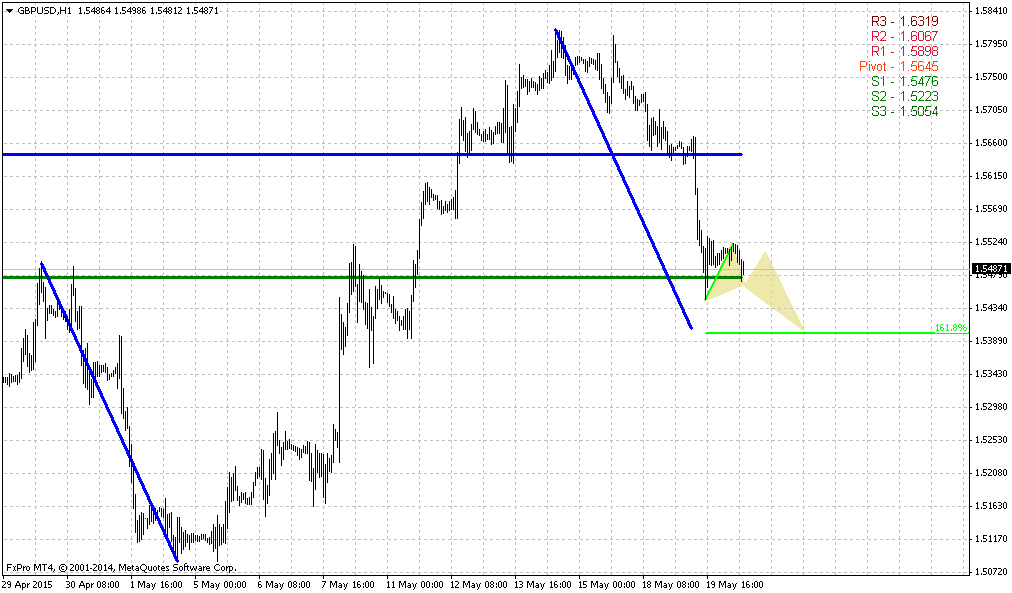
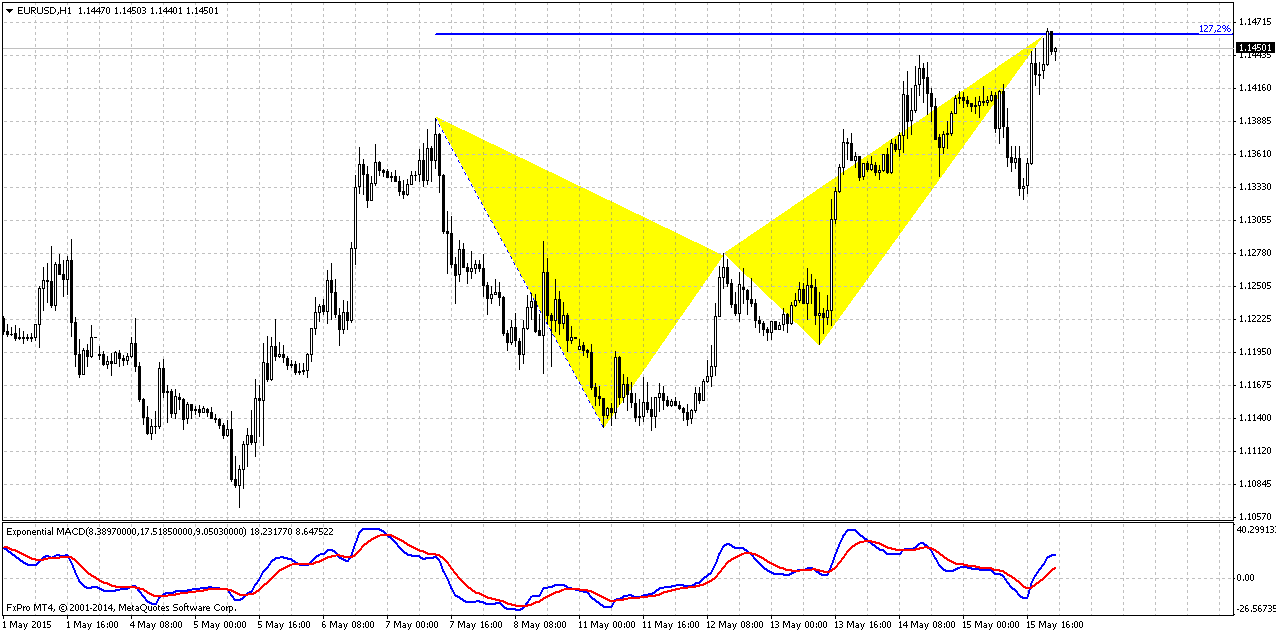
Currently guys we have only this butterfly “Sell” as a context for taking short position. But as this pattern really is not small, it suggests a bit extended stop order. That’s why you can either decrease position size or wait for some smaller pattern that could be formed here in the beginning of the week that will let you to enter with tighter orders.
Meantime we will discuss possible short entry here. Butterfly trading rules suggest taking short at 1.27 butterfly point and place stop above 1.618 one – this is ~ 1.1550 area, but better to place stop slightly higher that 1.1570 – this is daily overbought level and your order hardly will be hit just occasionally. Target will stand at MPP ~ 1.10 area. Risk/reward ratio is nice but as pattern is rather large – it demands corresponding stop.
Conclusion:
EUR could turn to solid upside retracement that will be notified even on monthly chart. For us it will mean clear direction of trading for considerable period.
Still, major fundamental factors are still valid and even action to 1.20 should be treated as retracement…
In short-term perspective EUR has met major targets and strong resistance level, thus, odds suggest pullback in area of MPP on coming week.
The technical portion of Sive's analysis owes a great deal to Joe DiNapoli's methods, and uses a number of Joe's proprietary indicators. Please note that Sive's analysis is his own view of the market and is not endorsed by Joe DiNapoli or any related companies.
Reuters reports dollar index slipped on Friday, putting it on track to fall for a fifth week, the longest stretch of declines in four years, as disappointing data on domestic factory activity and consumer sentiment stirred doubts about the U.S. economic growth.
Earlier, this measure of the greenback against a group of currencies including the euro and yen bounced from a four-month low as buying emerged with lower European bond yields, and as traders booked profits on this week's gains in other currencies against the greenback.
"The dollar is oversold. The data weren't all that great, but the story is people still see the Federal Reserve raising interest rates later this year," said Kathy Lien, managing director at BK Asset Management in New York.
The euro was up 0.2 percent to $1.1431, a tad below a three-month high of $1.1445 on Thursday and about 9 percent higher than a 12-year low of $1.0457 reached on March 16. That was the day the European Central Bank embarked on its 1.1 trillion euro bond-buying program, to which President Mario Draghi reiterated his commitment on Thursday.
The euro's rebound was partly helped by improved euro zone data and rising inflation expectations.
On the other hand, dollar bulls have been disappointed by a recent spate of U.S. data. First-quarter growth has been lacklustre and there has been little evidence of a rebound in the second quarter.
On Friday, data on New York state manufacturing and readings on industrial output fell short of expectations, while a private gauge on U.S. consumer sentiment unexpectedly fell to its lowest in seven months in early May.
This down shift in the U.S. economy has helped stem a recent global bond market rout, which has narrowed the yield gap between Bunds and U.S. Treasuries and helped revive the euro.
The gap between 10-year Bunds and Treasuries narrowed to 153 basis points, from around 180 bps about a month ago, making the euro more attractive to investors.
CFTC data shows Speculators further pared back positive bets on the U.S. dollar in the latest period, pushing the currency's net long position to the lowest in nine months, according to Reuters calculations and data from the Commodity Futures Trading Commission released on Friday.
The value of the dollar's net long position fell to $29.11 billion in the week ended May 12, from $32.25 billion the previous week. Net longs on the dollar declined for a seventh straight week. It was also the fifth straight week that longs on the dollar came in below $40 billion. The dollar has been weakened by a slew of soft U.S. economic data. Net short positions on the euro, meanwhile, fell for a sixth straight week, totaling 178,976 contracts, down from 190,127 previously. The decline in the negative bets on the euro was helped by the dollar's woes and easing concerns about deflation in the euro zone.
But here we also see that Open interest has decreased for ~ 37K contracts. It tells that upside action on EUR mostly is driven by short covering. Still this action has a lot of resources, since there are large short positions and EUR still could show significant rally if this covering will continue. At the same time we need to keep an eye on whether this covering will trigger long position growth or not…
So, right now Greece stands in focus of EU economy and latest news suggest that Greece's government could ask for an emergency meeting of euro zone finance ministers at the end of the month, the government spokesman said on Thursday, referring to the end-May date by which it hopes to have a deal with its lenders on reforms.
Greece will make sure it pays upcoming debt obligations but a deal to address its liquidity needs must be struck soon, Gabriel Sakellaridis told a news conference.
At the same time investors stand far from any euphoria. The chances Greece will leave the euro zone are slightly less than one in four, according to a Reuters poll of traders, but if Athens defaults on a 750 million-euro debt repayment to the IMF on Tuesday the likelihood will increase.
That 23 percent median compares with the 40 percent probability traders gave a couple of weeks ago, when more than half of them said Greece could stay in the bloc even if it defaults on repayments.
"The default and the Grexit are two very different things," said a trader at a large dealer. "They can default or partially default, but they will not leave the euro zone.
"If they fail to pay the IMF tomorrow … the euro could rise by 10-15 percent, but whatever happens in the coming days … they will not leave euro zone."
Greece is running out of money to keep paying wages and pensions, raising concern about whether it will be able to make the IMF repayment. But European Union officials still expect it to.
The country is in the midst of negotiating a new cash-for-reform deal with its euro zone partners to help end an era of austerity that has weakened economic growth.
"There has to be a solution to keep Greece in the system, otherwise Greece will have a huge problem" a trader said.
Greece gross domestic product numbers, to be released on Friday, are expected to show the economy shrank 0.5 percent on a quarterly basis in the first three months of the year.
The poll also showed that banks will borrow 95.0 billion euros at the European Central Bank's weekly tender, similar to the 95.2 billion euros maturing on Tuesday.
Technicals
Monthly
As we have estimated previously 1.05 is 1.27 extension of huge upside swing in 2005-2008 that also has created awful butterfly pattern. Recent action does not quite look like normal butterfly wing, but extension is valid and 1.05 is precisely 1.27 ratio. At the same time we have here another supportive targets, as most recent AB=CD, oversold and 1.27 of recent butterfly.
Now think what do we have – market at 1.27 butterfly target and oversold, CFTC data shows overextension of shorts positions. Recent data has led to dovish forecast on US rates, while EU recent data conversely was mostly positive, as well as earnings reports of EU companies. This smells like solid upside retracement. CFTC data also points on more active short covering positions.
April has closed and confirmed nicely looking bullish engulfing pattern. We know that most probable target of this pattern is length of the bars counted upside. This will give us approximately 3/8 Fib resistance 1.1810 area. Could we call this situation as “Stretch”? By features probably yes, since market is oversold at support, but by letter not quite, since 1.12 level mostly was broken and the area where market stopped was not a Fib level. Still, applying here Stretch target (middle between OB and OS bands) we will get an area of 50% resistance of most recent swing down around 1.22 area.
Another very important moment here is recent thrust down itself. Take a look – it is perfect for DiNapoli directional pattern, say, B&B “Sell”, or even DRPO… but B&B seems more probable. You can imagine what B&B means on monthly chart – large swings, definite direction of trading for weeks. Retracement up has no limitation from monthly overbought level. We think that we need to be focus mostly on B&B from 1.22 area, just because market is oversold. That’s why 3/8 level could not hold upside retracement. In 1.22 area also stand previous lows.
Still, our next long-term target stands the same – parity as 1.618 completion point of recent butterfly. Currently we should treat this bounce up, even to 1.22 area, only as retracement within bear trend. Yes, tactically fundamentals have become weaker in US, and open door for pause in bearish trend, but overall picture has not changed drastically yet.
Weekly
Trend is bullish on weekly chart and as we’ve estimated last week ¬we have confirmed DRPO “Buy” in place. Still our suggestion was correct and market was not able to move significantly higher due existence of strong resistance cluster around 1.14-1.15 area that includes Fib level, MPR1, broken YPS1 and Overbought. Second one coincides with monthly level around 1.18-1.20. Weekly chart shows that it will be also K-area. And this area approximately coincides with 50% level of DPRO thrust that is the target of this pattern. So, as monthly picture as weekly one point on high probability of reaching 1.18-1.20 area in medium term perspective. But action to this area should start after retracement down. This retracement, in turn, will be major object of our attention since we’re looking chance for taking long position here.
On Friday market finally has reached this resistance area. We were waiting almost 2 weeks for it. As monthly pattern as Double REPO here assumes further upward continuation. Particularly speaking, minimum target of DRPO is 50% level of its thrust, i.e. ~ 1.1650. Currently we worry to promise something definite, after absolutely explosive action on GBP when retracement that we’ve expected didn’t come. But, based on technical picture here, chances suggest appearing of retracement rather than just upside continuation. Besides, any position taking process should be reasonable. Do we want to go long at weekly overbought and strong resistance area? I guess not…
Daily
Finally, guys, EUR has completed our trading plan for the week and reached major daily target level. It includes AB-CD 1.618 extension, MPR1 and finalize 3-Drive “Sell” pattern. Also we should remember that this level is also weekly Fib resistance, overbought and former YPR1 ~1.1467. It means that here should be relatively safe to go short. If even we will be wrong and market will continue move higher without meaningful retracement down to MPP, some minor downward bounce probably should happen and this will let us to move stops to breakeven.
Daily picture matches well to big EUR puzzle. On monthly we have bullish engulfing and expect retracement back inside the body of it before upward action will start. On weekly market is overbought at Fib resistance and despite that we have DRPO “Buy” there – chances on pullback are significant and finally, on daily – appearing of 3-Drive and completion major AB=CD makes retracement very probable.
Thus, monthly engulfing and weekly DRPO (although they are the same pattern in fact) give us confidence with upside continuation while daily patterns and weekly overbought @ Fib resistance let us count on pullback that we should use for long entry. It’s very good picture. Most probable pullback target is the same and we’ve talked about it – MPP around 1.10 area. It has not been tested yet and it approximately matches 50% level of upside action and EUR likes 50% levels…
1-Hour
Currently guys we have only this butterfly “Sell” as a context for taking short position. But as this pattern really is not small, it suggests a bit extended stop order. That’s why you can either decrease position size or wait for some smaller pattern that could be formed here in the beginning of the week that will let you to enter with tighter orders.
Meantime we will discuss possible short entry here. Butterfly trading rules suggest taking short at 1.27 butterfly point and place stop above 1.618 one – this is ~ 1.1550 area, but better to place stop slightly higher that 1.1570 – this is daily overbought level and your order hardly will be hit just occasionally. Target will stand at MPP ~ 1.10 area. Risk/reward ratio is nice but as pattern is rather large – it demands corresponding stop.
Conclusion:
EUR could turn to solid upside retracement that will be notified even on monthly chart. For us it will mean clear direction of trading for considerable period.
Still, major fundamental factors are still valid and even action to 1.20 should be treated as retracement…
In short-term perspective EUR has met major targets and strong resistance level, thus, odds suggest pullback in area of MPP on coming week.
The technical portion of Sive's analysis owes a great deal to Joe DiNapoli's methods, and uses a number of Joe's proprietary indicators. Please note that Sive's analysis is his own view of the market and is not endorsed by Joe DiNapoli or any related companies.