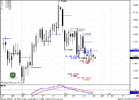
FOREX PRO Weekly November 21-25, 2011

well, i guess you hit ur stop loss, pretty quickly....

;) Ofcourse .... Love it dun like move stoploss and takeprofit .. but earlier win ..i end my day with winner ... morning on Asian session i Take another short ..... actually i am a long time looser :p but 2:1 risk reward i get 10% every month ... i loose 5 i win 5 but always end up with 5-10% gain ...


Morning on asian session i take it .... simple just my mentor sive sir teach me :) Kiss and Lovly
 

Attachments

  • prakash.gif
    prakash.gif
    28.6 KB · Views: 23
EUR/USD Daily Update, Tue 22, November 2011

Good morning,
market has shown downward move right from hourly Agreement, as we've discussed in weekly research, but it has failed to continue move down and now holds in the same range.

On daily time frame there is nothing new, so our focus today will be again on intraday chart and we will try to analyze choppy and sloppy retracement's price action, that is partially a slice&dice game.
One thing that is clearly seen on daily and could be important for us is that market has not touched yet pivot point at 1.3576.

On 4 hour chart we see two possible patterns - one of them we need to enter, another one to estimate profit objective. First one is potential Gartley "222" Sell at 1.3581. We have nice thrusting bar and 0.618 retracement as BC leg now. Pay attention, that 1.0 extension of AB=CD stands right around pivot. Second - it stands below failure point of Butterfly that is 1.3614. So, very probable that butterfly will survive.

On hourly chart we see smaller "222" Buy pattern with potential target at 1.3446. But currently market stands at Agreement around 1.3470-1.3473, so I can't exclude that it could continue move to the upside right from that area.

So, current context is very comfortable. Daily trend is bearish. We have to levels to watch for 1.3614 - if market will break it, then our short-term downward context will be canceled. 1.3430 - if market will move below it befor reaching 1.3576-1.3581, then 4-hour "222" will be cancelled and probably Butterfly has started to work already.

Our perfect scenario is search for sell patterns on 5 min chart if market will reach 1.3576-1.3581. Risk/reward ratio quite attractive.
 

Attachments

  • EUR_D_22_11_11.PNG
    EUR_D_22_11_11.PNG
    42.8 KB · Views: 66
  • EUR_1H_22_11_11.PNG
    EUR_1H_22_11_11.PNG
    44.7 KB · Views: 65
  • EUR_4H_22_11_11.PNG
    EUR_4H_22_11_11.PNG
    42.8 KB · Views: 77
5 mins

Hey sive, 5 mins chart showing wash and rinse of previous highes and bearish divergence. but the the only point is as i mentioned that its around previous highs, 1.3540.
 
Hi Yousuf,
it might be due reaching of 0.618 AB=CD target. Let's see. If market will erase AB=CD, then probably it's time to pass to second part of our plan...
 
EUR/USD Daily Update, Wed 23, November 2011

Good morning,
Our trading plan is now under way. Market has accomplished AB=CD on 4 hour chart, almost hit pivot point and continue move down. So, realizing on Butterfly "Buy" is now very probable.

On daily time frame is not much to comment. I just want to attack your attention how market acts around previous 0.618 support. It uses it as some foundation, bases on it.
This has bearish bias and very common for further downward continuation.
Next daily target is 1.3242 AB=CD point.

4-hour trend also has turned bearish. Next target is 1.3355-1.3375 area: 0.786 daily support, pivot support 1 and 1.27 Butterfly target

hourly chart will help you, if you have missed to enter yesterday. Trend is bearish, market now stands at completion of 1.0 extension target 1.3454. Probably the most suitable level to enter short, if you're bearish is 1.3480. All trends are bearish, market is not at at oversold, so we need to use nearest Fib resistance to enter.
Still, stop should be placed somewhere above K-area 1.3495-1.350. Also, pay attention to nature of the move- long nasty bar and acceleration from 0.618 to 1.0 target. Market has a lot of chances to conitnue move down further
 

Attachments

  • EUR_1H_23_11_11.PNG
    EUR_1H_23_11_11.PNG
    47.9 KB · Views: 60
  • EUR_4H_23_11_11.PNG
    EUR_4H_23_11_11.PNG
    44.8 KB · Views: 64
  • EUR_D_23_11_11.PNG
    EUR_D_23_11_11.PNG
    43.2 KB · Views: 55
HELP!!!

hello sive,
have been away so i missed your recommended entry point? can you be kind enough to show me a good/safe price to join the trend if the markets moves further downward or do you think the market would retrace up? if yes where do spot as a good entry for a sell position? thanks alot...cheers
 
Entry point

hello sive,
have been away so i missed your recommended entry point? can you be kind enough to show me a good/safe price to join the trend if the markets moves further downward or do you think the market would retrace up? if yes where do spot as a good entry for a sell position? thanks alot...cheers

Hi There,

Not sure if you have watched daily vidieo entry point 13480---13500 at fib levels are good.

Maybe good idea if you have been away to have a read of Sives weekly Anyalis.

Have a good day.

Asif
 
hello sive,
have been away so i missed your recommended entry point? can you be kind enough to show me a good/safe price to join the trend if the markets moves further downward or do you think the market would retrace up? if yes where do spot as a good entry for a sell position? thanks alot...cheers

Hi Asaju,
Market has hit first 1.27 target of butterfly and support level. Probably it is not neccesary to be hurry currently - some retracement is possible. Wait for tomorrow's daily update and video.
 
Back
Top