FOREX PRO WEEKLY November 25-29, 2013

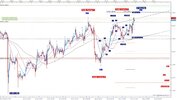
and here it is, my bullish picture..

I said that even we break 1,35788 I will be just a small bull and here it is why; I am aware that double and also triple zigzags can combined each wave but we are nesting high just to follow development when it will change direction.
As it is, we could be in last wave and just high above 1,35788 is to expect and if it will just go in false break the height is limited at 1,3601; eventual touch&piercing 1,3601 would mean double zigzag is in play in this wave...

Good trading!

20131126_2245_H1.jpg

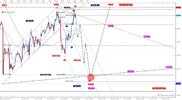
and here is one of my older picture where I predicted false breaks in both directions and i think we really could get just 20-30 pips breaks

20131124_2305_H2.jpg

ps
apologize, on first picture is labeling wrong: it is not flat but zigzag so instead of blue aF/bF/cF should stay a/b/c
 
Last edited:
ciao Ghandi,
devi perdonare il mio errore, non sono molto brava. Grazie per la tua risposta!!

Barbara
Nothing is right or wrong, we are just looking at different swings.
Current swng I monitor has a target at 1.37, the 3/4 mark is at 35990, 1/2 is at 1.3497.

Remember we have a Butterfly that will be completed just above 1.36, after a break out, more time than not we will have a pullback after a target has been completed.
 
Hello

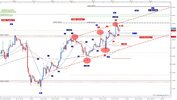
So, there are 2 possibilities:

1. 5th wave of ending diagonal is in place and we will start down move

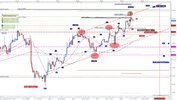
2. ending diagonal is still in progress and we are topping 3rd wave; I marked H4 swing fractals with red circles to be better seen on H1 TF (last upper could become fractal in 60+ minutes); I also marked developing of potential 3rd wave and 4th with red; as I see we VERY probable topped 3rd, marked red y; theoretically we could make 5 waves y but then overlapping 1st would be impossible or very hard to be in play EXCEPT in case of ending diagonal shaped c wave; if 3rd is in place 4th is limited with channel and piercing lower line will tell that either we are already in move down either I am wrong and we will make double zigzag up move in near future...

Good trading!

20131127_0955_H1.jpg

ps
I do not want to make mess with blue count&labels untill neccessary
 
Hello again

had to finish blue option because this one could be very tricky because 4th could go below red channel

20131127_1015_H1.jpg
 
As I had some nice profits since yesterday PM @ 1.3530 I just exited all as I am so uncertain in which direction market will continue . Thank you/Spasiba @Sive , thanks also to Minimax once again as his input raised my concerns for the current "unbalance" (call it sideways or range/ranging markets) .
Sorry for one naive question : A "Stop Graber" is a candle which is at an extrem and forms the swing of a trend . It could be the lowest candle in the correction of a long trend . It allows me to "grab a stop" for a trade at nice CRV . Is this understanding correct ? I was searching for the wording but w/o success . So I ask here as the answer also might help others . And I apologise for the "off topice" in this thread

Best regards
KB
Stop grabber is for my oppinion very best DiNapoli tool, I think has the best results but unfortunately not available for all platforms, I even can not find for mt4.

macd predictor indicator
 
Temporrary conclusions:

1. Possibilty 1 is out, 5th was not in place
2. Blue possibility I also not accept any more
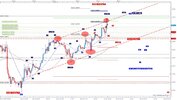
3. Price hit 100% dark blue ab and I think more upside really puts Overlaping under question so we might get some heights licking but I do not expect some radical up move but I expect abc correction down move into 4ED; we have target with 1ED top @1,35589 and limit with channel line; after establishing 4ED we will get height limit for 5th wave

Good trading!

20131127_1115_H1.jpg
 
Timing and Ambush

Regarding timing: IF 3ED is topped 4ED should be bottomed tomorrow afternoon latest, at 20.00 CET all lines cross! Because of Holidays I think this 4th will last as long as possible so 5th could be topped Monday or even Tuesday

AMBUSH: except some to me unreasonable move up we could get Triple zigzag but then we need volatility because 2ED is where I see it and bigger angle lower overlaping task;price should hit point w @1,35704 and not touch 1ED @1,35589; only 1 guess where point a of this corrective wave will take place?

As long as 1,35867 )my broker level!) holds there is possibility of licking high, below I lower probability

20131127_1330_H1.jpg
 
Back
Top