Sive Morten
Special Consultant to the FPA
- Messages
- 18,648
We’ve talked about EUR in details on Friday and I’ve shown you my nearest expectations, so let’s take a look at Cable…
Monthly
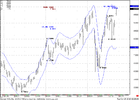
Look at this compressed chart #1 – 1.40-1.45 is a long term 0.618 Fib support that holds market since 90’s. In the recent time market has touched this level twice and retraced.
#1
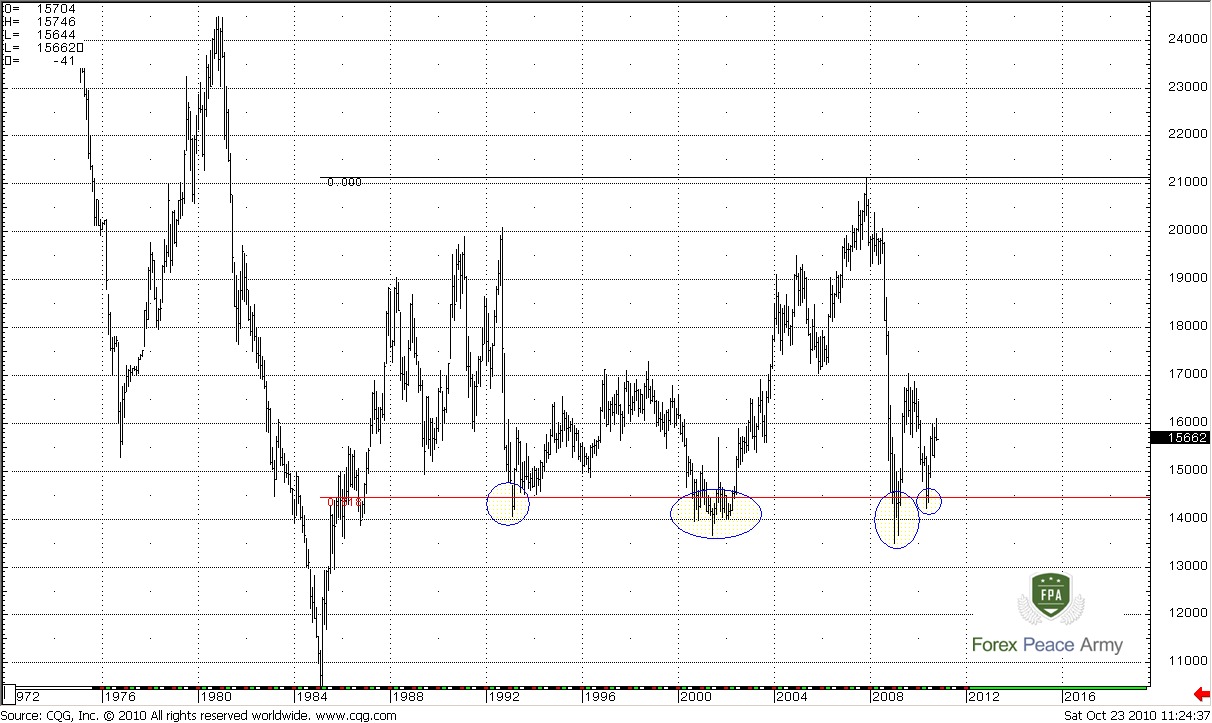
Current monthly trend is bullish. BC move down has been held by 0.786 Fib support from AB leg. Also take a note, that in C point market has tried to turn trend bearish but failed and trend has returned to bullish very fast. For the recent 3 months market is flirting with 0.618 Fib resistance. It has penetrated it twice, so I do not think that this level is still strong. The single target that is currently logic is a nearest one – 0.618 Fib expansion from ABC-bottom pattern at 1.6422 that makes an Agreement with 0.786 Fib resistance. Next target is 100% expansion at 1.7778 that also creates an Agreement with Fib resistance, but it’s not logical now, because it beyond monthly overbought level that is a blue line of Oscillator Predictor on the chart. So, currently we have a single monthly target not far above the market. This upside context will be valid until minimum in C point holds.
#2
Weekly
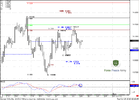
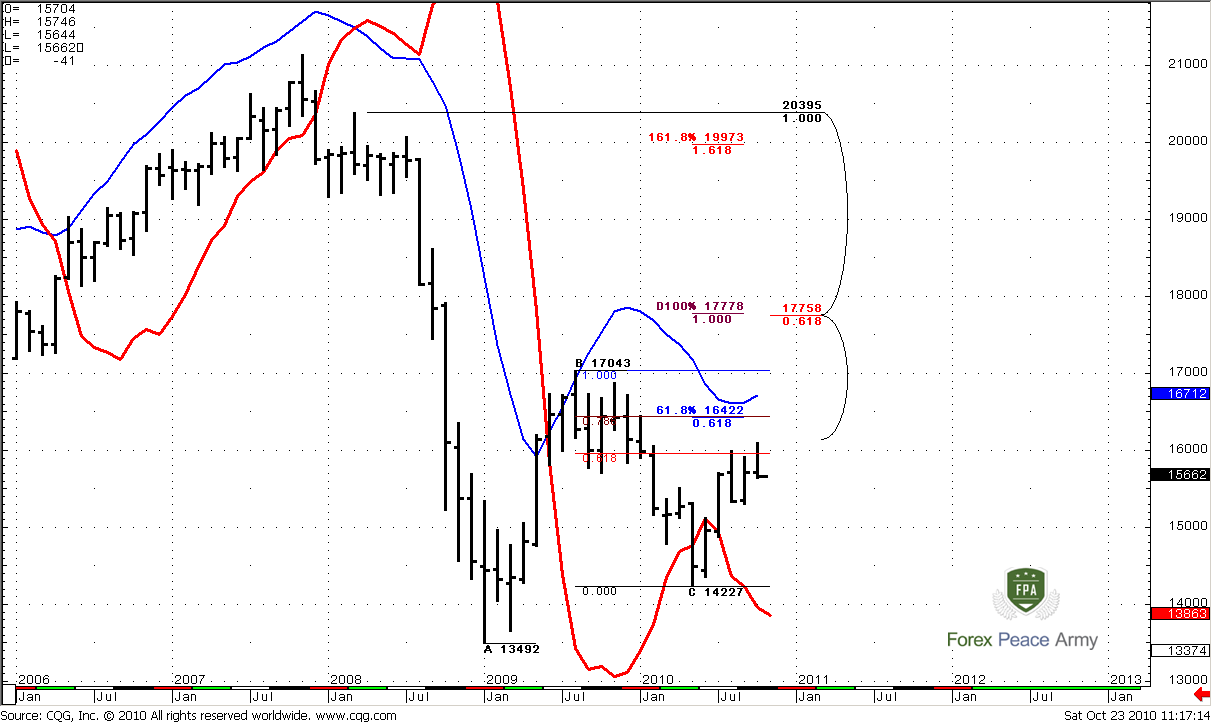
Weekly chart is very interesting currently. As we’ve discussed, down move has started after Wash and Rinse of a previous highs. Monthly 0.618 Fib resistance and monthly pivot resistance 1 have held the market around 1.60 like during the previous move up.
Now, market has passed through highest Fib support 1.5792 like it does not exist and engulfs almost the whole previous month with current down move. On the weekly chart we have two strong supports areas and both of them are Confluence supports that also coincide with monthly pivot points. Let’s look at them with more scrutiny.
The first area of Confluence support is 1.5603-1.5659 also contains a monthly pivot point at 1.5639 that has not been tested yet by the market. As I’ve told million of times – market trades pivots in 70% of cases. Also take a note that MACD Predictor comes in play on coming week (in circle). This fact is very important. If this area of support will not hold, then weekly trend will turn bearish and this will be absolutely another strategy to apply. Also, we should look at this chart at the end of coming week, because if it will be MACD Predictor failure aka DiNapoli “Stop grabber”, then we will get a confidence in further up move.
Second support is a Confluence area at 1.5385-1.5387 and monthly pivot support 1 1.5363. This area contains 3/8 Fib support from major reaction point, that marked with “*” symbol. Move of the market to this area also looks logical, because when market starts a retracement during the rally – it usually retraces to the pivot support 1.
Anyway, for now it’s impossible to say which support area will hold the market. I prefer to see that the first area will do this, because it will give me the confidence that bulls are still control the market. If at the end of the second week I will see MACDP failure pattern – much better. But the probability of this scenario is not solid, because, if we take a look at a previous move down that has started with the same sell-off – we can see, that the second area has more chances to hold the market then first one.
In any case we should watch for some patterns at lower time frames to judge about the strength of weekly support levels.
#1
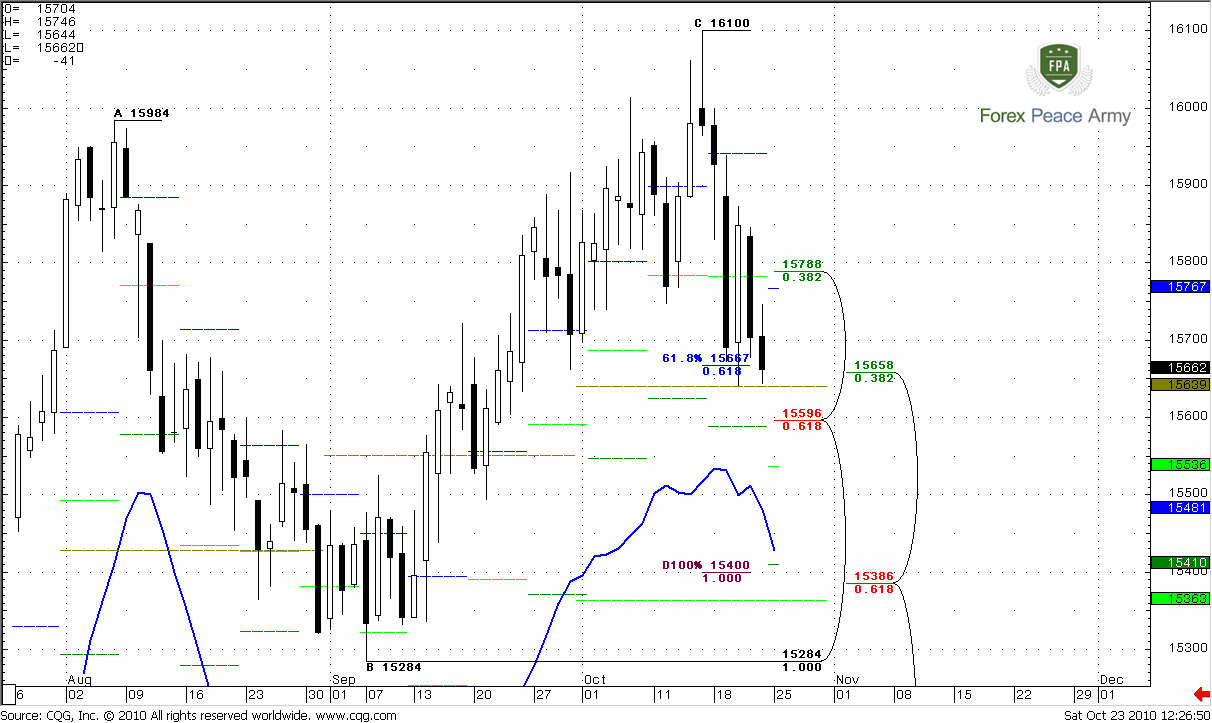
Daily
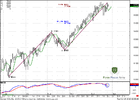
May be this time frame has no definite signals, nevertheless in contains a lot of details that are important. Let’s start to track market price action right from C-point at 1.61. First of all, market has run through weekly pivot (blue dash line), weekly pivot support 1 (lime dash line) and Fib support at 1.5788 without any meaningful bouncing. Market moves directly to our first weekly support area. Also market has accomplished 0.618 target from ABC-top pattern at .15667
Although market has shown nice jump from this area of support after the first touch, market totally erased this move up during the next couple of days. Area of support weaker as market touches it again and again, so as a weekly points. All this stuff makes me thing that bears are stronger then it seems on the first look. May be this is a retracement on a larger time frames, but here it looks like solid move down.
Now about the targets. If market will pass through this support, the next target is 100% expansion at 1.54 that coincides with our second weekly support area. Also this is a daily oversold.
#1
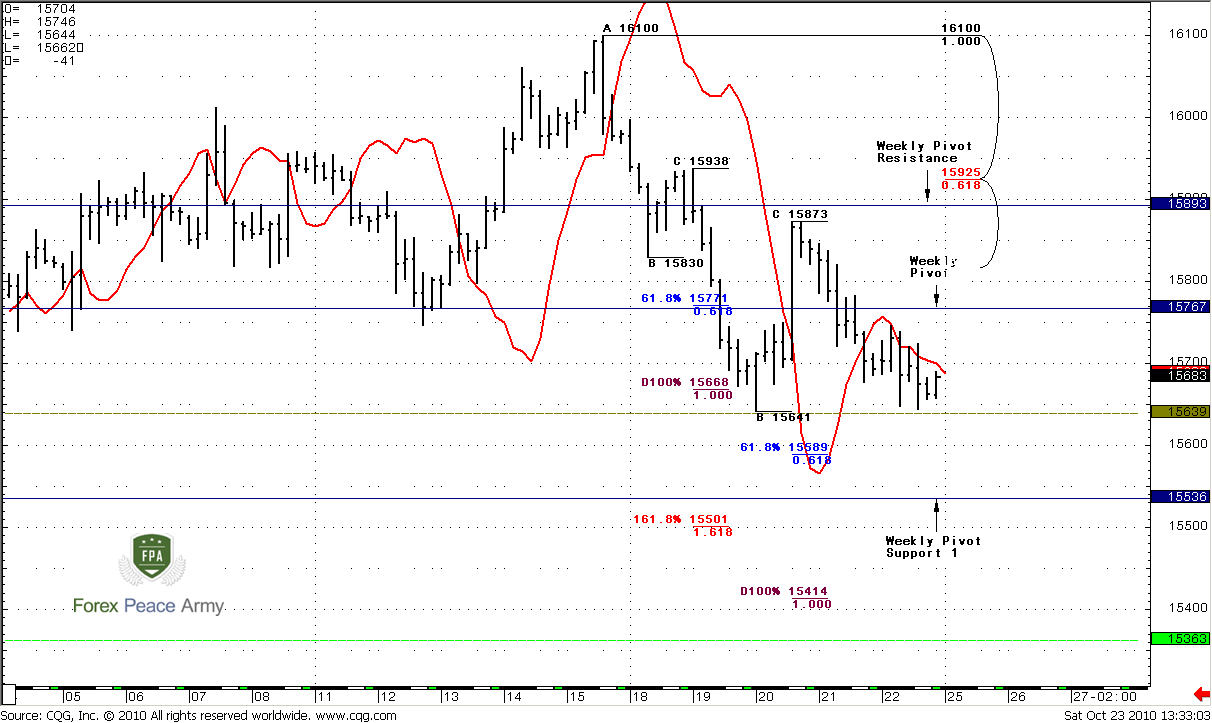
4-Hour
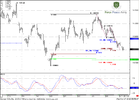
Here we can see couple of ABC-top patterns. Market has reached 100% expansion from the small ABC. Acceleration from 61.8% to 100% expansion usually leads to 1.618% expansion after 0.618 retracement. And this has already happened. The larger ABC pattern has a 100% target at 1.5414 very close to the second weekly support area.
Now take a look at red line that is MACD Predictor. During the thrust bar trend has turned bullish, but then market absolutely erased this attempt to shift price action. Moreover, we see negative dynamic pressure – although trend was bullish, price action was not. Now we can see some stop grabbers.
Currently, I do not see any definite signals on the market. The weekly pivot point for coming week is 1.5767. Personally I will be watch for price action around pivot. If market will break it above – then the move to 1.5893 – weekly pivot resistance 1 is very probable and we should treat this move as a retracement in the sell-off. Also this level is very close to Fib resistance at 1.5925. If market will fail there, then, possibly we should expect continuation of the down move.
Conclusion:
Long-term.
I still think that market should reach 1.64 area. Monthly bullish context is still valid.
Short term
Based on recent price action the breakout of the first weekly support area is very probable, so retracement to the downside can reach as far as 1.54. But possibly it can happen not during the single week.
In the beginning of the coming week I will be track the price action around weekly pivot point. If market will move above it, so then, retracement to 1.59 area is probable. If market will fail at pivot – then I expect move to 1.54
The technical portion of Sive's analysis owes a great deal to Joe DiNapoli's methods, and uses a number of Joe's proprietary indicators. Please note that Sive's analysis is his own view of the market and is not endorsed by Joe DiNapoli or any related companies.
Monthly
Look at this compressed chart #1 – 1.40-1.45 is a long term 0.618 Fib support that holds market since 90’s. In the recent time market has touched this level twice and retraced.
#1
Current monthly trend is bullish. BC move down has been held by 0.786 Fib support from AB leg. Also take a note, that in C point market has tried to turn trend bearish but failed and trend has returned to bullish very fast. For the recent 3 months market is flirting with 0.618 Fib resistance. It has penetrated it twice, so I do not think that this level is still strong. The single target that is currently logic is a nearest one – 0.618 Fib expansion from ABC-bottom pattern at 1.6422 that makes an Agreement with 0.786 Fib resistance. Next target is 100% expansion at 1.7778 that also creates an Agreement with Fib resistance, but it’s not logical now, because it beyond monthly overbought level that is a blue line of Oscillator Predictor on the chart. So, currently we have a single monthly target not far above the market. This upside context will be valid until minimum in C point holds.
#2
Weekly
Weekly chart is very interesting currently. As we’ve discussed, down move has started after Wash and Rinse of a previous highs. Monthly 0.618 Fib resistance and monthly pivot resistance 1 have held the market around 1.60 like during the previous move up.
Now, market has passed through highest Fib support 1.5792 like it does not exist and engulfs almost the whole previous month with current down move. On the weekly chart we have two strong supports areas and both of them are Confluence supports that also coincide with monthly pivot points. Let’s look at them with more scrutiny.
The first area of Confluence support is 1.5603-1.5659 also contains a monthly pivot point at 1.5639 that has not been tested yet by the market. As I’ve told million of times – market trades pivots in 70% of cases. Also take a note that MACD Predictor comes in play on coming week (in circle). This fact is very important. If this area of support will not hold, then weekly trend will turn bearish and this will be absolutely another strategy to apply. Also, we should look at this chart at the end of coming week, because if it will be MACD Predictor failure aka DiNapoli “Stop grabber”, then we will get a confidence in further up move.
Second support is a Confluence area at 1.5385-1.5387 and monthly pivot support 1 1.5363. This area contains 3/8 Fib support from major reaction point, that marked with “*” symbol. Move of the market to this area also looks logical, because when market starts a retracement during the rally – it usually retraces to the pivot support 1.
Anyway, for now it’s impossible to say which support area will hold the market. I prefer to see that the first area will do this, because it will give me the confidence that bulls are still control the market. If at the end of the second week I will see MACDP failure pattern – much better. But the probability of this scenario is not solid, because, if we take a look at a previous move down that has started with the same sell-off – we can see, that the second area has more chances to hold the market then first one.
In any case we should watch for some patterns at lower time frames to judge about the strength of weekly support levels.
#1
Daily
May be this time frame has no definite signals, nevertheless in contains a lot of details that are important. Let’s start to track market price action right from C-point at 1.61. First of all, market has run through weekly pivot (blue dash line), weekly pivot support 1 (lime dash line) and Fib support at 1.5788 without any meaningful bouncing. Market moves directly to our first weekly support area. Also market has accomplished 0.618 target from ABC-top pattern at .15667
Although market has shown nice jump from this area of support after the first touch, market totally erased this move up during the next couple of days. Area of support weaker as market touches it again and again, so as a weekly points. All this stuff makes me thing that bears are stronger then it seems on the first look. May be this is a retracement on a larger time frames, but here it looks like solid move down.
Now about the targets. If market will pass through this support, the next target is 100% expansion at 1.54 that coincides with our second weekly support area. Also this is a daily oversold.
#1
4-Hour
Here we can see couple of ABC-top patterns. Market has reached 100% expansion from the small ABC. Acceleration from 61.8% to 100% expansion usually leads to 1.618% expansion after 0.618 retracement. And this has already happened. The larger ABC pattern has a 100% target at 1.5414 very close to the second weekly support area.
Now take a look at red line that is MACD Predictor. During the thrust bar trend has turned bullish, but then market absolutely erased this attempt to shift price action. Moreover, we see negative dynamic pressure – although trend was bullish, price action was not. Now we can see some stop grabbers.
Currently, I do not see any definite signals on the market. The weekly pivot point for coming week is 1.5767. Personally I will be watch for price action around pivot. If market will break it above – then the move to 1.5893 – weekly pivot resistance 1 is very probable and we should treat this move as a retracement in the sell-off. Also this level is very close to Fib resistance at 1.5925. If market will fail there, then, possibly we should expect continuation of the down move.
Conclusion:
Long-term.
I still think that market should reach 1.64 area. Monthly bullish context is still valid.
Short term
Based on recent price action the breakout of the first weekly support area is very probable, so retracement to the downside can reach as far as 1.54. But possibly it can happen not during the single week.
In the beginning of the coming week I will be track the price action around weekly pivot point. If market will move above it, so then, retracement to 1.59 area is probable. If market will fail at pivot – then I expect move to 1.54
The technical portion of Sive's analysis owes a great deal to Joe DiNapoli's methods, and uses a number of Joe's proprietary indicators. Please note that Sive's analysis is his own view of the market and is not endorsed by Joe DiNapoli or any related companies.