Sive Morten
Special Consultant to the FPA
- Messages
- 18,727
Monthly
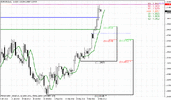
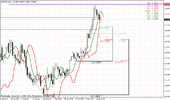
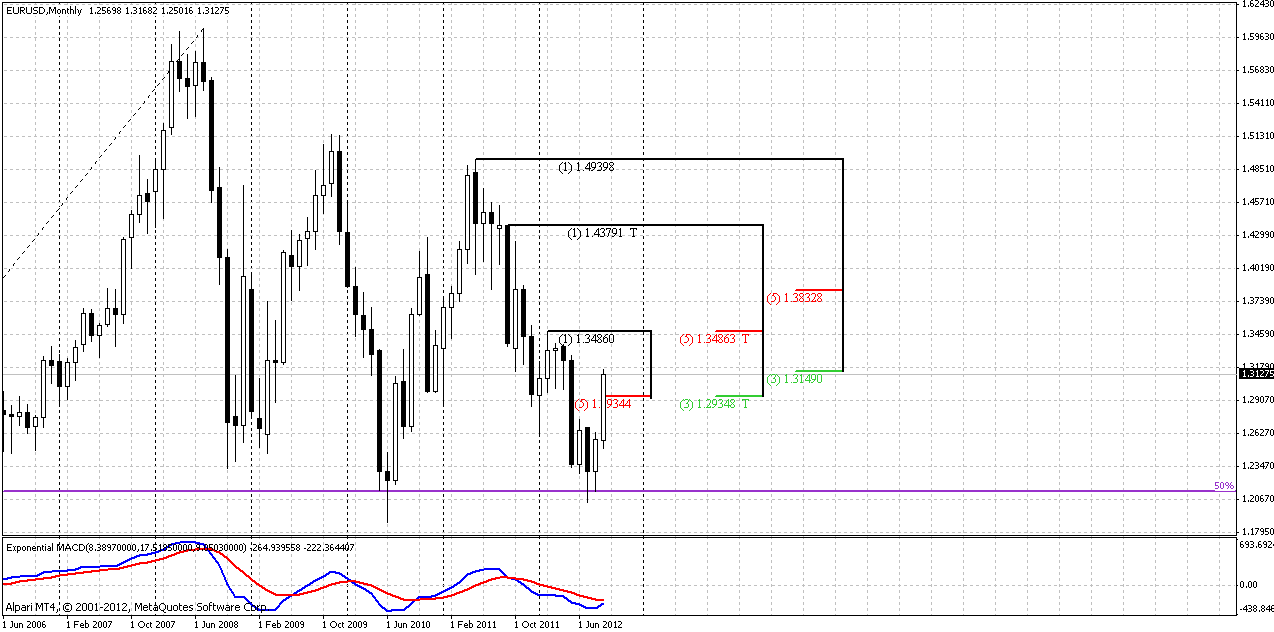
Well, we’ve talked much about current situation on forum within previous week. So, what conclusions we can make from technical picture. Monthly trend still holds bearish, but price stands very close to its breakeven point. If this upward pace will continue in October, then we could expect either stop grabber on monthly chart or trend shifting. Now price has moved inside of monthly K-resistance, although has not quite break it yet. Despite solid price action to the upside, our major conclusion here is that market at significant resistance. It is still logically to expect respect of this area.
Also I’ve checked the possibility of monthly B&B Sell here, but come to conclusion that hardly we could call current action as B&B. Previous retracement has reached 0.382 resistance and that put under question treatment of current action as B&B. I’m not sure that can call it even Look-alike. But the nature of action is in a row with nature of B&B – solid thrust down and first significant retracement up. Anyway downward momentum is still here and it is significant. Take a look, how it has happened two times previously – solid upward bar and long bar down. Something of this kind I expect here as well.
Weekly
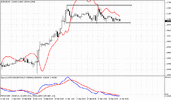
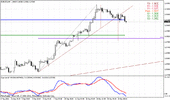
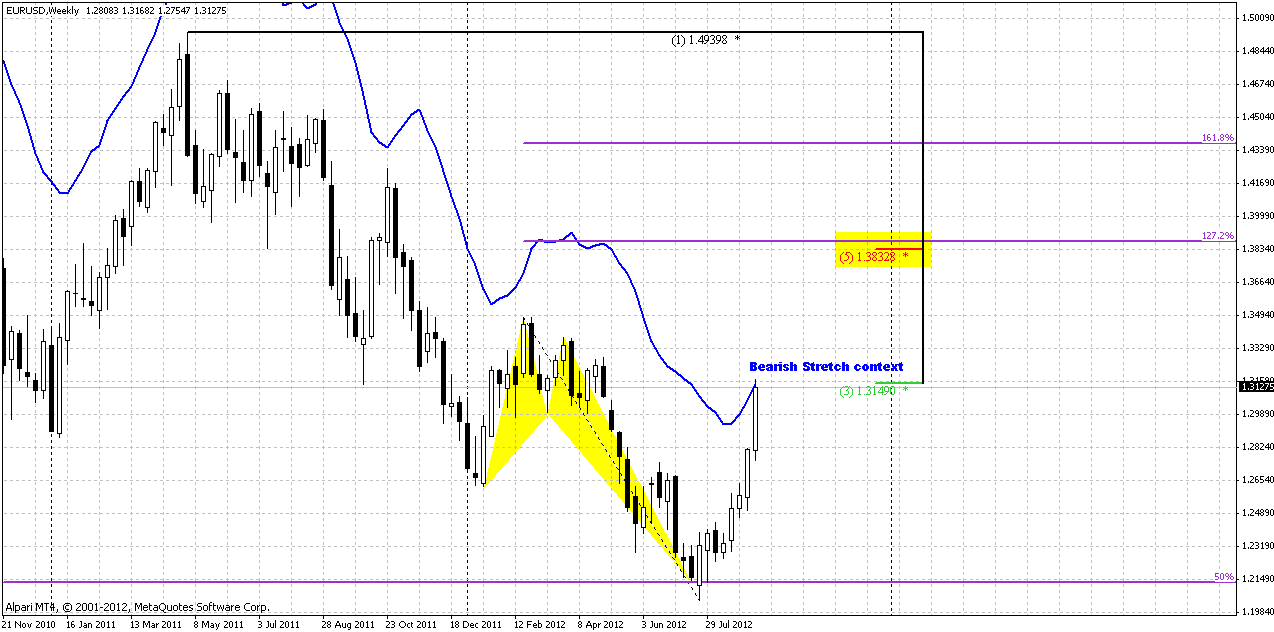
Weekly trend is strongly bullish, I even do not have MACD on this chart. Here we have another bearish context – Bearish Stretch pattern. This is a combination of overbought condition and significant resistance. Here we have Monthly K-resistance, or at least monthly significant 3/8 resistance, if you want. This pattern does not erase overall strongly bullish sentiment and price action. Stretch mostly is retracement pattern. By this combination market tends to leave it, since overbought in combination with resistance press on it.
Although I’ve deleted Monthly Pivot levels from this chart – market has moved significantly higher MPR1. That is a sign of strength and medium-term reversal – as well as other patterns and moments that we’ve discussed already. Based on current patterns that we have on weekly – this could be move to 1.38 that is Butterfly 1.27 destination and major 5/8 resistance. Current pace of recovery tells that this is absolutely possible.
All that I would like to tell is about retracement. Since we create trading plan week-by-week, currently I want to attract your attention that odds of retracement are high.
Another moment that is worthy to be monitored is current thrust on weekly. Although it is not significant currently, it could become a context for Directional patterns in nearest future – weekly DRPO or B&B patterns.
Daily
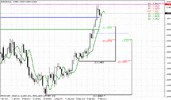
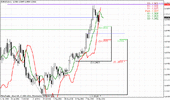
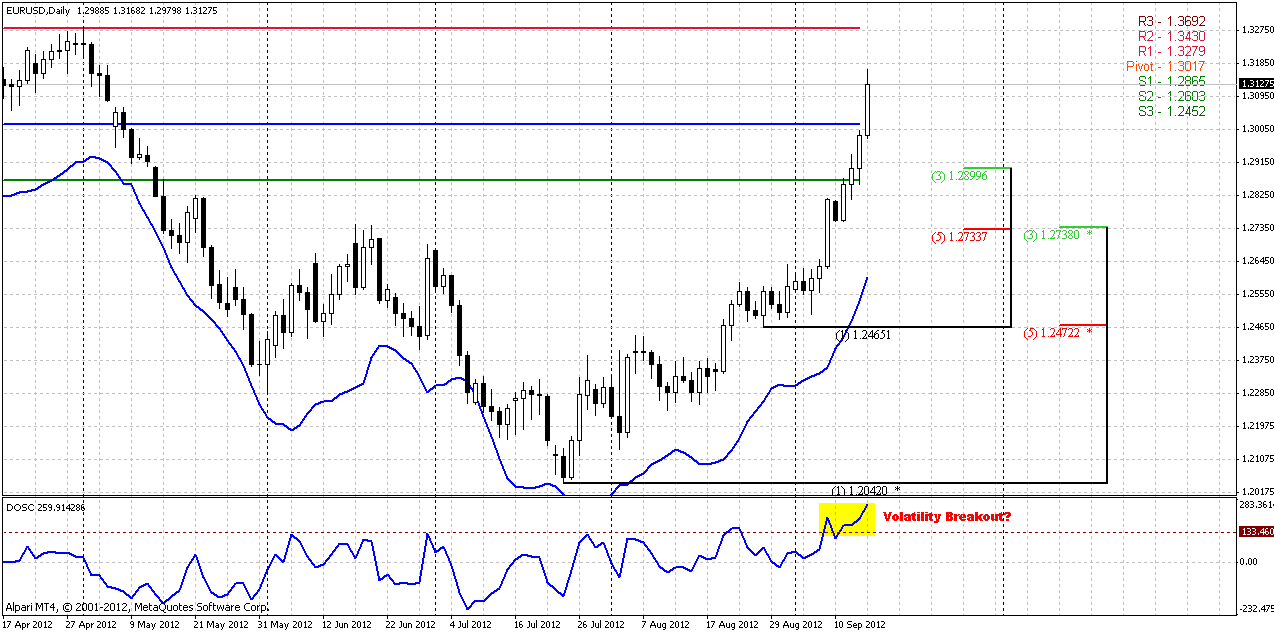
Here we do not have any patterns yet. Instead of that I would like to attract your attention to another tool that could be quite rare seen on markets. I’m talking about volatility breakout (VBO) that is described in DiNapoli book. That’s why I always take a look at DOSC indicator, although I have Predictor. Only DOSC shows VBO. But is it really VBO? You may argue that DOSC showed the same value in September 2011 and you will be right. From that standpoint it is difficult to call it VBO. But, if you will take a look how price stands in relation to DOSC and Predictor. In 2011 price just touched Overbought. That is absolutely normal. But what do we have here – whole week market stands above 100% oversold. If we will take in consideration that currency market is financial one and not commodities for which is not unnatural to stand in overbought for some time. Financial markets, in contrast, can’t stand in overbought long time. How to trade VBO?
VBO suggests 0.618 retracement that should be used to enter in direction of breakout. Then we should apply classical extension and take profit either on new overbought level or at extension target. By this strategy retracement should reach daily Confluence support at 1.2730 area that also will be daily oversold. Most recent swing up (that is a swing for VBO, by the way) is also suitable for any directional pattern as well. So you can see that here we have a lot of different combinations what could really happen in nearest future.
Here is one nuance still exists. AS we know usually WPS1 holds retracement is this is true upward trend on the market. On next week WPS1 stands in agreement with nearest Fib support. How we could see deeper retracement then, and will it mean trend breakout? I see answer in weekly overbought. This is like too much boat lurch – when it tends to middle condition it strongly lurch to other board first and then gradually fluctuated tends to equilibrium. Now we have a boat that strongly lurched in overbought. Hence, during retracement it will tend to oversold on daily chart. Other worlds reaction is equal to counter-reaction. That’s why retracement could be deep. Another reason, as I’ve said in previous research – bearish momentum is still strong and this is first upward move after solid bear trend.
1-hour
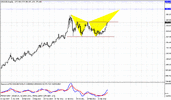
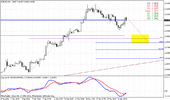
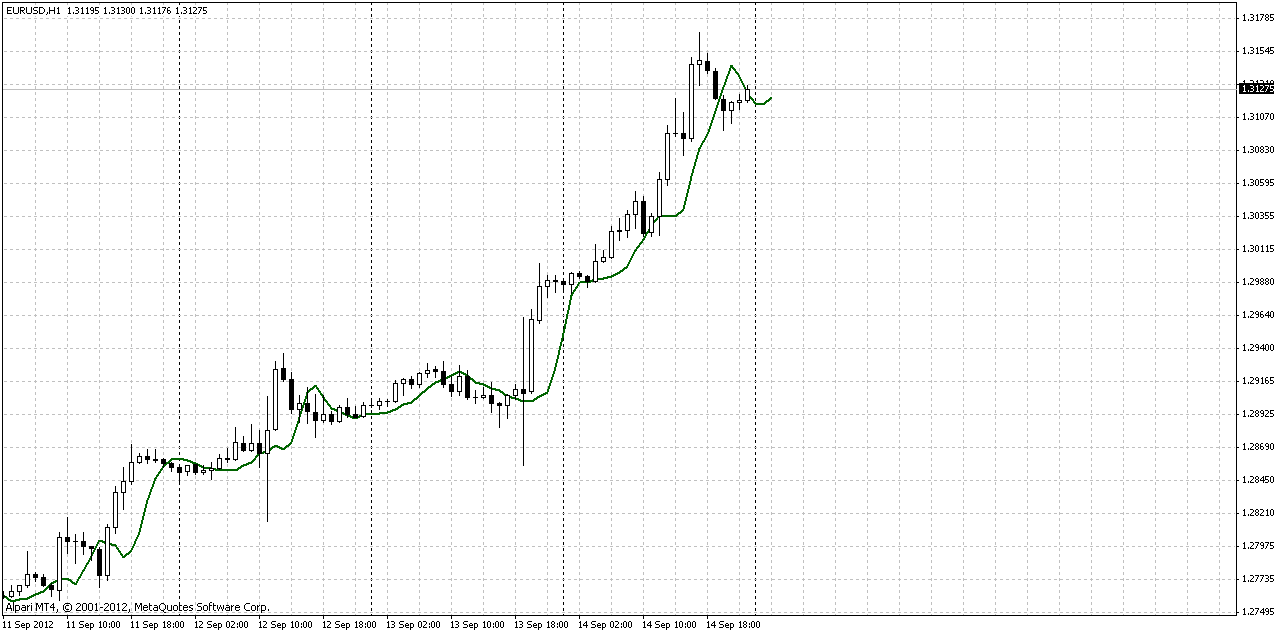
On intraday charts I do not see much interesting, since market is just approaching to significant levels and targets. Thus, price has hit 1.618 butterfly target on daily. As you can see, here DRPO “Sell” is possible. But I hope to see some more significant pattern on other time-frames during coming week.
Conclusion:
So, here are facts for you:
1. All trends are bullish, market shows strong recovery pace;
2. Market has passed through MPR1.
But:
1. Market at daily and weekly overbought;
2. Price stands at significant monthly Fib resistance.
3. This is first bullish swing up and bearish momentum is still here.
Make your own choice how you will act. My thoughts – we probably will see further upward continuation, but current situation hints on potential retracement, that could be deep, because this is first reversal swing after solid bear trend and market at daily and weekly overbought. By these thoughts clear trading plan suggests waiting retracement and buy deep to take part in further upward move.
The technical portion of Sive's analysis owes a great deal to Joe DiNapoli's methods, and uses a number of Joe's proprietary indicators. Please note that Sive's analysis is his own view of the market and is not endorsed by Joe DiNapoli or any related companies.
Well, we’ve talked much about current situation on forum within previous week. So, what conclusions we can make from technical picture. Monthly trend still holds bearish, but price stands very close to its breakeven point. If this upward pace will continue in October, then we could expect either stop grabber on monthly chart or trend shifting. Now price has moved inside of monthly K-resistance, although has not quite break it yet. Despite solid price action to the upside, our major conclusion here is that market at significant resistance. It is still logically to expect respect of this area.
Also I’ve checked the possibility of monthly B&B Sell here, but come to conclusion that hardly we could call current action as B&B. Previous retracement has reached 0.382 resistance and that put under question treatment of current action as B&B. I’m not sure that can call it even Look-alike. But the nature of action is in a row with nature of B&B – solid thrust down and first significant retracement up. Anyway downward momentum is still here and it is significant. Take a look, how it has happened two times previously – solid upward bar and long bar down. Something of this kind I expect here as well.

Weekly
Weekly trend is strongly bullish, I even do not have MACD on this chart. Here we have another bearish context – Bearish Stretch pattern. This is a combination of overbought condition and significant resistance. Here we have Monthly K-resistance, or at least monthly significant 3/8 resistance, if you want. This pattern does not erase overall strongly bullish sentiment and price action. Stretch mostly is retracement pattern. By this combination market tends to leave it, since overbought in combination with resistance press on it.
Although I’ve deleted Monthly Pivot levels from this chart – market has moved significantly higher MPR1. That is a sign of strength and medium-term reversal – as well as other patterns and moments that we’ve discussed already. Based on current patterns that we have on weekly – this could be move to 1.38 that is Butterfly 1.27 destination and major 5/8 resistance. Current pace of recovery tells that this is absolutely possible.
All that I would like to tell is about retracement. Since we create trading plan week-by-week, currently I want to attract your attention that odds of retracement are high.
Another moment that is worthy to be monitored is current thrust on weekly. Although it is not significant currently, it could become a context for Directional patterns in nearest future – weekly DRPO or B&B patterns.

Daily
Here we do not have any patterns yet. Instead of that I would like to attract your attention to another tool that could be quite rare seen on markets. I’m talking about volatility breakout (VBO) that is described in DiNapoli book. That’s why I always take a look at DOSC indicator, although I have Predictor. Only DOSC shows VBO. But is it really VBO? You may argue that DOSC showed the same value in September 2011 and you will be right. From that standpoint it is difficult to call it VBO. But, if you will take a look how price stands in relation to DOSC and Predictor. In 2011 price just touched Overbought. That is absolutely normal. But what do we have here – whole week market stands above 100% oversold. If we will take in consideration that currency market is financial one and not commodities for which is not unnatural to stand in overbought for some time. Financial markets, in contrast, can’t stand in overbought long time. How to trade VBO?
VBO suggests 0.618 retracement that should be used to enter in direction of breakout. Then we should apply classical extension and take profit either on new overbought level or at extension target. By this strategy retracement should reach daily Confluence support at 1.2730 area that also will be daily oversold. Most recent swing up (that is a swing for VBO, by the way) is also suitable for any directional pattern as well. So you can see that here we have a lot of different combinations what could really happen in nearest future.
Here is one nuance still exists. AS we know usually WPS1 holds retracement is this is true upward trend on the market. On next week WPS1 stands in agreement with nearest Fib support. How we could see deeper retracement then, and will it mean trend breakout? I see answer in weekly overbought. This is like too much boat lurch – when it tends to middle condition it strongly lurch to other board first and then gradually fluctuated tends to equilibrium. Now we have a boat that strongly lurched in overbought. Hence, during retracement it will tend to oversold on daily chart. Other worlds reaction is equal to counter-reaction. That’s why retracement could be deep. Another reason, as I’ve said in previous research – bearish momentum is still strong and this is first upward move after solid bear trend.

1-hour
On intraday charts I do not see much interesting, since market is just approaching to significant levels and targets. Thus, price has hit 1.618 butterfly target on daily. As you can see, here DRPO “Sell” is possible. But I hope to see some more significant pattern on other time-frames during coming week.

Conclusion:
So, here are facts for you:
1. All trends are bullish, market shows strong recovery pace;
2. Market has passed through MPR1.
But:
1. Market at daily and weekly overbought;
2. Price stands at significant monthly Fib resistance.
3. This is first bullish swing up and bearish momentum is still here.
Make your own choice how you will act. My thoughts – we probably will see further upward continuation, but current situation hints on potential retracement, that could be deep, because this is first reversal swing after solid bear trend and market at daily and weekly overbought. By these thoughts clear trading plan suggests waiting retracement and buy deep to take part in further upward move.
The technical portion of Sive's analysis owes a great deal to Joe DiNapoli's methods, and uses a number of Joe's proprietary indicators. Please note that Sive's analysis is his own view of the market and is not endorsed by Joe DiNapoli or any related companies.
Last edited:
