IvanGlobalPrime
Company Representative
- Messages
- 36
Find my latest market thoughts
US GDP Q1 Icing On The DXY Bullish Trend?
POSTED ON: 26 APR, 2019
Ahead of today's preliminary Q1 GDP in the US, the Greenback failed to hold onto its recent gains, even if its ascendancy this week remains undeniably impressive. The whole FX universe will orbit around today's US growth data...
The Daily Edge is authored by Ivan Delgado, Market Insights Commentator at Global Prime. The purpose of this content is to provide an assessment of the market conditions. The report takes an in-depth look of market dynamics, factoring in fundamentals, technicals, inter-market in order to determine daily biases and assist one’s decisions on a regular basis. Feel free to follow Ivan on Twitter & Youtube.
Quick Take
Ahead of today's preliminary Q1 GDP in the US, the Greenback failed to hold onto its recent gains, even if its ascendancy this week remains undeniably impressive. The whole FX universe will orbit around today's US growth data, as a strong number would most likely seal a weekly close above a massive technical level in the DXY. If the scenario materializes, when combined with a EUR/USD closing sub 1.12 critical support and a USD/CNH above its respective 6.74 resistance, it could really send shockwaves across financial markets, as the notion of a period dominated by broad-based USD strength may gather steam quite rapidly as technicals align. In the meantime, as we wait for the US Q1 GDP, and Japanese Yen has been the outperformer, aided by a reported unwinding of elevated Yen short positions ahead of the Japanese 10-day Golden week holidays. The drop in global yields, including the US 30Y as our bellwether, alongside a rejection of levels near the all-time high in the S&P 500 have fueled the Yen momentum. The Euro, on the heels of yet another negative economic release out of Germany (IFO survey), remains on the backfoot. The same applies to the Sterling, with no Brexit breakthroughs. The Aussie has been under follow-through pressure by briefly breaking below the 0.70 level before a decent rejection. Alongside the Yen, the Kiwi was the other outperformer.

Narrative In Financial Markets

Source: Forexfactory
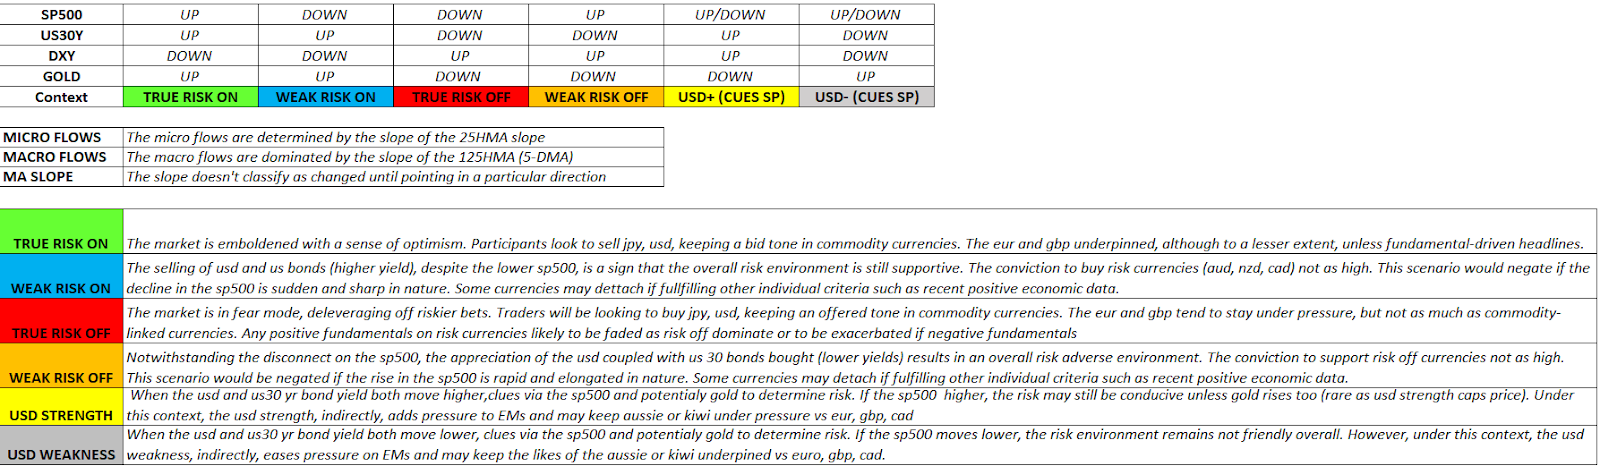
RORO (Risk On, Risk Off Conditions)
The worsening of the risk profile has been manifested in a higher Japanese Yen, bolstered even further as sources report traders are unwinding Yen short exposure ahead of the Japanese Golden week. To make the risk dynamics even less friendly, the DXY has accepted above the 97.60-70 resistance level for the second day in a row. Friday’s US GDP for Q1 takes an even greater degree of relevance, as a weekly close above the 97.60-70 in the DXY could potentially unravel a technically-driven rally in the USD (recent US fundamentals backing the trend) with a target of 99.50-100 as the next logical objective if one draws a 100% proj target.
When it comes to US yields, the aggressive slide away from the 3% mark in the US 30y bond, has anchored even more the sense of risk aversion, a narrative that is aided by the negative price action is US stocks away from all time highs in the last 24h, which has come accompanied with a VIX retesting the 14.00 handle. Friday’s price action is going to be a critical day for the interest of a shift in the low vol regime the Forex market has been trapped into in 2019. A weekly close above a resistance level not only in the DXY, but supported via an analogous weekly bullish picture whereby the USDCNH closes above 6.74 and a bearish one in the EUR/USD by closing sub 1.12, it would shake the grounds as expectations of a higher macro bullish USD trend will start rising, and with it, woes in emerging markets and risk.

Latest Key Technical Developments In G8 FX
Interested about downloading today's key levels in the major pairs? Find the MT4 templates, updated daily, by clicking the link.
EUR/USD: 200% Proj Target Hit, Firm Bearish Bias
The bearish extension has reached the 200% proj target, measured after the 1.1227-1.1191 breakout, first finding a cluster of bids at 1.1155 only to see the supply imbalance resume to the next target at 1.1120, where once again, market makers and profit taking have allowed a reversal. The market has been consolidating ever since the test of the 200% proj target, although with a descending trendline still guiding the price lower, the main bias remains clearly bearish this Friday ahead of the US Q1 GDP. Only a break above the 1.1163 would violate the bearish structure firmly in place.

GBP/USD: Bearish Cycle Maturity Evident
There are a number of factors that makes me think the exchange rate is reaching a potential technical bottom, even if the ultimate verdict is going to come via the US GDP Q1 release. Not only the selling has completed a set of 3 legs down, but each legs has been decreasing in magnitude. On top of that, the price has respected to the pip its 100% proj target, from where an aggressive buy-side campaign was initiated judging by the impulsiveness of the bullish move. The strong rebound got capped by the 3rd touch of a trendline, with price now finding support at 1.2890. If the exchange rate can hold above this latter level and break the descending trendline, a retest of 1.2915-20 is on the cards. On the contrary, acceptance below 1.2890 exposes a retest of the previous low.

USD/JPY: Bearish structure Emerges
The sharp 100p selloff from highs to lows in the last 24h has damaged the bullish technicals, leading to a new bearish cycle that should find a major cluster of offers around the 50% pullback and ADR limit for the day at 111.90 ahead of the round number at 112.00. Remember, today’s price action is going to be hugely conditioned by the US GDP print later on, with a beat on expectations likely to test the mentioned offers around the round number (depending on the data deviation), while disappointing figures will expose the next level of horizontal support found at the 111.30.

AUD/USD: Breaks 70c. On 3 Legs Tap
As in the case of the GBP/USD, the Aussie exchange rate is starting to show tentative signs that a more meaningful correction may develop, subject to the US Q1 GDP later today. The market has tested and rejected the liquidity-rich area under 70c. with a 3 legs compression on the way down, before transitioning into higher levels after a breakout of the 25MA on the hourly, which has also been accompanied by a change of structure on a micro scale as the pair starts printing higher highs. Finding equilibrium above the 0.7030 will be technically key to gain further momentum in such a much-needed correction after the intense selling seen. Note, the area of 7030, until proven violated, remains a sellers stronghold that will likely be defended for a continuation of the downtrend.

Important Footnotes
US GDP Q1 Icing On The DXY Bullish Trend?
POSTED ON: 26 APR, 2019
Ahead of today's preliminary Q1 GDP in the US, the Greenback failed to hold onto its recent gains, even if its ascendancy this week remains undeniably impressive. The whole FX universe will orbit around today's US growth data...
The Daily Edge is authored by Ivan Delgado, Market Insights Commentator at Global Prime. The purpose of this content is to provide an assessment of the market conditions. The report takes an in-depth look of market dynamics, factoring in fundamentals, technicals, inter-market in order to determine daily biases and assist one’s decisions on a regular basis. Feel free to follow Ivan on Twitter & Youtube.
Quick Take
Ahead of today's preliminary Q1 GDP in the US, the Greenback failed to hold onto its recent gains, even if its ascendancy this week remains undeniably impressive. The whole FX universe will orbit around today's US growth data, as a strong number would most likely seal a weekly close above a massive technical level in the DXY. If the scenario materializes, when combined with a EUR/USD closing sub 1.12 critical support and a USD/CNH above its respective 6.74 resistance, it could really send shockwaves across financial markets, as the notion of a period dominated by broad-based USD strength may gather steam quite rapidly as technicals align. In the meantime, as we wait for the US Q1 GDP, and Japanese Yen has been the outperformer, aided by a reported unwinding of elevated Yen short positions ahead of the Japanese 10-day Golden week holidays. The drop in global yields, including the US 30Y as our bellwether, alongside a rejection of levels near the all-time high in the S&P 500 have fueled the Yen momentum. The Euro, on the heels of yet another negative economic release out of Germany (IFO survey), remains on the backfoot. The same applies to the Sterling, with no Brexit breakthroughs. The Aussie has been under follow-through pressure by briefly breaking below the 0.70 level before a decent rejection. Alongside the Yen, the Kiwi was the other outperformer.
Narrative In Financial Markets
- The fortitude of the US Dollar is going to have to pass a serious test on Friday as the US releases its advance Q1 GDP numbers. Consensus expects growth to be rather stable at around 2.2%, identical to Q4. However, the uncertainty surrounding the Q1 GDP releases is significant due to the government shutdown over December-January. The latest economic data, from retail sales, trade balance, US goods orders, has heightened the expectations.
- Stronger-than-anticipated US durable goods orders is yet another sign that today’s US GDP could print a solid number. Capital goods orders nondefense ex ai was the outlier even if the USD, in a counter-intuitive move, didn't see much follow-through buying on the data.
- The ascendancy of the USD should be interpreted, partly, as a response to a larger number of Central Banks shifting to a more pronounced dovish bias. This week, we’ve seen a tilt in dovish outlooks for the RBA (lower Aus CPI), BOC, BOJ, and Riskbank, joining the rest of G10 Central Banks (ECB, RBNZ) in this globally coordinated dovish rhetoric. By default, it makes the US Dollar a more appealing destination of capital flows as part of carry trades as the Fed waits patiently on the sidelines, coupled with capital repatriation on a soaring US stocks market.
- Other factors assisting the strength in the USD is the fragility in the EU, with the softer German IFO survey, alongside poor data out of a major global supply-chain location such as South Korea (GDP miss) increasing the market’s concerns towards a still evident sluggish global growth, making the US an island of stability in comparison.
- Besides, it’s important to reiterate that last Friday’s Politburo – China’s ruling body headed by President Xi – hinted that while pro-growth policies targeting local business are not going away anytime soon, the PBoC appears ready to take the foot off the pedal, growing more comfortable with the set of measures introduced since last year to stimulate the economy. It means expectations for further accommodative measures have been somewhat downgraded.
- On Thursday, the Bank of Japan adjusted its policy statement on low rates, noting that it would keep interest rates at depressed levels ‘through at least around the spring of 2020’ as opposed to staying extremely low for an extended period of time. Furthermore, it revised down its outlook for inflation and growth, delaying the CPI projected target of 2% until at least March 2022. Remember, as in the case of Germany, the market is pricing negative bond yields up to 10y.
- It’s been reported that the outperformance of the Japanese Yen, can be partly explained due to traders cutting elevated short JPY positions ahead of the Golden week starting next Monday, a time when the Japanese markets will be closed for 10 days in a row.
Source: Forexfactory
RORO (Risk On, Risk Off Conditions)
The worsening of the risk profile has been manifested in a higher Japanese Yen, bolstered even further as sources report traders are unwinding Yen short exposure ahead of the Japanese Golden week. To make the risk dynamics even less friendly, the DXY has accepted above the 97.60-70 resistance level for the second day in a row. Friday’s US GDP for Q1 takes an even greater degree of relevance, as a weekly close above the 97.60-70 in the DXY could potentially unravel a technically-driven rally in the USD (recent US fundamentals backing the trend) with a target of 99.50-100 as the next logical objective if one draws a 100% proj target.
When it comes to US yields, the aggressive slide away from the 3% mark in the US 30y bond, has anchored even more the sense of risk aversion, a narrative that is aided by the negative price action is US stocks away from all time highs in the last 24h, which has come accompanied with a VIX retesting the 14.00 handle. Friday’s price action is going to be a critical day for the interest of a shift in the low vol regime the Forex market has been trapped into in 2019. A weekly close above a resistance level not only in the DXY, but supported via an analogous weekly bullish picture whereby the USDCNH closes above 6.74 and a bearish one in the EUR/USD by closing sub 1.12, it would shake the grounds as expectations of a higher macro bullish USD trend will start rising, and with it, woes in emerging markets and risk.
Latest Key Technical Developments In G8 FX
Interested about downloading today's key levels in the major pairs? Find the MT4 templates, updated daily, by clicking the link.
EUR/USD: 200% Proj Target Hit, Firm Bearish Bias
The bearish extension has reached the 200% proj target, measured after the 1.1227-1.1191 breakout, first finding a cluster of bids at 1.1155 only to see the supply imbalance resume to the next target at 1.1120, where once again, market makers and profit taking have allowed a reversal. The market has been consolidating ever since the test of the 200% proj target, although with a descending trendline still guiding the price lower, the main bias remains clearly bearish this Friday ahead of the US Q1 GDP. Only a break above the 1.1163 would violate the bearish structure firmly in place.
GBP/USD: Bearish Cycle Maturity Evident
There are a number of factors that makes me think the exchange rate is reaching a potential technical bottom, even if the ultimate verdict is going to come via the US GDP Q1 release. Not only the selling has completed a set of 3 legs down, but each legs has been decreasing in magnitude. On top of that, the price has respected to the pip its 100% proj target, from where an aggressive buy-side campaign was initiated judging by the impulsiveness of the bullish move. The strong rebound got capped by the 3rd touch of a trendline, with price now finding support at 1.2890. If the exchange rate can hold above this latter level and break the descending trendline, a retest of 1.2915-20 is on the cards. On the contrary, acceptance below 1.2890 exposes a retest of the previous low.
USD/JPY: Bearish structure Emerges
The sharp 100p selloff from highs to lows in the last 24h has damaged the bullish technicals, leading to a new bearish cycle that should find a major cluster of offers around the 50% pullback and ADR limit for the day at 111.90 ahead of the round number at 112.00. Remember, today’s price action is going to be hugely conditioned by the US GDP print later on, with a beat on expectations likely to test the mentioned offers around the round number (depending on the data deviation), while disappointing figures will expose the next level of horizontal support found at the 111.30.
AUD/USD: Breaks 70c. On 3 Legs Tap
As in the case of the GBP/USD, the Aussie exchange rate is starting to show tentative signs that a more meaningful correction may develop, subject to the US Q1 GDP later today. The market has tested and rejected the liquidity-rich area under 70c. with a 3 legs compression on the way down, before transitioning into higher levels after a breakout of the 25MA on the hourly, which has also been accompanied by a change of structure on a micro scale as the pair starts printing higher highs. Finding equilibrium above the 0.7030 will be technically key to gain further momentum in such a much-needed correction after the intense selling seen. Note, the area of 7030, until proven violated, remains a sellers stronghold that will likely be defended for a continuation of the downtrend.
Important Footnotes
- Risk model: The fact that financial markets have become so intertwined and dynamic makes it essential to stay constantly in tune with market conditions and adapt to new environments. This prop model will assist you to gauge the context that you are trading so that you can significantly reduce the downside risks. To understand the principles applied in the assessment of this model, refer to the tutorial How to Unpack Risk Sentiment Profiles
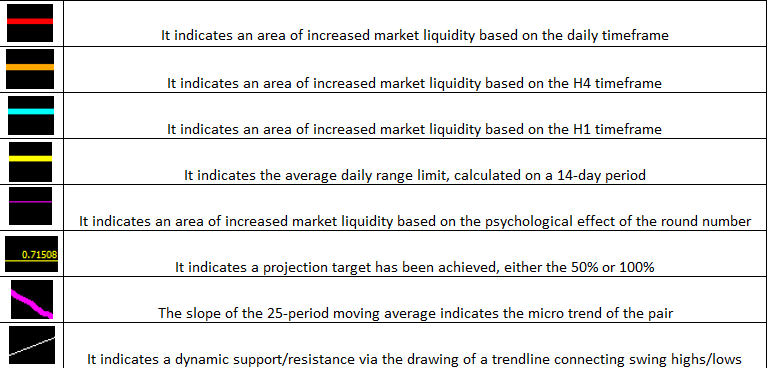
- Cycles: Markets evolve in cycles followed by a period of distribution and/or accumulation. The weekly cycles are highlighted in red, blue refers to the daily, while the black lines represent the hourly cycles. To understand the principles applied in the assessment of cycles, refer to the tutorial How To Read Market Structures In Forex
- POC: It refers to the point of control. It represents the areas of most interest by trading volume and should act as walls of bids/offers that may result in price reversals. The volume profile analysis tracks trading activity over a specified time period at specified price levels. The study reveals the constant evolution of the market auction process. If you wish to find out more about the importance of the POC, refer to the tutorial How to Read Volume Profile Structures
- Tick Volume: Price updates activity provides great insights into the actual buy or sell-side commitment to be engaged into a specific directional movement. Studies validate that price updates (tick volume) are highly correlated to actual traded volume, with the correlation being very high, when looking at hourly data. If you wish to find out more about the importance tick volume, refer to the tutorial on Why Is Tick Volume Important To Monitor?
- Horizontal Support/Resistance: Unlike levels of dynamic support or resistance or more subjective measurements such as fibonacci retracements, pivot points, trendlines, or other forms of reactive areas, the horizontal lines of support and resistance are universal concepts used by the majority of market participants. It, therefore, makes the areas the most widely followed and relevant to monitor. The Ultimate Guide To Identify Areas Of High Interest In Any Market
- Trendlines: Besides the horizontal lines, trendlines are helpful as a visual representation of the trend. The trendlines are drawn respecting a series of rules that determine the validation of a new cycle being created. Therefore, these trendline drawn in the chart hinge to a certain interpretation of market structures.
- Correlations: Each forex pair has a series of highly correlated assets to assess valuations. This type of study is called inter-market analysis and it involves scoping out anomalies in the ever-evolving global interconnectivity between equities, bonds, currencies, and commodities. If you would like to understand more about this concept, refer to the tutorial How Divergence In Correlated Assets Can Help You Add An Edge.
- Fundamentals: It’s important to highlight that the daily market outlook provided in this report is subject to the impact of the fundamental news. Any unexpected news may cause the price to behave erratically in the short term.
- Projection Targets: The usefulness of the 100% projection resides in the symmetry and harmonic relationships of market cycles. By drawing a 100% projection, you can anticipate the area in the chart where some type of pause and potential reversals in price is likely to occur, due to 1. The side in control of the cycle takes profits 2. Counter-trend positions are added by contrarian players 3. These are price points where limit orders are set by market-makers. You can find out more by reading the tutorial on The Magical 100% Fibonacci Projection
https://www.fxcm.com/markets/education/traits-successful-traders/