am currently considering this scenario Sive
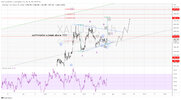
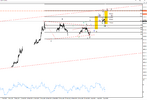
gold has not been able to rally up yesterday , it should be wave D up then E down then break new highs , well gold was flirting with lows , H4 candles bearish , it looks like wave iv bear flag breakout
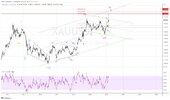
and triangle is too good to be true, when it is so clear , it tends to fail, it is 4:30 AM now , so by the time you post your analysis , if I see H4 closing bearish and new lows , I will take more confirmation bearish , target should be 1923 1917 , and tomorrow is weekly monthly closing, it is critical. Also silver daily close yesterday with such candle at top , often hints for a topping and bearish sequence
should anything change, will keep you posted
") I'm not a big expert in EW
I'm not a big expert in EW