Sive Morten
Special Consultant to the FPA
- Messages
- 18,695
Fundamentals
Weekly Gold Tading Report prepared by Sive Morten exclusively for ForexPeaceArmy.com
Gold rose on Friday as chart levels were broken, but was still heading for its first weekly fall in four weeks, pressured by a stronger dollar and renewed expectations for a U.S. rate hike this year. Flat initially, it gained momentum after a break of technical resistance at $1,196 that triggered automatic buy orders.
"This move is coming during a week when we didn't really have any gold-positive news but ...the way gold is putting up a fight at the moment is potentially giving some confidence to the market," Saxo Bank senior manager Ole Hansen said.
"But to make headwinds above the resistance area around $1,225 we need to see some real buying coming in."
"The 100-day moving average should serve as some upside resistance," said Matt Bradbard, director at RCM Alternatives, boutique advisory firm in Chicago, referring to spot gold's 100-day moving average at $1,211.69, just above the session high.
Gold on Friday shrugged off the impact of a stronger dollar and world equity markets, which tested record highs.
But the longer-term outlook is still bearish, traders said, and prices had surrendered gains after Federal Reserve officials suggested a June rate hike could still be in play.
Investors tend to shun gold, which does not pay interest, when market expectations point to U.S. interest rates rising.
Gold could drop to a five-year low of $1,100 this year due to the relative health of the U.S. economy compared to Europe and emerging markets, GFMS analysts at Thomson Reuters said.
Premiums for physical gold at the Shanghai Gold Exchange stood at a modest $1-$2 an ounce over the global spot benchmark on Friday.
Recent CFTC data shows small increase in net long position, mostly due shy growth of speculative longs and corresponding contraction of shorts. Open interest mostly stands the same. In general this does not change force balance significantly. As shorts have dropped they have not been restored yet, but no money has come to longs as well. SPDR fund shows not very big outflow of 3 tonnes last week. So, storages have dropped to 734 tonnes. The one thing is interesting here that this drop stands on background of gold upside action, especially in recent two days. So, fundamentally we could make the same conclusion that any upside action right now is dangerous journey to join, will be fragile and unstable and could finish at any moment. It does not mean that we can’t take bullish positions, but it will demand more attention and discipline, especially in stop placing.
Here is detailed breakdown of speculative positions:
Open interest:
 Shorts:
 Longs:
 Summary:
Technicals
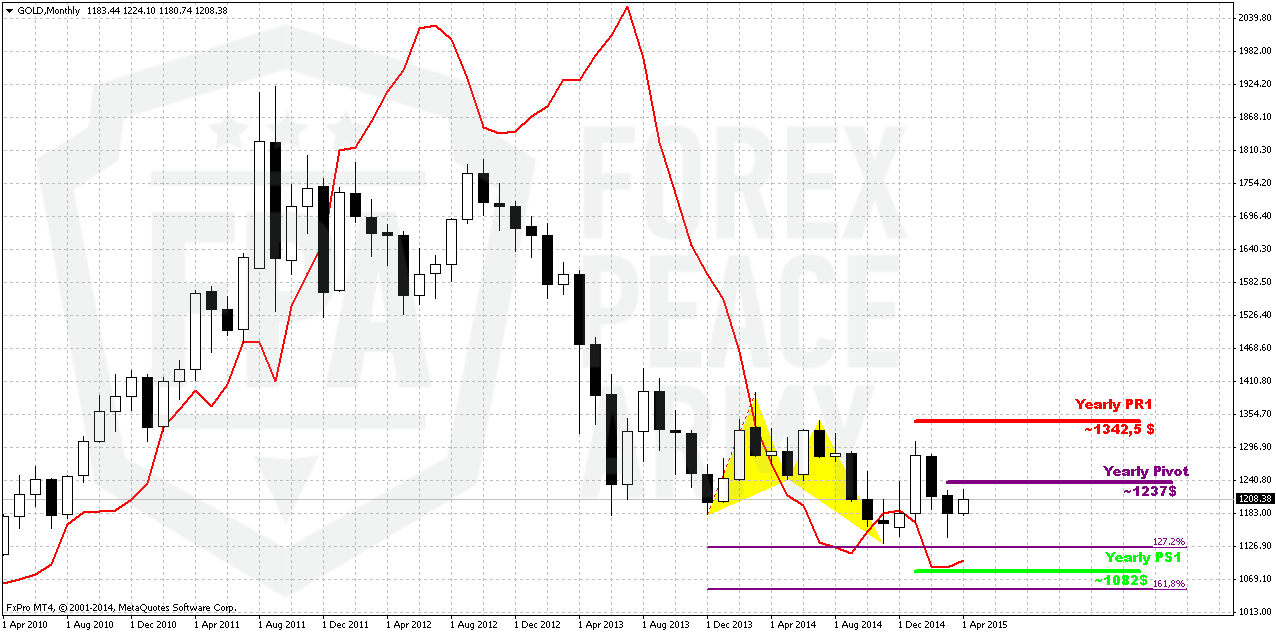
Monthly
There is really shy difference in close price from previous week. On long-term horizon we still have last big pattern in progress that is Volatility breakout (VOB). It suggests at least 0.618 AB-CD down. And this target is 1050$. At the same time we need 1130 breakout to start clearly speak on 1050 target.
In the beginning of the year market showed solid upside action. Gold was able to exceed yearly pivot, passed half way to Yearly Pivot resistance 1 but right now has reversed down and closed below YPP. From technical point of view this is bearish sign. This could be very significant moment and next logical destination will be yearly pivot support 1 around 1083$.
Recent US economy data mostly shows solid growth, but labor cost not as stably good as unemployment. Many investors concern about anemic wage growth, although in recent time this indicator shows improving. So, it seems that gold will remain hostage of dollar value and US economical data (mostly inflation) in nearest perspective. Approximately the same was announced by Fed in forecast on inflation and had become a reason of dovish approach to rate hiking. Another concern right now is too strong dollar that becomes a problem per se for economy growth.
Still, if we will take into consideration geopolitical situation and risks that have appeared recently, it could happen that situation will change, especially if situation in Ukraine will escalate and peaceful regulation will fail. Day by day we see worrying geopolitical news.
That’s being said, economical data in general (excluding recent NFP report) supports further gold decreasing but geopolicy could bring significant adjustment. Unfortunately the geopolicy is sphere where we can’t do much. As gold has passed through 1200, our next destination point is previous lows at 1130, but since gold is returning to them again – this is temporal destination and we should prepare for further downward action. Besides, right now we can clear recognized bearish dynamic pressure on monthly chart. Take a look, although trend has turned bullish, but market was unable to show more or less meaningful upside action. Right now we see the tendency of lower highs creation and this significantly increases chances on downward breakout.
Weekly
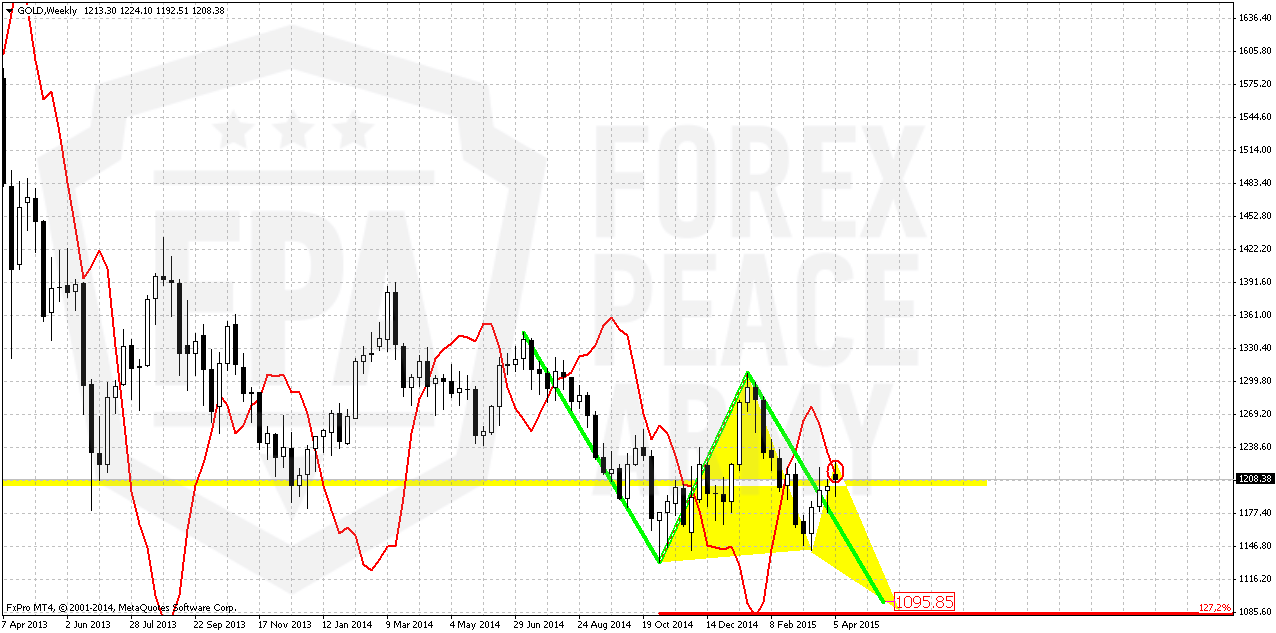
Trend is bearish here. Weekly chart also works “on perspective” since all patterns that we have here mostly are bearish. If you will take a look at weekly chart closely you will find a lot of different targets – AB-CD’s, couple of butterflies etc. By the way, most recent action also could turn to butterfly… and all of them have targets below current level.
On previous week we’ve expected the reaction on poor NFP data but reaction mostly was mild. If even market will continue move up somehow until it will hold below 1313 top – bearish sentiment will be valid, because monthly bearish dynamic pressure will be valid and market will keep chance on forming butterfly. Only if market will move above 1313 top – it will break tendency of lower highs and put under question further downward action.
This looks not very possible right now, especially when we’ve got bearish grabber on weekly. That’s the pattern that could trigger downward continuation. At least we could stick with its range for trading. It suggests taking out of former lows and could lead market simultaneously to AB=CD and butterfly destination points. This confirms that return back to 1130 area will be temporal even and just preparation for further drop.
All other targets stand significantly lower – 1080, 1050 and even 990$.
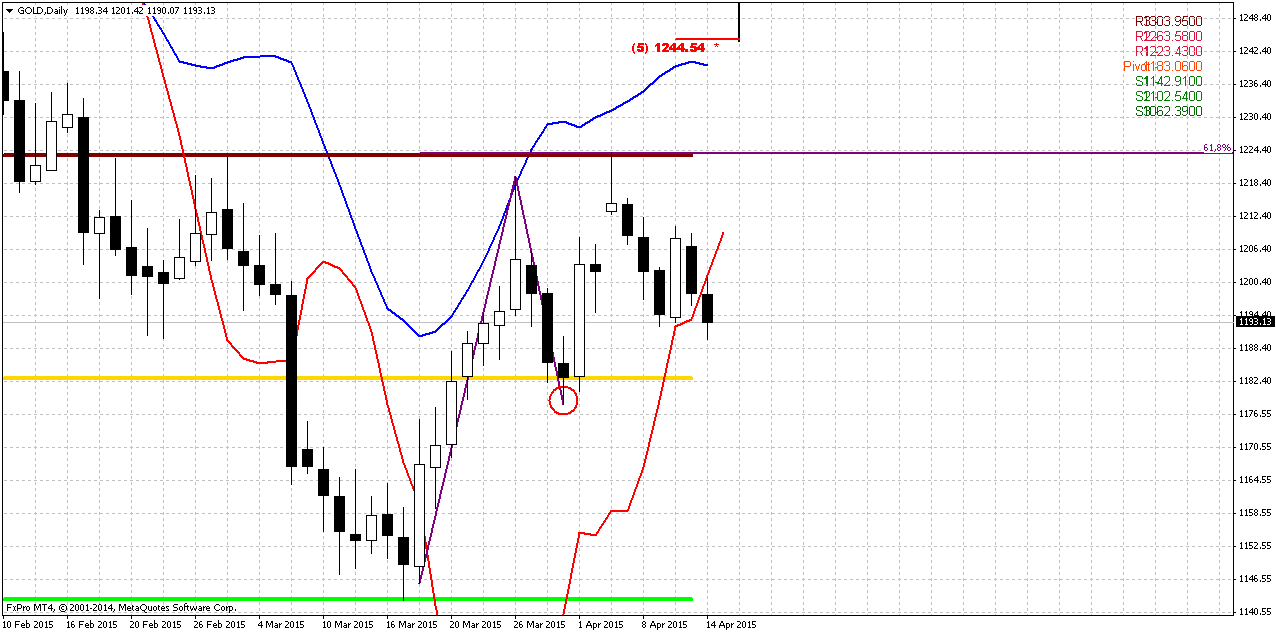
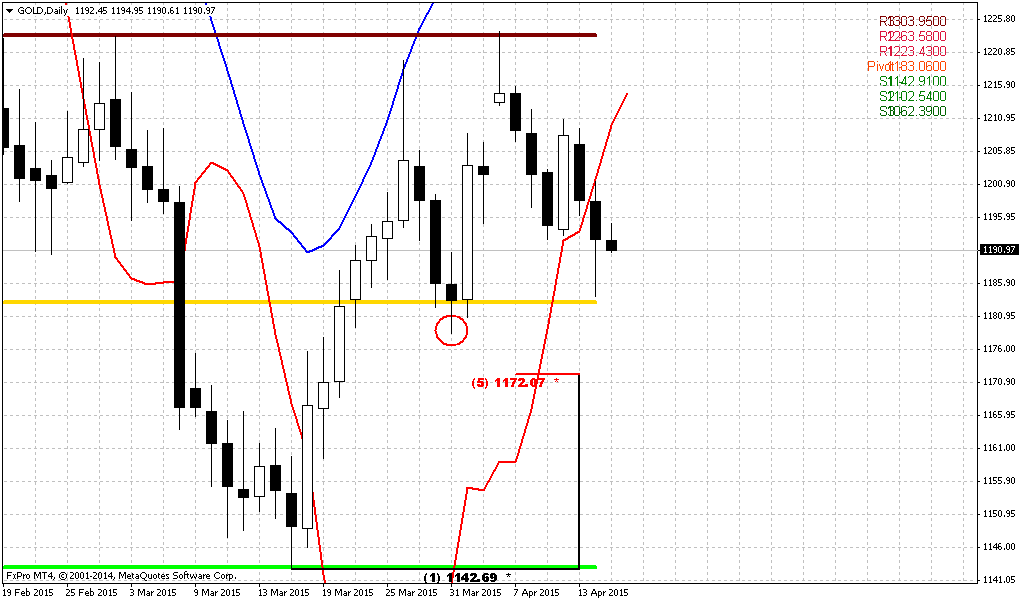
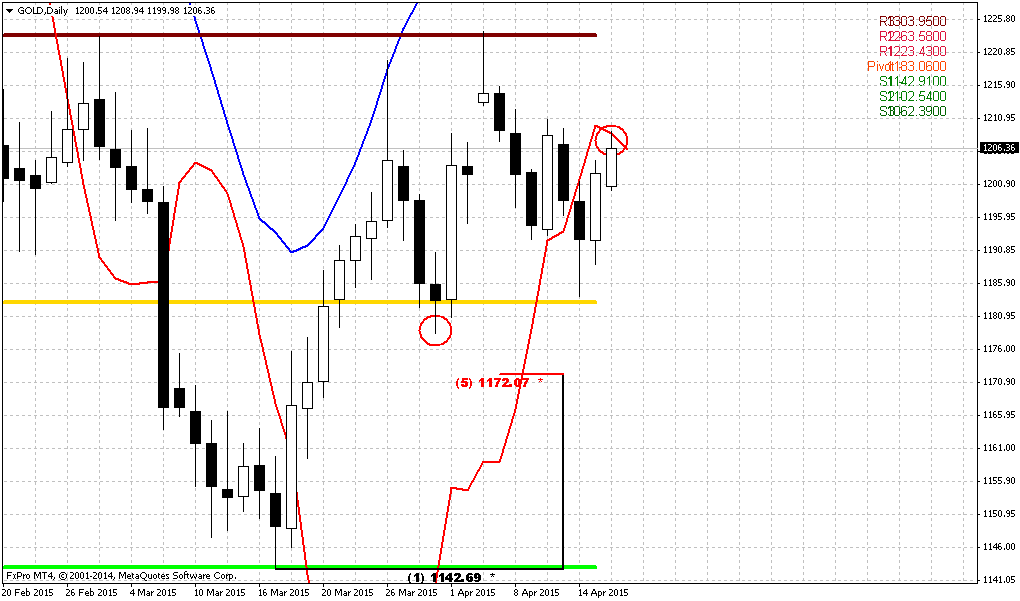
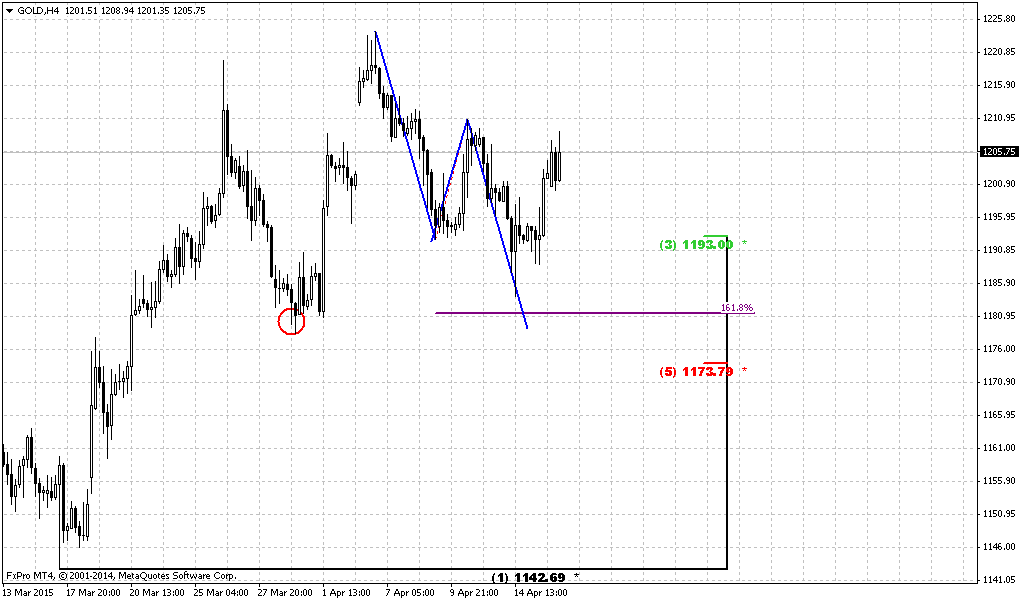
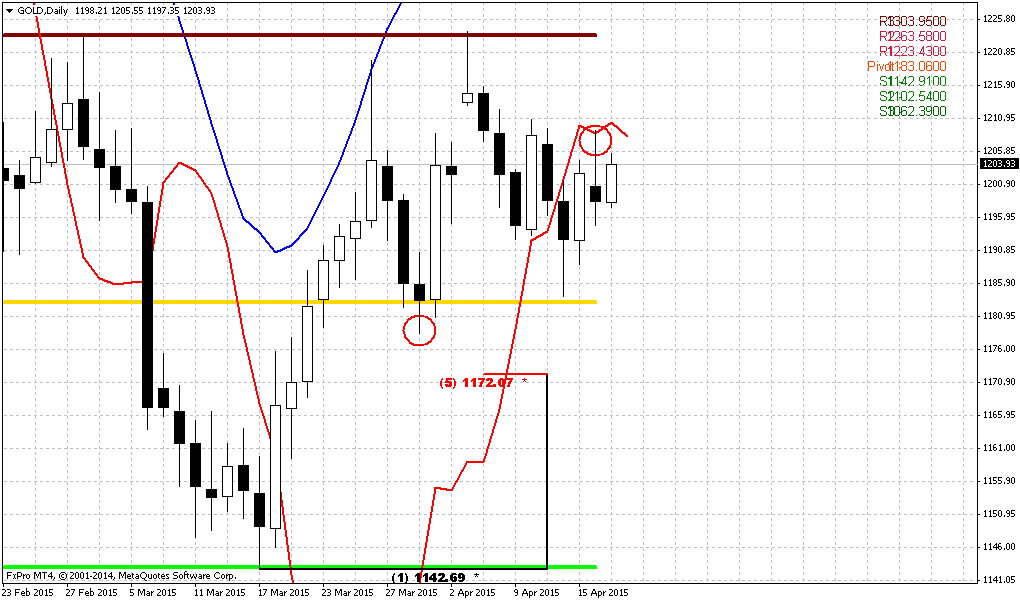
Daily
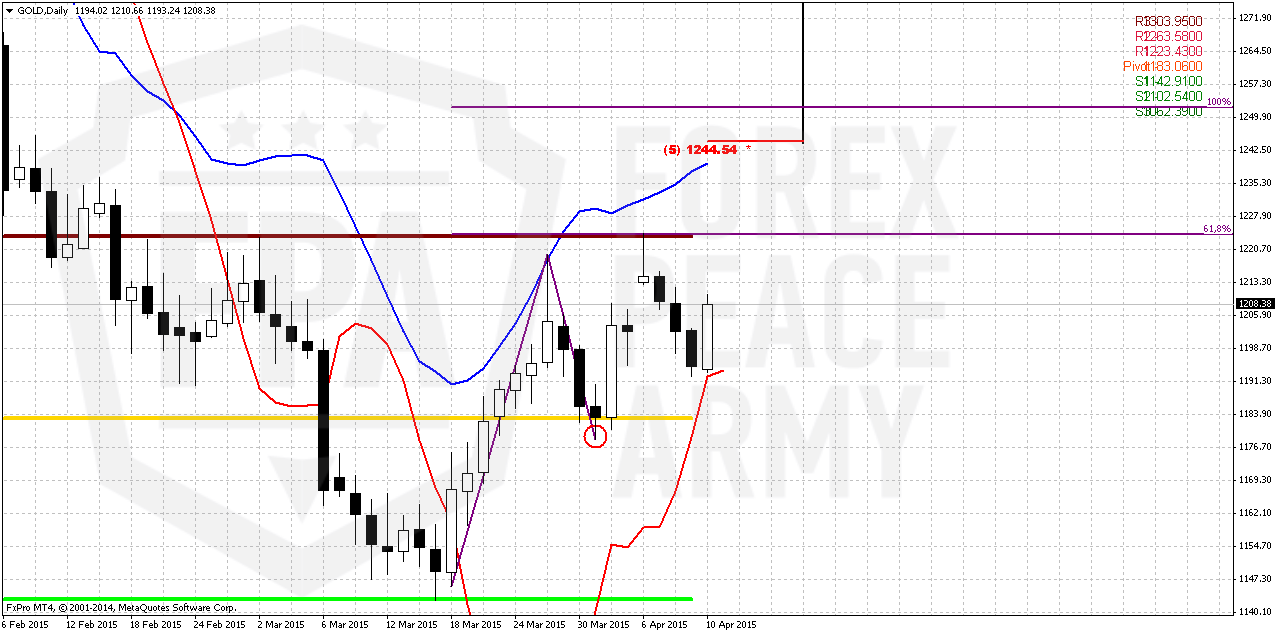
Since we’re mostly interested in weekly grabber’s swing, daily picture is not very valuable for us, especially because we haven’t got any bullish grabbers. And we didn’t get more confidence of upward continuation. Friday candle looks nice, but still it does not change situation drastically. Since weekly time frame is stronger than daily one, we mostly should rely on weekly pattern, since it also has support from sentiment data. Current move up, we probably should treat as chance to take short position at better place…
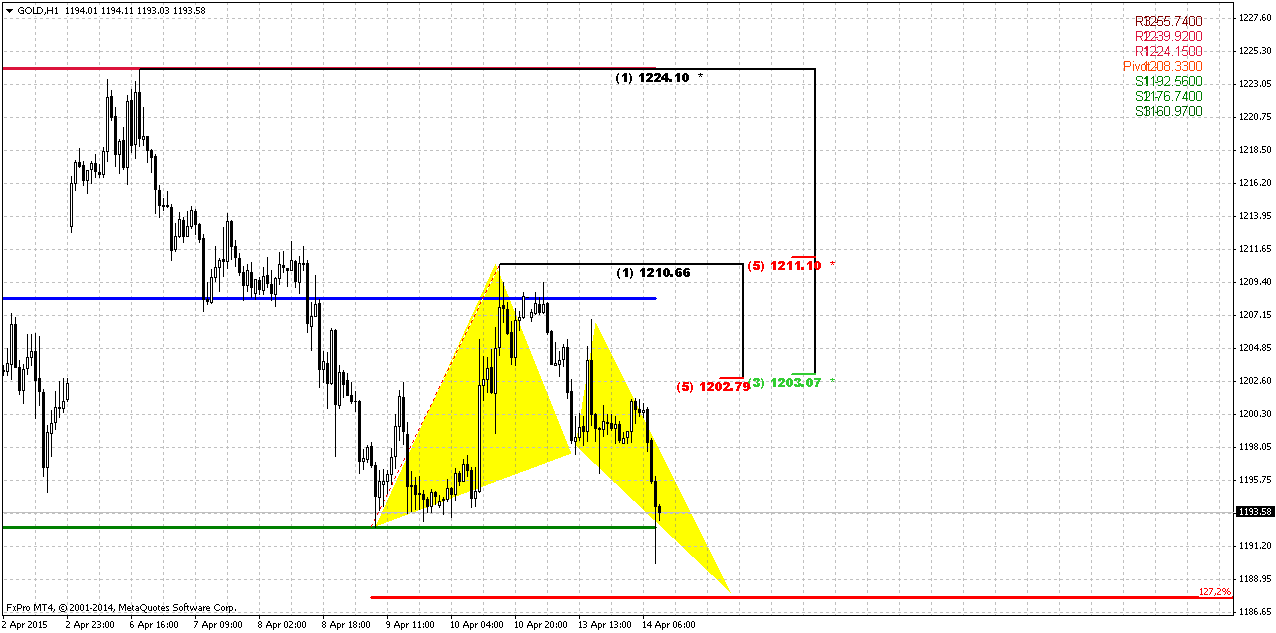
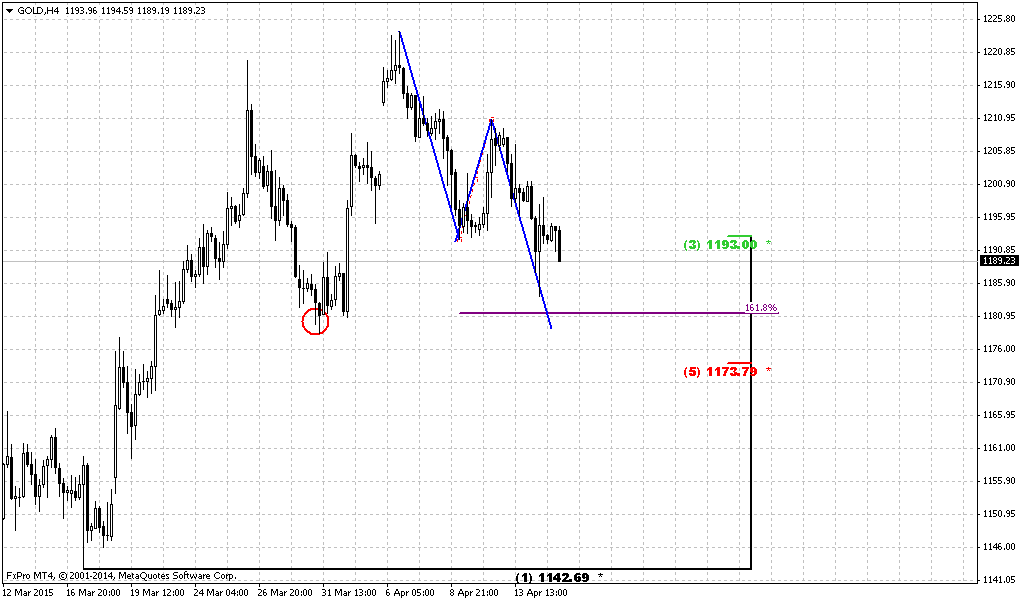
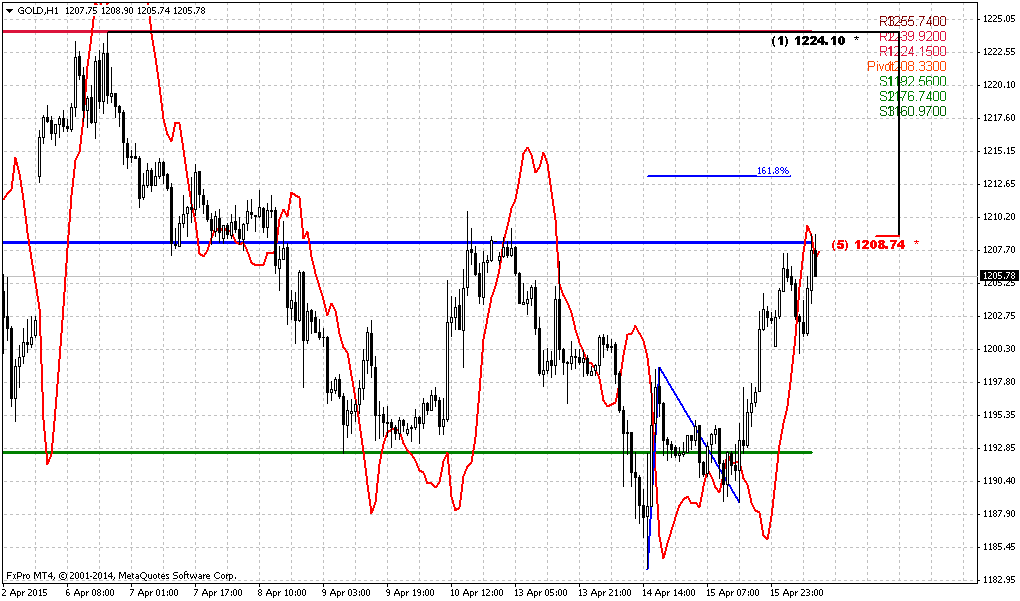
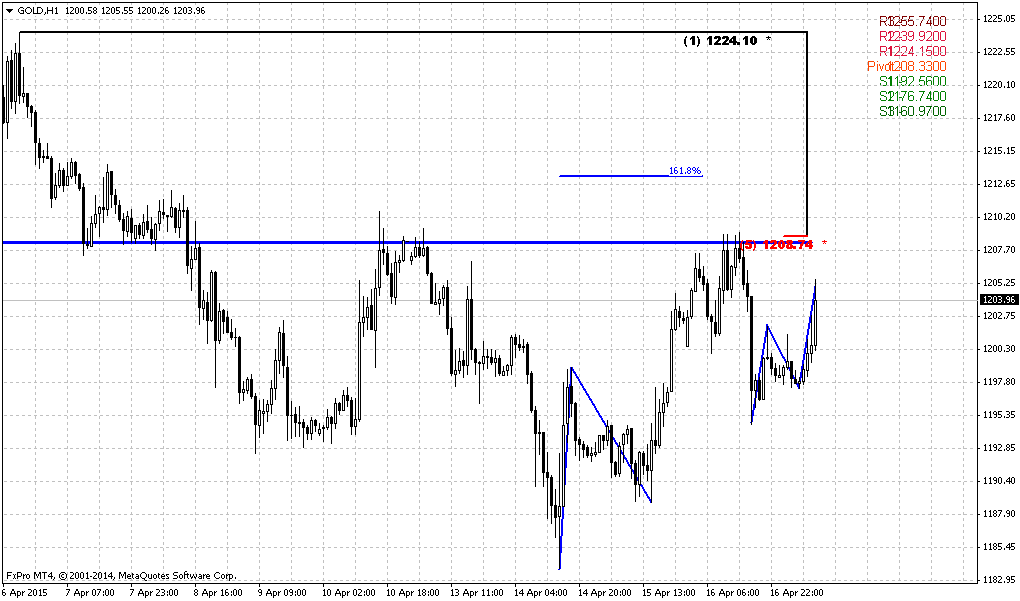
1-hour
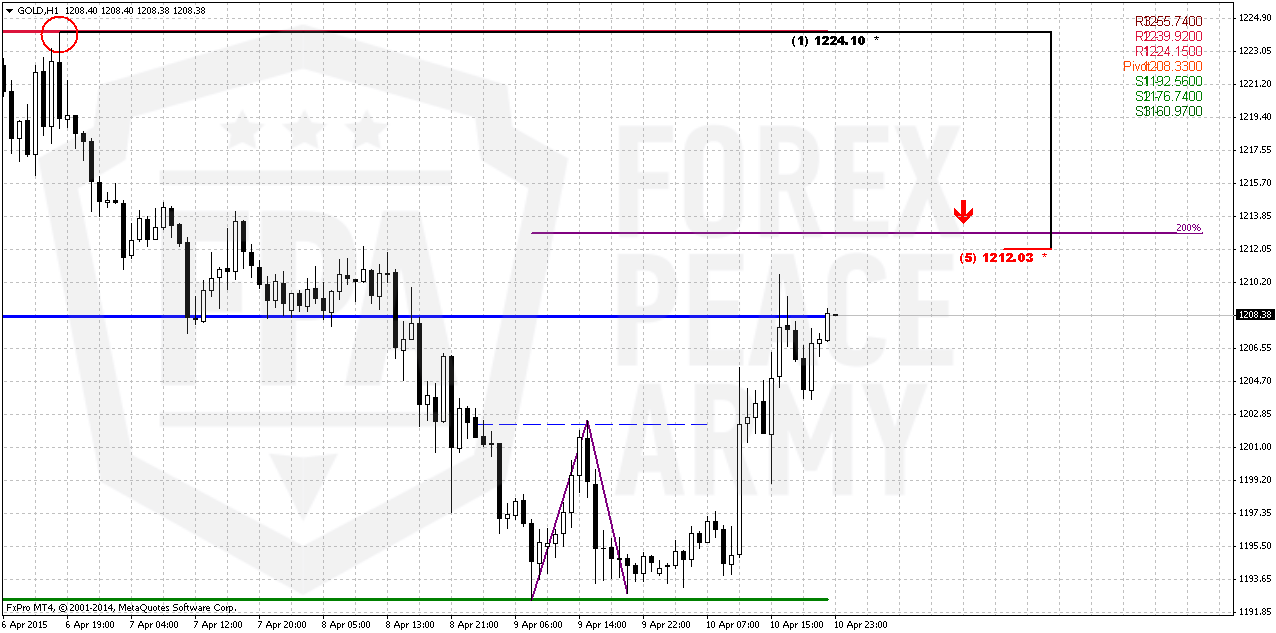
Here is one of the possible ways, how we could deal with weekly grabber. As you can see upside bounce up from Fib level takes the shape of double bottom. Normally, target of DB pattern is distance from neckline to bottoms, counted up in direction of breakout. It gives us level around 1212. This is also 5/8 Fib resistance and will be slightly above WPP. Invalidation point of weekly grabber stands at 1224 top. If market will exceed it – then this setup will fail and gold really will be able continue move higher. Distance till potential stop order looks not really small, so control your position size.
Conclusion:
Long-term picture remains bearish and major patterns stand intact. CFTC and SDPR data does not show on some drastical shifts in sentiment. Thus, upward action has blur perspective and reliability. As weekly chart has given us bearish grabber, we mostly should prepare for taking short position.
The technical portion of Sive's analysis owes a great deal to Joe DiNapoli's methods, and uses a number of Joe's proprietary indicators. Please note that Sive's analysis is his own view of the market and is not endorsed by Joe DiNapoli or any related companies.
Weekly Gold Tading Report prepared by Sive Morten exclusively for ForexPeaceArmy.com
Gold rose on Friday as chart levels were broken, but was still heading for its first weekly fall in four weeks, pressured by a stronger dollar and renewed expectations for a U.S. rate hike this year. Flat initially, it gained momentum after a break of technical resistance at $1,196 that triggered automatic buy orders.
"This move is coming during a week when we didn't really have any gold-positive news but ...the way gold is putting up a fight at the moment is potentially giving some confidence to the market," Saxo Bank senior manager Ole Hansen said.
"But to make headwinds above the resistance area around $1,225 we need to see some real buying coming in."
"The 100-day moving average should serve as some upside resistance," said Matt Bradbard, director at RCM Alternatives, boutique advisory firm in Chicago, referring to spot gold's 100-day moving average at $1,211.69, just above the session high.
Gold on Friday shrugged off the impact of a stronger dollar and world equity markets, which tested record highs.
But the longer-term outlook is still bearish, traders said, and prices had surrendered gains after Federal Reserve officials suggested a June rate hike could still be in play.
Investors tend to shun gold, which does not pay interest, when market expectations point to U.S. interest rates rising.
Gold could drop to a five-year low of $1,100 this year due to the relative health of the U.S. economy compared to Europe and emerging markets, GFMS analysts at Thomson Reuters said.
Premiums for physical gold at the Shanghai Gold Exchange stood at a modest $1-$2 an ounce over the global spot benchmark on Friday.
Recent CFTC data shows small increase in net long position, mostly due shy growth of speculative longs and corresponding contraction of shorts. Open interest mostly stands the same. In general this does not change force balance significantly. As shorts have dropped they have not been restored yet, but no money has come to longs as well. SPDR fund shows not very big outflow of 3 tonnes last week. So, storages have dropped to 734 tonnes. The one thing is interesting here that this drop stands on background of gold upside action, especially in recent two days. So, fundamentally we could make the same conclusion that any upside action right now is dangerous journey to join, will be fragile and unstable and could finish at any moment. It does not mean that we can’t take bullish positions, but it will demand more attention and discipline, especially in stop placing.
Here is detailed breakdown of speculative positions:
Open interest:
Technicals
Monthly
There is really shy difference in close price from previous week. On long-term horizon we still have last big pattern in progress that is Volatility breakout (VOB). It suggests at least 0.618 AB-CD down. And this target is 1050$. At the same time we need 1130 breakout to start clearly speak on 1050 target.
In the beginning of the year market showed solid upside action. Gold was able to exceed yearly pivot, passed half way to Yearly Pivot resistance 1 but right now has reversed down and closed below YPP. From technical point of view this is bearish sign. This could be very significant moment and next logical destination will be yearly pivot support 1 around 1083$.
Recent US economy data mostly shows solid growth, but labor cost not as stably good as unemployment. Many investors concern about anemic wage growth, although in recent time this indicator shows improving. So, it seems that gold will remain hostage of dollar value and US economical data (mostly inflation) in nearest perspective. Approximately the same was announced by Fed in forecast on inflation and had become a reason of dovish approach to rate hiking. Another concern right now is too strong dollar that becomes a problem per se for economy growth.
Still, if we will take into consideration geopolitical situation and risks that have appeared recently, it could happen that situation will change, especially if situation in Ukraine will escalate and peaceful regulation will fail. Day by day we see worrying geopolitical news.
That’s being said, economical data in general (excluding recent NFP report) supports further gold decreasing but geopolicy could bring significant adjustment. Unfortunately the geopolicy is sphere where we can’t do much. As gold has passed through 1200, our next destination point is previous lows at 1130, but since gold is returning to them again – this is temporal destination and we should prepare for further downward action. Besides, right now we can clear recognized bearish dynamic pressure on monthly chart. Take a look, although trend has turned bullish, but market was unable to show more or less meaningful upside action. Right now we see the tendency of lower highs creation and this significantly increases chances on downward breakout.
Weekly
Trend is bearish here. Weekly chart also works “on perspective” since all patterns that we have here mostly are bearish. If you will take a look at weekly chart closely you will find a lot of different targets – AB-CD’s, couple of butterflies etc. By the way, most recent action also could turn to butterfly… and all of them have targets below current level.
On previous week we’ve expected the reaction on poor NFP data but reaction mostly was mild. If even market will continue move up somehow until it will hold below 1313 top – bearish sentiment will be valid, because monthly bearish dynamic pressure will be valid and market will keep chance on forming butterfly. Only if market will move above 1313 top – it will break tendency of lower highs and put under question further downward action.
This looks not very possible right now, especially when we’ve got bearish grabber on weekly. That’s the pattern that could trigger downward continuation. At least we could stick with its range for trading. It suggests taking out of former lows and could lead market simultaneously to AB=CD and butterfly destination points. This confirms that return back to 1130 area will be temporal even and just preparation for further drop.
All other targets stand significantly lower – 1080, 1050 and even 990$.
Daily
Since we’re mostly interested in weekly grabber’s swing, daily picture is not very valuable for us, especially because we haven’t got any bullish grabbers. And we didn’t get more confidence of upward continuation. Friday candle looks nice, but still it does not change situation drastically. Since weekly time frame is stronger than daily one, we mostly should rely on weekly pattern, since it also has support from sentiment data. Current move up, we probably should treat as chance to take short position at better place…
1-hour
Here is one of the possible ways, how we could deal with weekly grabber. As you can see upside bounce up from Fib level takes the shape of double bottom. Normally, target of DB pattern is distance from neckline to bottoms, counted up in direction of breakout. It gives us level around 1212. This is also 5/8 Fib resistance and will be slightly above WPP. Invalidation point of weekly grabber stands at 1224 top. If market will exceed it – then this setup will fail and gold really will be able continue move higher. Distance till potential stop order looks not really small, so control your position size.
Conclusion:
Long-term picture remains bearish and major patterns stand intact. CFTC and SDPR data does not show on some drastical shifts in sentiment. Thus, upward action has blur perspective and reliability. As weekly chart has given us bearish grabber, we mostly should prepare for taking short position.
The technical portion of Sive's analysis owes a great deal to Joe DiNapoli's methods, and uses a number of Joe's proprietary indicators. Please note that Sive's analysis is his own view of the market and is not endorsed by Joe DiNapoli or any related companies.