Sive Morten
Special Consultant to the FPA
- Messages
- 18,690
Fundamentals
Weekly Gold Tading Report prepared by Sive Morten exclusively for ForexPeaceArmy.com
As Reuters reports Gold hit its lowest level in more than a month on Friday, falling for the third straight week as strength in global equities diverted interest from the precious metal, although uncertainty over the timing of a U.S. rate rise kept prices in a tight range.
Spot prices are down 2.2 percent this week, their biggest weekly loss in seven weeks.
World stocks hit all-time highs on Friday as corporate updates in Europe and a post-dotcom-boom peak for the U.S. Nasdaq stoked investor optimism.
"That takes investment demand away from gold," said Bill O'Neill, co-founder of commodities investment firm LOGIC Advisors in Upper Saddle River, New Jersey. O'Neill noted that significant funds were flowing toward European and Japanese equities as well, which he called the "flavor of the moment."
Attention is turning to the Fed's policy meeting next week for stronger clues on when the U.S. central bank will start increasing rates. That would raise the opportunity cost of holding non-yielding bullion, while boosting the dollar.
Weak data on U.S. jobless claims, manufacturing and home sales have hurt the dollar this week, boosting uncertainty over whether the Fed will conduct its first U.S. rate rise in nearly a decade in June or September.
"All the U.S. data up to the next policy meeting will be (scrutinised)," said LBBW analyst Thorsten Proettel.
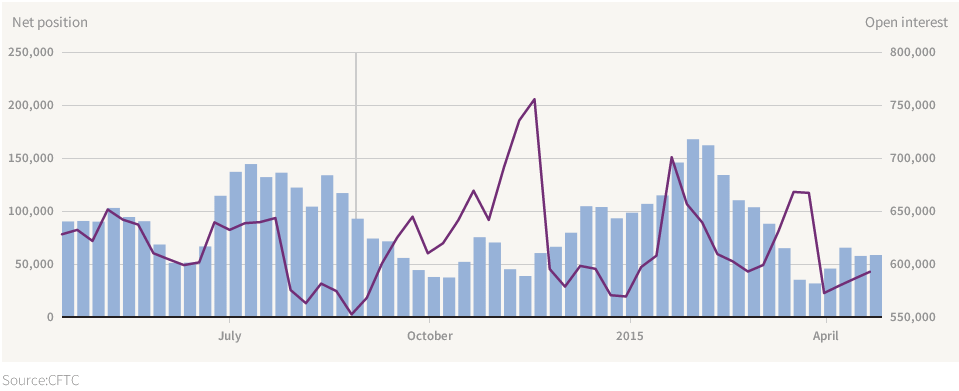
Recent CFTC data shows very shy changes. Open interest shows slow growth and this growth mostly stands due similar increasing of long positions. Short positions after solid drop stand flat. Still recent increase in longs can’t be treated as sentiment change. This is too slow and lazy changes that mostly looks as some fluctuations rather than direct changes. Based on analysis of CFTC data we mostly could say that upside action was just a retracement, based on closing of short position. As soon as all shorts were closed – this trend has finished and last week gold has returned back to downward action. We’ve seen it many times previously.
Here is detailed breakdown of speculative positions:
Open interest:
 Shorts:
 Longs:
 Summary:
Technicals
Monthly
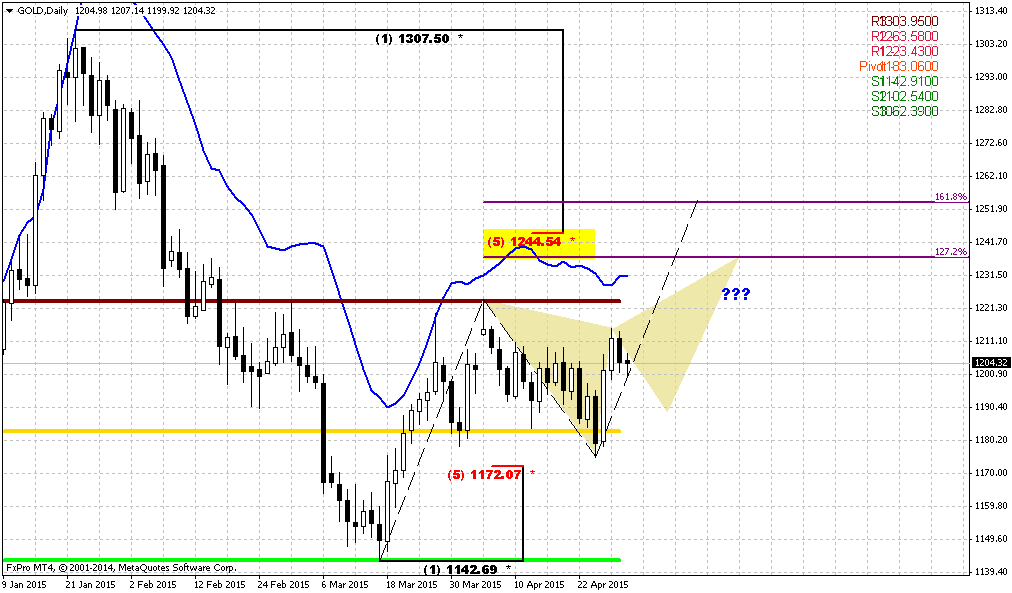
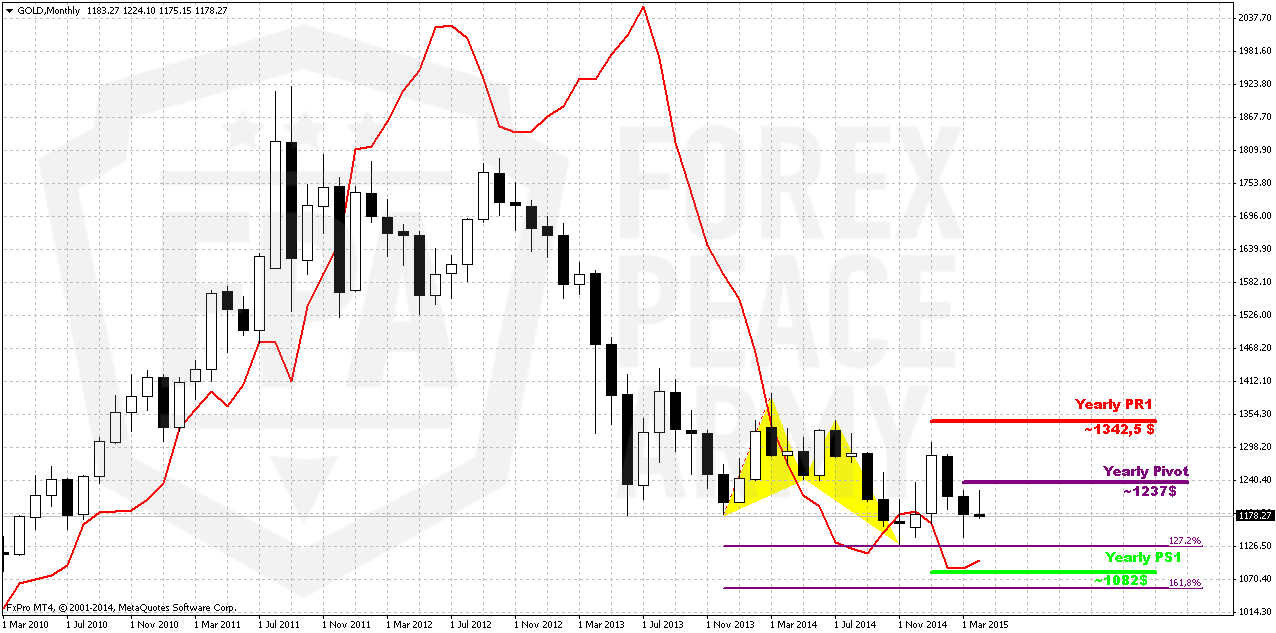
There is really shy difference in close price from previous week. We just could say that downward continuation has become visible again on monthly chart, as well as bearish dynamic pressure. On long-term horizon we still have last big pattern in progress that is Volatility breakout (VOB). It suggests at least 0.618 AB-CD down. And this target is 1050$. At the same time we need 1130 breakout to start clearly speak on 1050 target.
In the beginning of the year market showed solid upside action. Gold was able to exceed yearly pivot, passed half way to Yearly Pivot resistance 1 but right now has reversed down and closed below YPP. From technical point of view this is bearish sign. This could be very significant moment and next logical destination will be yearly pivot support 1 around 1083$.
Recent US economy data mostly was positive but not as strong as investors have expected. Many investors concern about anemic wage growth, although in recent time this indicator shows improving. So, it seems that gold will remain hostage of dollar value and US economical data (mostly inflation) in nearest perspective. Approximately the same was announced by Fed in forecast on inflation and had become a reason of dovish approach to rate hiking. Another concern right now is too strong dollar that becomes a problem per se for economy growth and kills inflation. Prices are fallen so no needs to hike rates. On coming week again – all investors will be watching for Fed decision.
Still, if we will take into consideration geopolitical situation and risks that have appeared recently, it could happen that situation will change, especially if situation in Ukraine will escalate and peaceful regulation will fail. Day by day we see worrying geopolitical news.
That’s being said, economical data in general still supports further gold decreasing in long term but geopolicy could bring significant adjustment. Unfortunately the geopolicy is sphere where we can’t do much. As gold has passed through 1200, our next destination point is previous lows at 1130, but since gold is returning to them again – this is temporal destination and we should prepare for further downward action. Besides, right now we can clear recognized bearish dynamic pressure on monthly chart. Take a look, although trend has turned bullish, but market was unable to show more or less meaningful upside action. Right now we see the tendency of lower highs creation and this significantly increases chances on downward breakout.
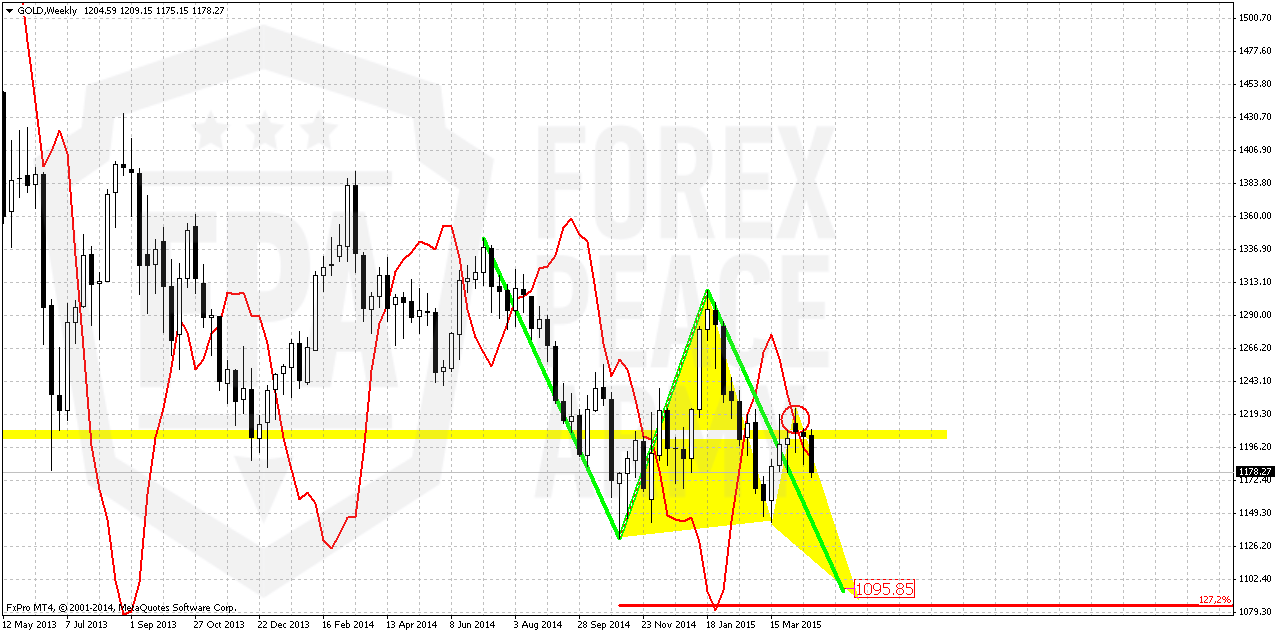
Weekly
Weekly chart also works “on perspective” since all patterns that we have here mostly are bearish. If you will take a look at weekly chart closely you will find a lot of different targets – AB-CD’s, couple of butterflies etc. By the way, most recent action also could turn to butterfly… and all of them have targets below current level.
Previously we’ve expected the reaction on poor NFP data but reaction mostly was mild. If even market will continue move up somehow until it will hold below 1313 top – bearish sentiment will be valid, because monthly bearish dynamic pressure will be valid and market will keep chance on forming butterfly. Only if market will move above 1313 top – it will break tendency of lower highs and put under question further downward action.
This looks not very possible right now. Grabber has started to work, and right now here we even could see the signs of bearish dynamic pressure, since gold moves lower while trend is bullish. CFTC data is still mostly flat. This points on high probability of taking out 1140-1130 lows and lead market simultaneously to AB=CD and butterfly destination points.
This confirms that return back to 1130 area will be temporal even and just preparation for further drop. So, currently we have no sense to change trading plan since our context is still valid. To destroy this setup gold needs at least erase the grabber.
All other targets stand significantly lower – 1080, 1050 and even 990$.
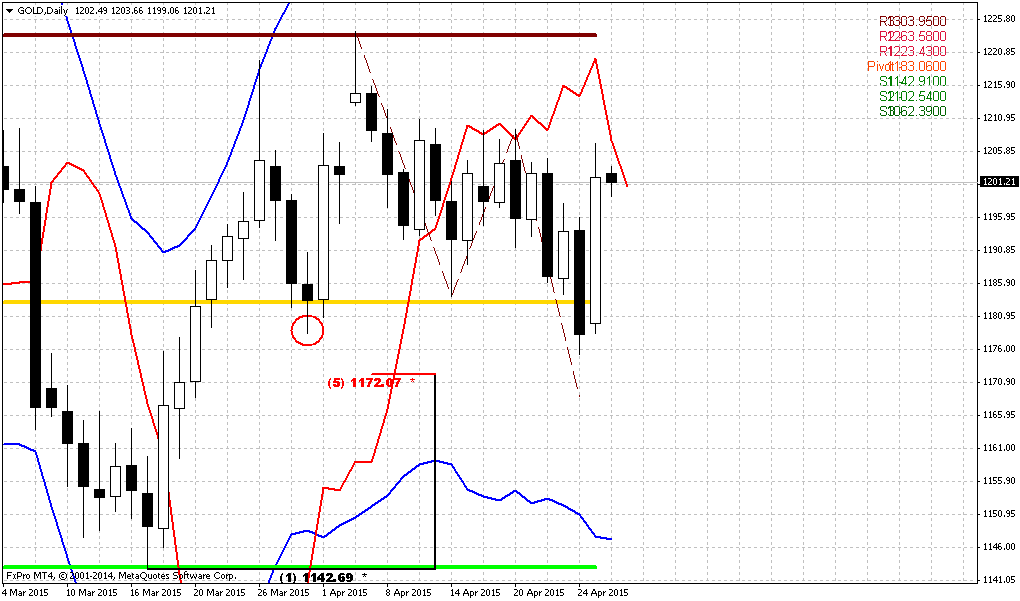
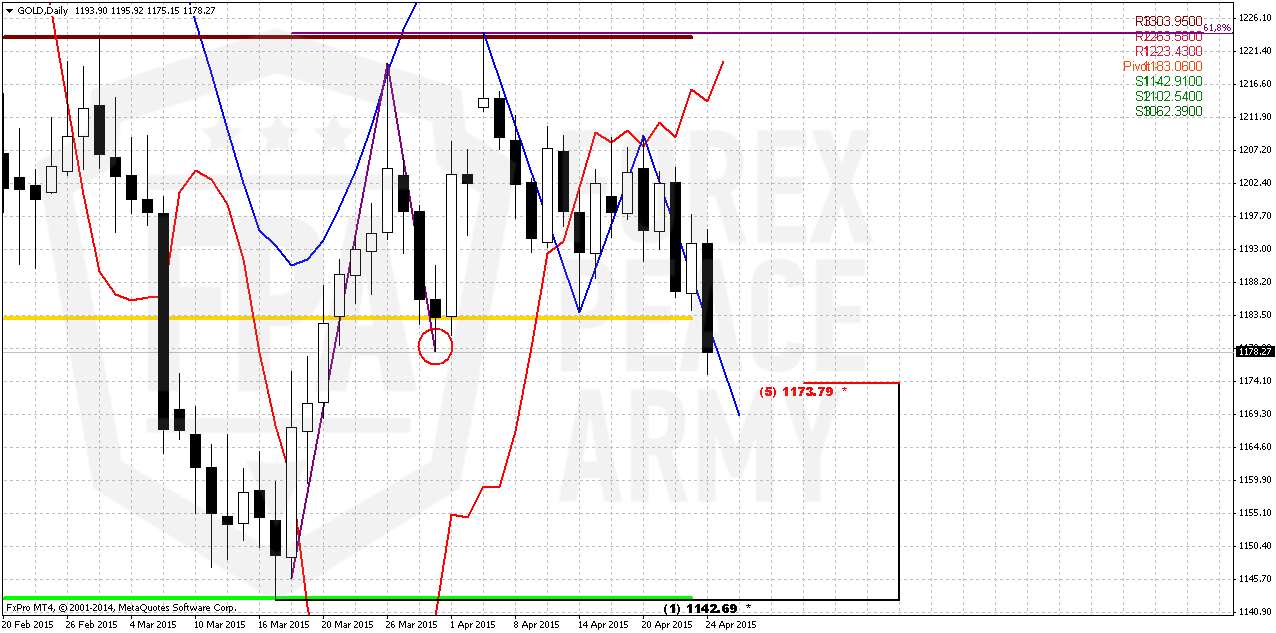
Daily
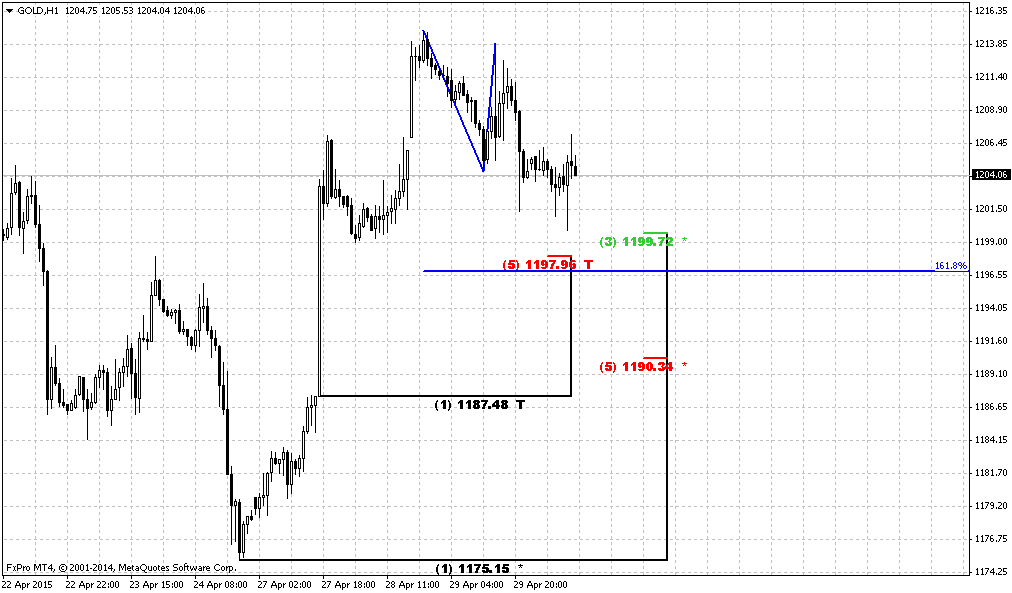
Finally here we’ve got clarification of the picture in short-term perspective. Both bearish grabbers have worked nice. Gold has moved below 1175 lows and erase upside AB-CD pattern. Thus, this pattern has reached only minor 0.618 extension. Price has moved below MPP. Also, take a look that MPR1 has held upside action in April and kept valid long term bearish trend.
Since we expect that downward action will continue, we need to wait some upside retracement when we will get chance to take short position, if of cause, you haven’t taken it last week on weekly grabber.
This retracement could happen very soon, since market is approaching 1170 Agreement area – combination of downward AB-CD pattern and Fib support level.
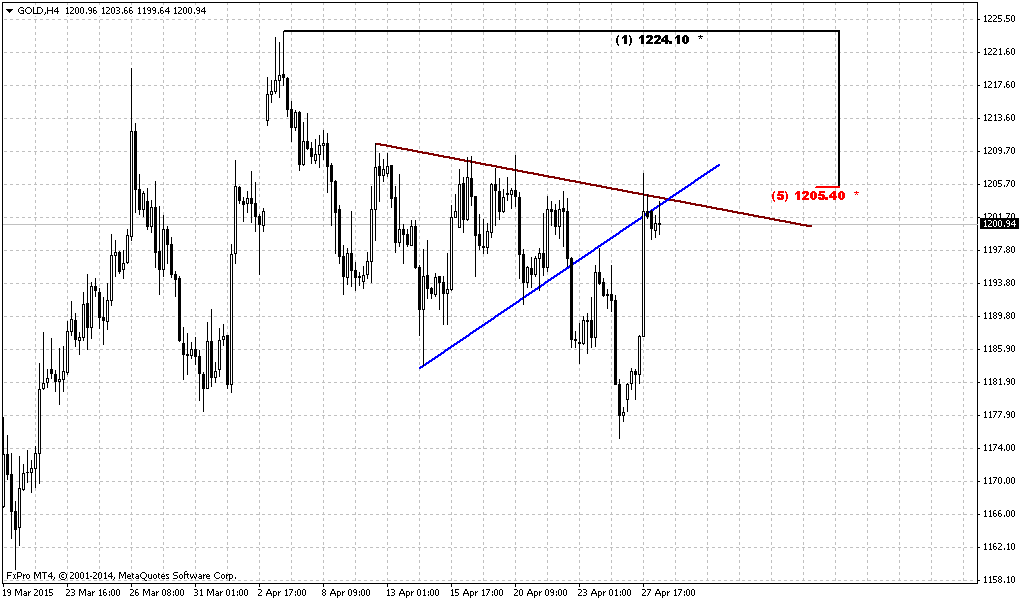
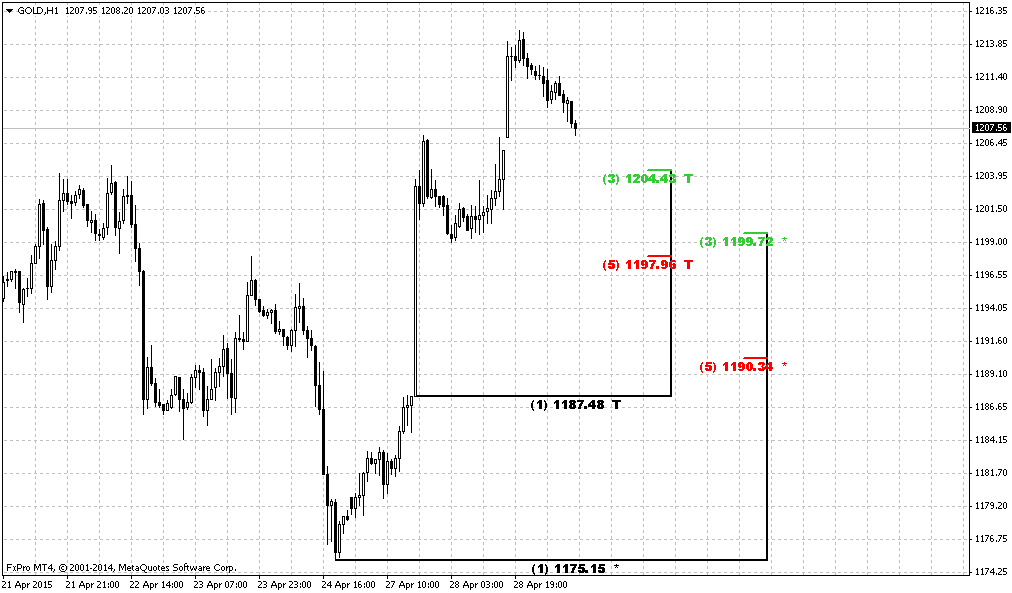
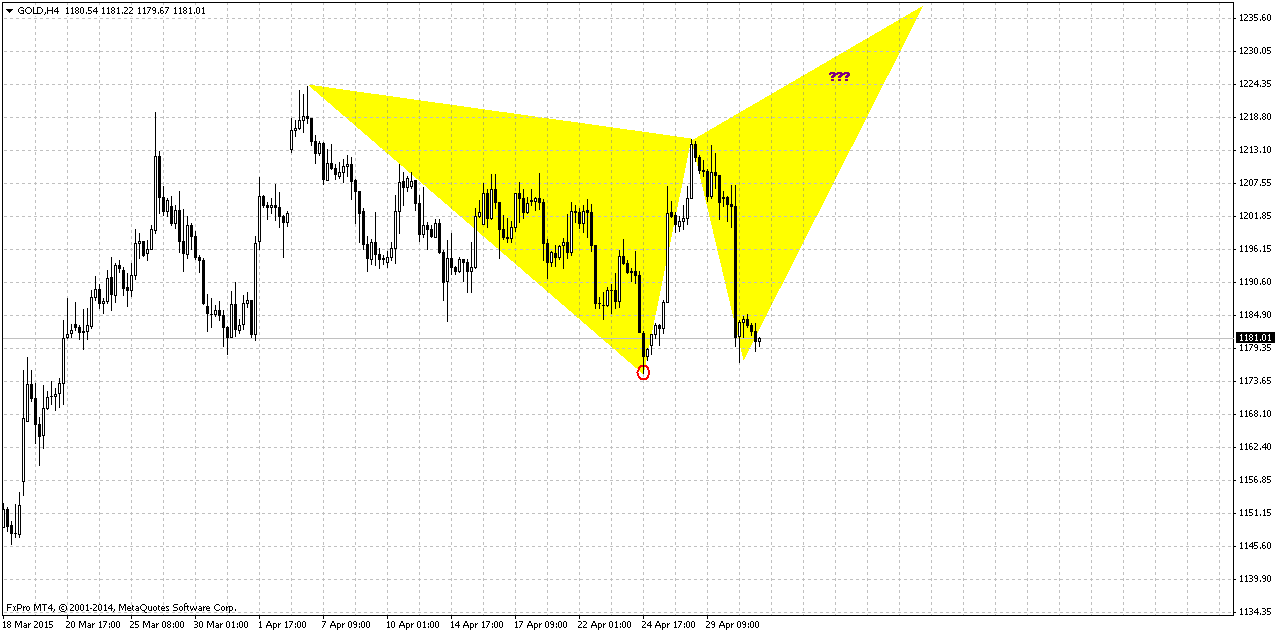
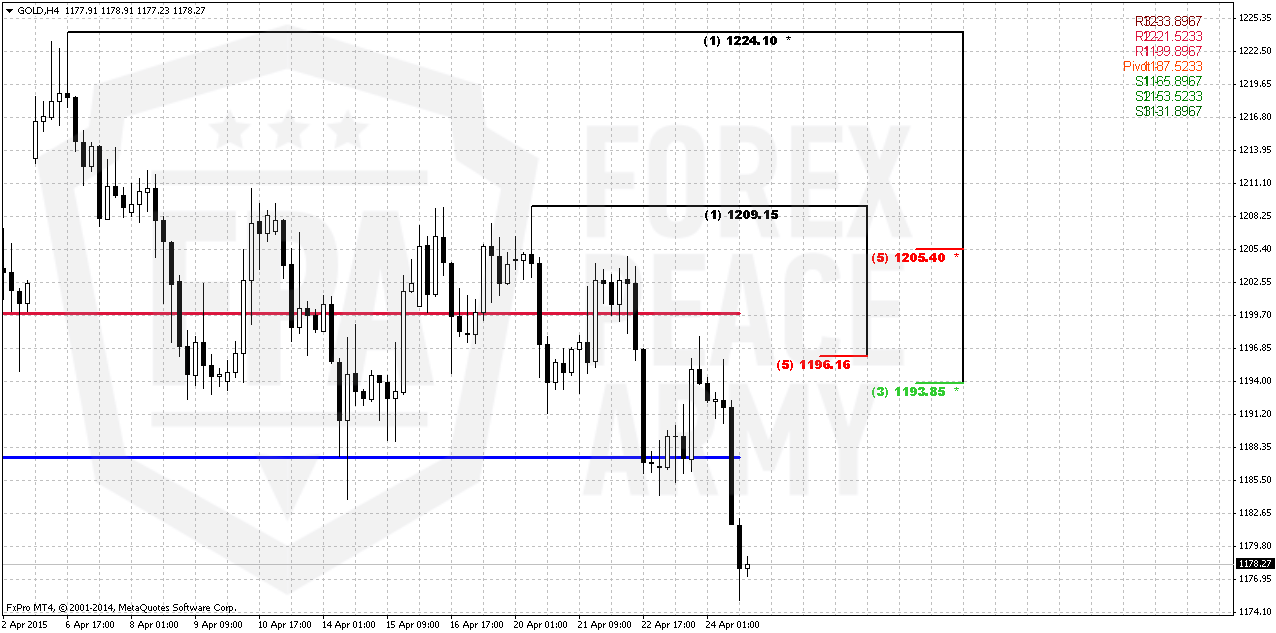
4-hour
Although daily AB-CD has not been completed yet, and market probably will move slightly lower, but idea will be the same as I’ve drawn here. As the target of possible bounce we will be looking at K-resistance. Now it stands at 1193-1196, but also could move a bit lower as soon as AB-CD pattern on daily will be completed. May be it even will appear around WPP…
Conclusion:
Long-term picture remains bearish and major patterns stand intact and even have become clearer last week. CFTC and SDPR data does not show on some drastical shifts in sentiment. Thus, upward action has blur perspective and reliability. As weekly chart has given us bearish grabber and dynamic pressure, we mostly should prepare for taking short position. At the same time recent data was soft and investors have taken more balanced position and mostly wait for some driving factor that finally could clarify situation and at least short-term direction. May be coming Fed meeting will shed more light on situation.
The technical portion of Sive's analysis owes a great deal to Joe DiNapoli's methods, and uses a number of Joe's proprietary indicators. Please note that Sive's analysis is his own view of the market and is not endorsed by Joe DiNapoli or any related companies.
Weekly Gold Tading Report prepared by Sive Morten exclusively for ForexPeaceArmy.com
As Reuters reports Gold hit its lowest level in more than a month on Friday, falling for the third straight week as strength in global equities diverted interest from the precious metal, although uncertainty over the timing of a U.S. rate rise kept prices in a tight range.
Spot prices are down 2.2 percent this week, their biggest weekly loss in seven weeks.
World stocks hit all-time highs on Friday as corporate updates in Europe and a post-dotcom-boom peak for the U.S. Nasdaq stoked investor optimism.
"That takes investment demand away from gold," said Bill O'Neill, co-founder of commodities investment firm LOGIC Advisors in Upper Saddle River, New Jersey. O'Neill noted that significant funds were flowing toward European and Japanese equities as well, which he called the "flavor of the moment."
Attention is turning to the Fed's policy meeting next week for stronger clues on when the U.S. central bank will start increasing rates. That would raise the opportunity cost of holding non-yielding bullion, while boosting the dollar.
Weak data on U.S. jobless claims, manufacturing and home sales have hurt the dollar this week, boosting uncertainty over whether the Fed will conduct its first U.S. rate rise in nearly a decade in June or September.
"All the U.S. data up to the next policy meeting will be (scrutinised)," said LBBW analyst Thorsten Proettel.
Recent CFTC data shows very shy changes. Open interest shows slow growth and this growth mostly stands due similar increasing of long positions. Short positions after solid drop stand flat. Still recent increase in longs can’t be treated as sentiment change. This is too slow and lazy changes that mostly looks as some fluctuations rather than direct changes. Based on analysis of CFTC data we mostly could say that upside action was just a retracement, based on closing of short position. As soon as all shorts were closed – this trend has finished and last week gold has returned back to downward action. We’ve seen it many times previously.
Here is detailed breakdown of speculative positions:
Open interest:
Technicals
Monthly
There is really shy difference in close price from previous week. We just could say that downward continuation has become visible again on monthly chart, as well as bearish dynamic pressure. On long-term horizon we still have last big pattern in progress that is Volatility breakout (VOB). It suggests at least 0.618 AB-CD down. And this target is 1050$. At the same time we need 1130 breakout to start clearly speak on 1050 target.
In the beginning of the year market showed solid upside action. Gold was able to exceed yearly pivot, passed half way to Yearly Pivot resistance 1 but right now has reversed down and closed below YPP. From technical point of view this is bearish sign. This could be very significant moment and next logical destination will be yearly pivot support 1 around 1083$.
Recent US economy data mostly was positive but not as strong as investors have expected. Many investors concern about anemic wage growth, although in recent time this indicator shows improving. So, it seems that gold will remain hostage of dollar value and US economical data (mostly inflation) in nearest perspective. Approximately the same was announced by Fed in forecast on inflation and had become a reason of dovish approach to rate hiking. Another concern right now is too strong dollar that becomes a problem per se for economy growth and kills inflation. Prices are fallen so no needs to hike rates. On coming week again – all investors will be watching for Fed decision.
Still, if we will take into consideration geopolitical situation and risks that have appeared recently, it could happen that situation will change, especially if situation in Ukraine will escalate and peaceful regulation will fail. Day by day we see worrying geopolitical news.
That’s being said, economical data in general still supports further gold decreasing in long term but geopolicy could bring significant adjustment. Unfortunately the geopolicy is sphere where we can’t do much. As gold has passed through 1200, our next destination point is previous lows at 1130, but since gold is returning to them again – this is temporal destination and we should prepare for further downward action. Besides, right now we can clear recognized bearish dynamic pressure on monthly chart. Take a look, although trend has turned bullish, but market was unable to show more or less meaningful upside action. Right now we see the tendency of lower highs creation and this significantly increases chances on downward breakout.
Weekly
Weekly chart also works “on perspective” since all patterns that we have here mostly are bearish. If you will take a look at weekly chart closely you will find a lot of different targets – AB-CD’s, couple of butterflies etc. By the way, most recent action also could turn to butterfly… and all of them have targets below current level.
Previously we’ve expected the reaction on poor NFP data but reaction mostly was mild. If even market will continue move up somehow until it will hold below 1313 top – bearish sentiment will be valid, because monthly bearish dynamic pressure will be valid and market will keep chance on forming butterfly. Only if market will move above 1313 top – it will break tendency of lower highs and put under question further downward action.
This looks not very possible right now. Grabber has started to work, and right now here we even could see the signs of bearish dynamic pressure, since gold moves lower while trend is bullish. CFTC data is still mostly flat. This points on high probability of taking out 1140-1130 lows and lead market simultaneously to AB=CD and butterfly destination points.
This confirms that return back to 1130 area will be temporal even and just preparation for further drop. So, currently we have no sense to change trading plan since our context is still valid. To destroy this setup gold needs at least erase the grabber.
All other targets stand significantly lower – 1080, 1050 and even 990$.
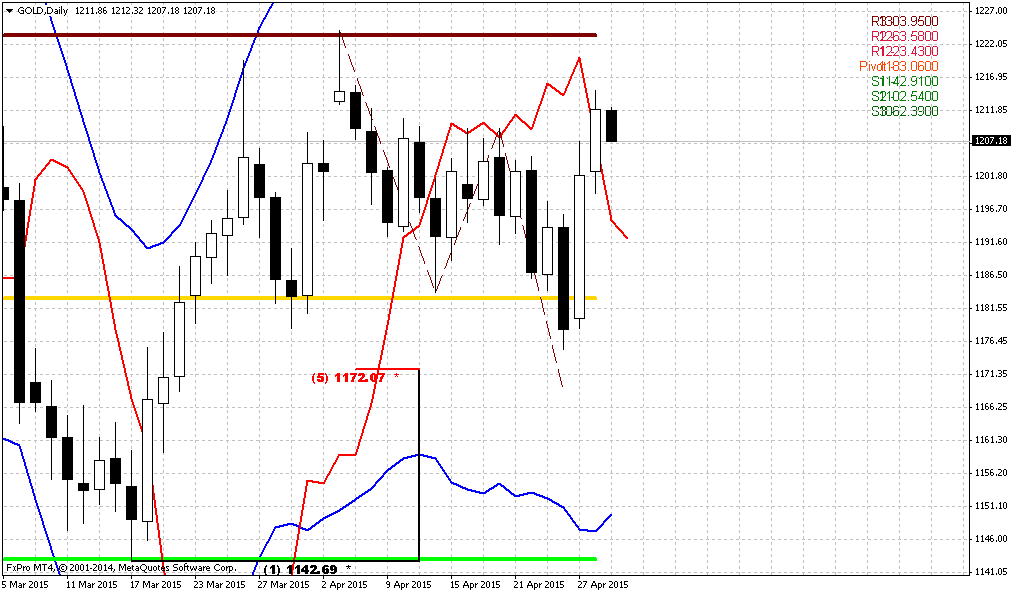
Daily
Finally here we’ve got clarification of the picture in short-term perspective. Both bearish grabbers have worked nice. Gold has moved below 1175 lows and erase upside AB-CD pattern. Thus, this pattern has reached only minor 0.618 extension. Price has moved below MPP. Also, take a look that MPR1 has held upside action in April and kept valid long term bearish trend.
Since we expect that downward action will continue, we need to wait some upside retracement when we will get chance to take short position, if of cause, you haven’t taken it last week on weekly grabber.
This retracement could happen very soon, since market is approaching 1170 Agreement area – combination of downward AB-CD pattern and Fib support level.
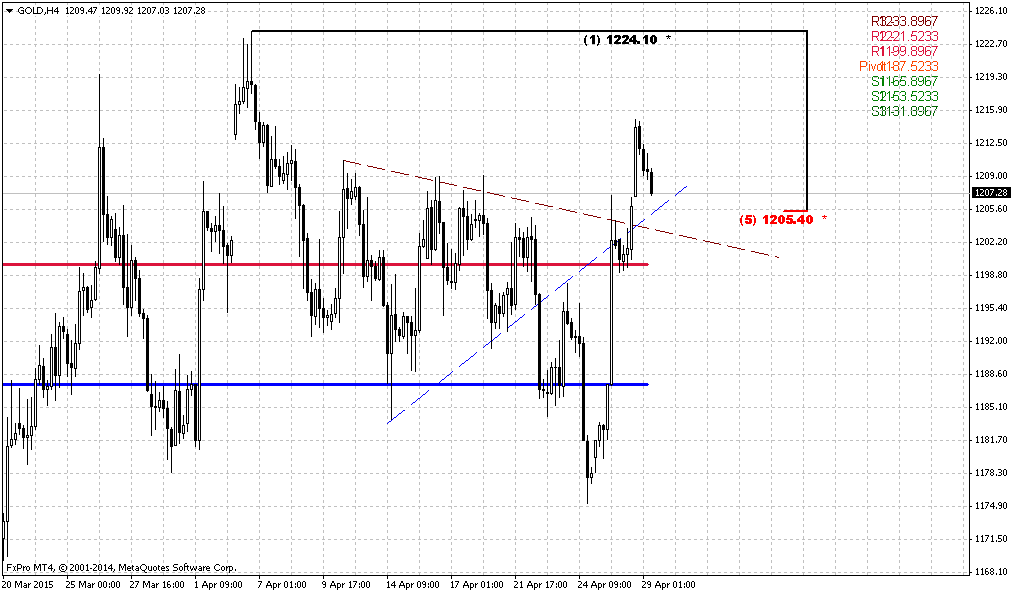
4-hour
Although daily AB-CD has not been completed yet, and market probably will move slightly lower, but idea will be the same as I’ve drawn here. As the target of possible bounce we will be looking at K-resistance. Now it stands at 1193-1196, but also could move a bit lower as soon as AB-CD pattern on daily will be completed. May be it even will appear around WPP…
Conclusion:
Long-term picture remains bearish and major patterns stand intact and even have become clearer last week. CFTC and SDPR data does not show on some drastical shifts in sentiment. Thus, upward action has blur perspective and reliability. As weekly chart has given us bearish grabber and dynamic pressure, we mostly should prepare for taking short position. At the same time recent data was soft and investors have taken more balanced position and mostly wait for some driving factor that finally could clarify situation and at least short-term direction. May be coming Fed meeting will shed more light on situation.
The technical portion of Sive's analysis owes a great deal to Joe DiNapoli's methods, and uses a number of Joe's proprietary indicators. Please note that Sive's analysis is his own view of the market and is not endorsed by Joe DiNapoli or any related companies.